Canadian Pipelines Lead The Way

Sentiment among energy investors remains poor. The S&P E&P ETF (XOP) is -21% for the year. Energy has sunk to 4% of the S&P500. The Alerian MLP Infrastructure index (AMZIX) is -3% YTD and reached a low of 44% off its August 2014 high last week. This contrasts with the S&P500, which is +26% for the year. MLP tax loss selling has caused further downward pressure, since so many investors have realized gains in other sectors to pair against energy losses.

Although energy has been weak, wide performance divergences exist. Midstream energy infrastructure has done far better than the E&P companies that are its principal customers. Within that, pipeline corporations have done better than MLPs, which continue to suffer from erosion of interest among their traditional income-seeking investor base. Canadian corporations are among the best performers. TC Energy (TRP, formerly Transcanada), is +50% for the year including dividends, even handily beating the S&P500 with its 26% gain.  Few investors in midstream energy infrastructure realize how well TRP has performed, unless they own it. Enbridge (ENB), North America’s biggest midstream energy infrastructure company and also Canadian, is +31%. Pembina (PBA), a less well known Canadian pipeline company, is +27%.

.avia-image-container.av-1bau5y1-5b28cf8d1b8236b734b9289d97550386 img.avia_image{ box-shadow:none; } .avia-image-container.av-1bau5y1-5b28cf8d1b8236b734b9289d97550386 .av-image-caption-overlay-center{ color:#ffffff; }

Like their banks, Canadians pipeline companies tend to be run more conservatively. Over the past five years they’ve also set themselves apart from the rest of the sector. Their U.S. cousins would do well to adopt some of their disciplined capital allocation and prudent management practices. These three companies represent 55% of the 2019 Free Cash Flow (FCF) we project for the industry. Their performance supports the case that growing FCF leads to a higher stock price (see The Coming Pipeline Cash Gusher).

.avia-image-container.av-o8tri1-2c6e9c188fee31346073d5ad9311bfb7 img.avia_image{ box-shadow:none; } .avia-image-container.av-o8tri1-2c6e9c188fee31346073d5ad9311bfb7 .av-image-caption-overlay-center{ color:#ffffff; }

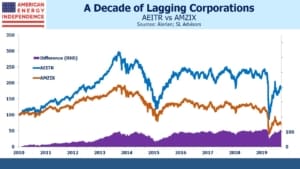
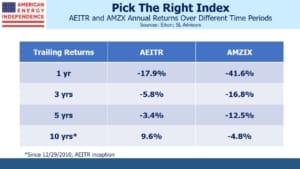
The Alerian MLP ETF (AMLP) is a rich source of opprobrium on this blog, because of its flawed tax structure (see MLP Funds Made for Uncle Sam). It does retain one useful feature though, in that it’s relatively easy to short. Big pipeline companies are under-represented in the Alerian index, because most of them are not MLPs. So AMZIX is stuffed full of what investors don’t want.  AMLP follows AMZIX, albeit from a distance. Because of its structure, since inception performance of 1.6% is only half its benchmark of 3.2%. AMLP is the worst performing passive index fund in history. This year AMZIX is 15% behind the investable American Energy Independence Index (AEITR), which is 80% corporations, including the abovementioned Canadians.

.avia-image-container.av-1jfvpw9-7102e5eb1b1957bbb105597ec60839dd img.avia_image{ box-shadow:none; } .avia-image-container.av-1jfvpw9-7102e5eb1b1957bbb105597ec60839dd .av-image-caption-overlay-center{ color:#ffffff; }

Comparing the two indices, one can see the recent sharp divergence in performance, which was probably exacerbated by tax-loss selling of MLPs. Short AMLP and long an AEITR-linked security has been a profitable trade. AMLP’s tax drag hurts in a rising market, where its flawed structure impedes its ability to appreciate with its underlying portfolio. But recent weakness has been led by the MLPs that predominate in AMLP, highlighting the importance of being in the right kinds of companies in this sector. Investors are favoring well-run Canadian pipeline corporations and shunning MLPs.

The Canadian pipelines offer powerful evidence that it’s possible to generate steady returns in this business. Those U.S. companies that perform well over the next couple of years will do so by adopting more of their culture from north of the border. Assuming FCF grows as we expect across the sector, performance of the Canadian stocks suggests positive returns should follow.

We are invested in ENB, PBA and TRP. We are short AMLP

We manage an ETF which tracks the American Energy Independence Index


Leverage Wipes Out Investor’s Bet on Enlink

Managers of client capital invested in midstream energy infrastructure have had to explain recent weak performance to investors frustrated at missing out on the buoyant S&P500. We summarized the many conversations we’ve had last week (see When Will MLPs Recover?). The sector is up this year, although investors in MLP-only products like the Alerian MLP ETF (AMLP) are lagging the stock market by 25%, and pipeline corporations by 14%.

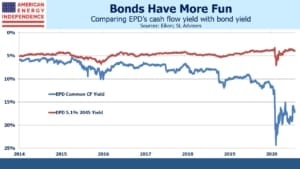
Energy remains out of favor to be sure, but midstream energy infrastructure bankruptcies remain rare. As much as fund outflows have pushed equity valuations to levels indicating financial stress, bond investors don’t share the angst. Long term investment grade debt in many cases yields less than the dividend on a company’s common equity.

If schadenfreude is your thing, consider the portfolio managers of Global Infrastructure Partners’ (GIP) GIP III fund. In July of last year, they invested $3.125BN into Enlink Midstream LLC (ENLC) and Enlink Midstream Partners, LP (ENLK). Following a simplification a few months later, GIP III wound up with 46.1% of ENLC, the surviving entity, and control of the managing member. $1BN of the $3.125BN was funded with a term loan, because private equity investors always add debt to juice their returns. So GIP III invested $2.125MM of equity.

We don’t use leverage ourselves. Midstream energy infrastructure businesses already operate with leverage that credit rating agencies assess in setting their credit ratings. To add borrowings on top is to reject the agencies as needlessly pessimistic. GIP III wanted a little more upside.

.avia-image-container.av-1t7zh19-01cb711b8791492d73f2a4a4a1af18d2 img.avia_image{ box-shadow:none; } .avia-image-container.av-1t7zh19-01cb711b8791492d73f2a4a4a1af18d2 .av-image-caption-overlay-center{ color:#ffffff; }

ENLC’s entire market capitalization is currently $2.6BN, valuing GIP III’s 46% stake at $1.22BN. After the $1BN term loan, GIP III’s $2.125BN equity investment is worth $225MM. On a mark-to-market basis, they’re down around 90%. Losing that much that quickly, even in this sector, is stunning. It shows that the most sophisticated institutional investors can get it spectacularly wrong. Few, including us, thought ENLC could sink this low. Its dividend yield is now 20%

GIP has built a strong reputation investing in infrastructure. They manage $51BN across various portfolios (or perhaps more correctly, now $49BN after adjusting for ENLC). They raised the funds for GIP III on the basis of their past track record. They even highlighted their ENLC investment in the marketing materials for the next fund, GIP IV.

Of course there’s no gain in someone else’s losses – but ENLC investors need to consider what GIP will do. Private equity firms generally avoid holding publicly traded securities – the constantly fluctuating valuations add unwanted NAV volatility.

Included in the list of Risk Factors in ENLC’s 2018 10K is:

“GIP has pledged all of the equity interests that it owns in ENLC and ENLC’s managing member to GIP’s lenders under its credit facility. A default under GIP’s credit facility could result in a change of control of the Managing Member.”

The paragraph goes on to explain that, “…if a default under such credit facility were to occur, the lenders could foreclose on the pledged equity interests.”

So the lender could, in theory, seize GIP III’s equity stake in ENLC and sell it to pay back the loan. It’s likely that whatever loan covenants were attached have already been breached, and in the apparent absence of any large sale of ENLC stock, one must assume that a renegotiation has taken place.

On ENLC’s recent earnings call, James Carreker of US Capital Advisors pursued a line of questions relating to GIP’s term loan, noting the reference to it in ENLC’s Risk Factors section of its 10K. CFO Eric Batchelder refused to comment, and offered to “…talk about it offline.”

.avia-image-container.av-18x3qt9-d994bb8fd95d9989d76cce5601aea733 img.avia_image{ box-shadow:none; } .avia-image-container.av-18x3qt9-d994bb8fd95d9989d76cce5601aea733 .av-image-caption-overlay-center{ color:#ffffff; }

GIP’s intentions with respect to its ENLC stake are a material consideration for the other investors. ENLC’s 10K warns that, “our operating agreement limits the liability of, and eliminates and replaces the fiduciary duties that would otherwise be owed by, the Managing Member and also restricts the remedies available to our unitholders for actions that, without the provisions of the operating agreement, might constitute breaches of fiduciary duty.” Although ENLC is an LLC, like other publicly traded partnerships in this sector it provides weak investor protections.

The 10K  goes on to point out: “Our operating agreement contains provisions that eliminate and replace the fiduciary standards that the Managing Member would otherwise be held to by state fiduciary duty law.”  Further on: “…whether or not to seek the approval of the conflicts committee of the board of directors of the Managing Member, or the unitholders, or neither, of any conflicted transaction.”

ENLC’s operating agreement gives GIP an extreme asymmetric position over public holders through its role as managing member. It may have backfired on them. This blog regularly chronicles management self-dealing (see Blackstone and Tallgrass Discredit the MLP Model for example). Growing concerns of abuse and unethical (if legal) behavior have likely caused generalist investors to avoid ENLC, because of GIP’s power to similarly exploit other investors. GIP’s selective rights and canceled obligations have probably hurt ENLC’s stock price.

.avia-image-container.av-w79em5-451b094b27064edf9dc839b7765914d1 img.avia_image{ box-shadow:none; } .avia-image-container.av-w79em5-451b094b27064edf9dc839b7765914d1 .av-image-caption-overlay-center{ color:#ffffff; }

Given the substantial drop in ENLC since GIP III’s investment, you might think acquiring the rest of the company would be compelling. GIP III likely doesn’t have the ability, and because the different pools of capital managed by GIP have different investors, there would be inevitable conflict of interest concerns if, say, GIP IV bought the balance. It could be perceived that one fund was bailing out another’s poor investment decision. Private equity has to deal with that issue all the time though, and it’s likely they could find a solution. It’s similar to the conflicts committees that usually rubber stamp MLP decisions on capital allocation.

There’s probably a strong motivation for GIP to resolve this issue by year’s end, when GIP III’s annual financials will include ENLC’s public stock price performance. You can be sure they’re pondering their options right now.

We are invested in ENLC and TGE


Natural Gas Profits Remain Elusive

Coal is by any measure an environmental and climate disaster. The world relies on coal in various forms for 27% of its primary energy, and it’s responsible for  40% of its CO2 emissions from fuels. Although it possesses lower energy density than oil or natural gas, coal is relatively easy to transport and store which explains its widespread use. It powered the industrial revolution before rich countries started switching to cleaner-burning natural gas due to local pollution. Today, China consumes half the world’s coal.

.avia-image-container.av-1c84aks-581c2abc8b23a34075853582a177deca img.avia_image{ box-shadow:none; } .avia-image-container.av-1c84aks-581c2abc8b23a34075853582a177deca .av-image-caption-overlay-center{ color:#ffffff; }

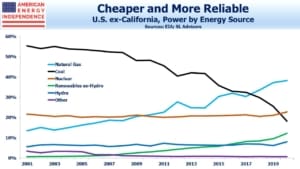
A big idea to combat climate change is for the world to phase out coal, replacing it with natural gas. This is already happening to some degree in the U.S. for power generation. Natural gas provides 37% of U.S. power, up from 34% last year. Coal’s share is 25%, down from 28% last year and heading to 22% in 2020.The recent bankruptcy of Murray Energy is a consequence.

.avia-image-container.av-moqq8c-73274eba0889f867beab02c5c080d6c8 img.avia_image{ box-shadow:none; } .avia-image-container.av-moqq8c-73274eba0889f867beab02c5c080d6c8 .av-image-caption-overlay-center{ color:#ffffff; }

Coal has its proponents, including all the industrial users of coal who have invested in processes that rely on it, as well as the coal producers themselves. But the math is that if the 150 billion BTU-equivalent of primary energy generated from coal was instead produced with natural gas, it would roughly halve the CO2 emissions per unit of energy. This would in turn reduce global emissions by 6.6 Gigatons, around 17% and more than the total emitted by the U.S. Climate extremists focused on solutions would push for even greater exports of cheap U.S. natural gas, perhaps supported by the sale of U.S. gas-fired power plants. It’s not as radical as moving to centrally planned economies running on solar and wind, but has the significant advantage of being feasible with today’s technology. Abundant natural gas offers a huge opportunity.

Moreover, coal causes local pollution wherever it’s burned, including sulfur, mercury, lead and arsenic. It emits high concentrations of very fine particulate matter, which cause respiratory damage. Estimates of annual coal-related deaths in the U.S. range from 7.500 to as high as 52,000. For comparison, the U.S. experiences around 40,000 auto-related deaths annually. In China, which burns six times as much coal as the U.S. and has less restrictive pollution rules, estimates of smog-related deaths are as high as 670,000.

.avia-image-container.av-2ztwnxo-3a442af1d5ff83b9e587f371f35df7c2 img.avia_image{ box-shadow:none; } .avia-image-container.av-2ztwnxo-3a442af1d5ff83b9e587f371f35df7c2 .av-image-caption-overlay-center{ color:#ffffff; }

.avia-image-container.av-9jcz58-c666e005ad07d1e21ef16170000bee82 img.avia_image{ box-shadow:none; } .avia-image-container.av-9jcz58-c666e005ad07d1e21ef16170000bee82 .av-image-caption-overlay-center{ color:#ffffff; }

America’s enormous success in producing natural gas has crushed the stock prices of many E&P companies.

.avia-image-container.av-wty0p8-443f0161ec530d98508a8cb224aa35ed img.avia_image{ box-shadow:none; } .avia-image-container.av-wty0p8-443f0161ec530d98508a8cb224aa35ed .av-image-caption-overlay-center{ color:#ffffff; }

Chesapeake (CHK) was the poster child for the Shale Revolution and natural gas under the late Aubrey McClendon. In an SEC filing the company warned that low natural gas prices “raises substantial doubt about our ability to continue as a going concern.”

Range Resources (RRC), Comstock Resources (CRK), Southwest Energy (SWN) and Antero Resources (AR) are among those who have destroyed vast amounts of investor capital in producing abundant natural gas.

.avia-image-container.av-iivho-3f08ab0e025efb3f60696993d157f9b1 img.avia_image{ box-shadow:none; } .avia-image-container.av-iivho-3f08ab0e025efb3f60696993d157f9b1 .av-image-caption-overlay-center{ color:#ffffff; }

Almost a decade ago we were following RRC, SWN and CRK more closely, meeting with management and examining the growth story. Production success has been a poisoned chalice. Increasing output has weighed on prices, recalling the early days of dot.com businesses who sought to cover operating losses by increasing volumes.

.avia-image-container.av-1yj5rbg-cc34c902fbbbc9b6e6b140c0df347d3a img.avia_image{ box-shadow:none; } .avia-image-container.av-1yj5rbg-cc34c902fbbbc9b6e6b140c0df347d3a .av-image-caption-overlay-center{ color:#ffffff; }

Nonetheless, production continues to increase. In the Permian in west Texas, the two most active drillers are Exxon Mobil (XOM) and Chevron (CVX), validating the opportunity of shale as long as it’s exploited by companies with low production costs and strong balance sheets.

Natural gas is increasing its share of the world’s power generation, providing access to cheap energy and lowering emissions. It’s just not clear that the early, smaller E&P companies will survive to benefit.


Elections Usually Boost Earnings

It’s a year until the next presidential election. The S&P500 is making new highs, reflecting the persistence of fund flows into equities. Quarterly earnings have been coming in ahead of expectations, but still down 1% year-on-year. Down less than expected counts as up for traders.

It’s also worth noting that expectations are for a 10% increase in S&P500 earnings next year, according to bottom-up estimates compiled by Factset. A year ago, we noted that equity returns are often strongest in the year following midterms – i.e., preceding presidential election years (see What the Midterms Mean for Stocks). 2019 looks as if it will confirm that pattern. The S&P500 is up 25% YTD.

.avia-image-container.av-je0w70-637ea3f8256a73b52ac6b27ea7a2f799 img.avia_image{ box-shadow:none; } .avia-image-container.av-je0w70-637ea3f8256a73b52ac6b27ea7a2f799 .av-image-caption-overlay-center{ color:#ffffff; }

This is probably due in part to the fact that S&P500 earnings growth tends to be stronger than average in election years, and markets being forward-looking tend to anticipate that.

Next year’s anticipated 10% S&P500 earnings growth is above the 8% annual average since 1960, but below the 13% average for election years. The 2017 tax reform, which slashed corporate taxes, boosted 2018 corporate profits, making for tough comparisons this year. But overall S&P earnings are set to be up 50% during this four-year presidential cycle, fifth best out of 15 since 1960. Equity investors have done well.

.avia-image-container.av-q9n2os-9f7e138378e746077fefb3fefaab56af img.avia_image{ box-shadow:none; } .avia-image-container.av-q9n2os-9f7e138378e746077fefb3fefaab56af .av-image-caption-overlay-center{ color:#ffffff; }

We won’t offer an election forecast derived from stocks, nor a market return based on next year’s election; there are plenty of better qualified prognosticators. Suffice it to say that the synchronization of corporate profits with the election cycle has continued into 2020. There’s no clear pattern showing one party’s control of the white House is better for S&P500 earnings over another.

.avia-image-container.av-qtpdrw-1342173e2c59203ac6d041c20070136e img.avia_image{ box-shadow:none; } .avia-image-container.av-qtpdrw-1342173e2c59203ac6d041c20070136e .av-image-caption-overlay-center{ color:#ffffff; }

The Equity Risk Premium (S&P500 earnings yield minus the yield on ten year treasury notes) has favored stocks for several years. Low interest rates leave equities one of the few asset classes with a chance to deliver returns ahead of inflation. It remains substantially wider than the 60 year average, and 10% earnings growth next year would accentuate the appeal of stocks. The Federal Reserve has gradually accepted the reduced real rate that bond investors have long felt was appropriate (see Real Returns On Bonds Are Gone). Perhaps the biggest unanswered question for investors today is why long term rates around the world are so low, with U.S. the highest among G7 nations. Part of the explanation is inflexible investment mandates (see Pension Funds Keep Interest Rates Low). It’s the most important factor showing stocks are cheap. There are few good alternatives.


Tallgrass Responds to Critics, Missing the Point

Earnings season for pipeline companies has provided few surprises, offering little to offset fund outflows, which continue to weigh on performance. Therefore, the Tallgrass (TGE) call last Wednesday promised to be more interesting than most. Blackstone’s (BX) offer to take private the 56% of TGE it doesn’t already own has focused attention on a sideletter many investors find objectionable.

In January, BX bought 44% of TGE at $22.43. The General Partner (GP) of TGE, owned by CEO David Dehaemers and others, was separately valued at around $480MM, which meant that these insiders received $26.25 for their TGE units. A sideletter agreement allowed that if BX buys the rest of TGE within a year, regardless of price, the insiders will receive at least $26.25 for their remaining units (see Blackstone and Tallgrass Further Discredit the MLP Model).

To his credit, Dehaemers confronted the sideletter issue during the earnings call. He understands that resolution of BX’s offer is the biggest question hanging over the stock. Investors who long believed they were invested alongside management feel betrayed, because the sideletter places a floor under management’s sale price without providing similar protection to other investors.

Dehaemers seems to think critics are overlooking the fact that his GP stake justified additional value, and that the special terms for management are fair. The problem is not the additional value extracted for selling the GP, even though its valuation seems arbitrary. Breaking the alignment of interests is what’s so offensive.

.avia-image-container.av-qc53f2-2d0a6501242d959dbdf70a84a1cea76a img.avia_image{ box-shadow:none; } .avia-image-container.av-qc53f2-2d0a6501242d959dbdf70a84a1cea76a .av-image-caption-overlay-center{ color:#ffffff; }

The sideletter’s result is that Dehaemers and his management team are indifferent to the price BX offers for the rest of the units below $22.43, since in any consummated transaction they are assured of receiving $22.43 (plus $3.82 per unit for their GP stake, or $26.25 in total). This is why BX’s $19.50 offer is so galling. Perversely, as TGE’s stock price weakened in August, it increased the likelihood of BX offering to buy the rest of the company. Therefore, as TGE fell it raised the probability of management receiving $22.43 for their units. Dehaemers was completely misaligned with his investors. Blaming TGE’s stock weakness on institutional sellers misses the point. Dehaemers had willingly given up his right to acquire any units in the open market, and had little incentive to provide business updates that might have arrested the decline.

Dehaemers insisted on a floor to sell his remaining shares, guaranteeing him the original price, as a pre-condition to staying invested and agreeing on a non-compete if he leaves the company. Because this changed his incentives relative to other investors, maintaining alignment with them required that he either obtain the same floor for all investors, or not seek one for himself. In doing so he violated their trust, which relied on this continued alignment of interests.

The consequences extend beyond just TGE. By demonstrating how easily the senior managers of a partnership can negotiate preferential terms for themselves, TGE has followed in the steps of Energy Transfer (ET), whose 2016 issue of convertible preferred securities to management on highly attractive terms led to a class action lawsuit (see Will Energy Transfer Act with Integrity?). Partnerships trade at a valuation discount, reflecting the weakness of investor protections (see Energy Transfer’s Weak Governance Costs Them). The MLP-dominated Alerian MLP Index (AMZX) has lagged the corporation-dominated American Energy Independence Index (AEITR) by ten percentage points this year (see MLPs No Longer Represent Pipelines).

Regardless of how the BX offer is resolved, MLP investors now have to consider the possibility of management crafting lucrative deals for themselves, a risk typically not present with conventional corporations because of tighter governance. It’s why the biggest ESG funds invest in pipeline corporations but not MLPs (see ESG Investors Like Pipelines).

SL Advisors is the sub-advisor to the Catalyst MLP & Infrastructure Fund. To learn more about the Fund, please click here.

SL Advisors is also the advisor to an ETF (USAIETF.com).


California’s Altruistic Carbon Policy

Wildfire season began abruptly in California last week. Bankrupt utility PG&E’s planned widespread power outages are a response to last year’s fires, which were blamed on high winds and faulty transmission lines. Having friends in affected areas, as many of us do, certainly brings home the tragedy and fear that comes when you might lose your home. Claims for fire-related deaths and property destruction last season overwhelmed PG&E’s financial resources. Apportioning blame is complicated – what seems certain is that Californians will endure higher electricity prices – both to make up for underinvestment in transmission infrastructure as well as to achieve the state’s 2050 goal of lowering Greenhouse Gas (GHG) emissions to just 20% of their 1990 level.

Californian electricity prices average 16.6 cents per Kilowatt/Hour (KwH), substantially above the U.S. average of 10.5 cents, but still lower than New England (see An Expensive, Greenish Energy Strategy). The EU average is 23.4 cents, so there’s probably plenty of room for prices to rise. Energy in America is cheap. Stores on busy streets keep their doors open in summer, blasting cool air on to passers-by in hopes of luring them in. Energy prices are not a political issue. They may never be this cheap again.

.avia-image-container.av-21t3q7j-362044ef62d5d05b6d35e02b15a015c2 img.avia_image{ box-shadow:none; } .avia-image-container.av-21t3q7j-362044ef62d5d05b6d35e02b15a015c2 .av-image-caption-overlay-center{ color:#ffffff; }

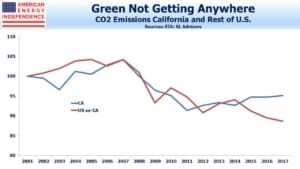
Like the U.S., California’s GHG emissions peaked over ten years ago. But while President Trump withdrew America from the Paris Accord, California has adopted laws intended to reduce GHG emissions even below targets the Obama administration considered as part of its “Mid-Century Strategy

Lowering emissions enjoys widespread support in California. They even have a cap-and-trade program, the subject of a recent lawsuit from the White House because it includes Quebec, possibly violating the Federal government’s exclusive responsibility for foreign policy

What’s interesting is to consider the political support for California’s laws mandating GHG reductions. Although it’s often noted that California’s GDP is bigger than all but seven countries, even that state’s planned 80% reduction in GHGs won’t save the planet. The heavy lifting is about to begin. The Transportation sector is 41% of California’s GHG emissions. Electric vehicle adoption will need to grow substantially. Demands on the state’s beleaguered electricity transmission infrastructure will correspondingly increase, although GHG emissions from the power sector are also expected to fall.

.avia-image-container.av-n7z10v-8c32db03d6922f89ce7141077e6c4606 img.avia_image{ box-shadow:none; } .avia-image-container.av-n7z10v-8c32db03d6922f89ce7141077e6c4606 .av-image-caption-overlay-center{ color:#ffffff; }

In 2017 Californians generated 424 Million tons of GHGs, pretty much the 1990 level. By 2030, state law mandates that annual emissions must be 40% lower, reduced by 170 Million tons of CO2 equivalent. The world generates 35 Gigatons, so the Golden State’s contribution will be to keep the world’s total 0.5% or so less than it otherwise would be.

California’s emissions policies are laudable. But global success unfortunately won’t come solely from this effort. Their hope is that they’ll set an example that other states and countries will adopt.

So it’s worth looking at China, where GHG emissions are expected to increase by over 2 Gigatons during the same period. The heroic efforts of Californians to slash their emissions over a decade will be offset by just nine months of growth in China.

.avia-image-container.av-14yga5r-b48b03fc121a916cce9895b1c6cfa14f img.avia_image{ box-shadow:none; } .avia-image-container.av-14yga5r-b48b03fc121a916cce9895b1c6cfa14f .av-image-caption-overlay-center{ color:#ffffff; }

This is the Climate Change Conundrum. The rich world says it wants lower emissions. California is a leader in this respect, although no country is on track to meet its Paris Agreement pledges. Meanwhile, developing countries like China and India plan sharply more energy consumption, so as to raise living standards. By accepting higher power prices, Californians are accommodating rising living standards in China by lowering their own. Moreover, poorer countries are far more exposed to rising sea levels and other consequences of climate change than richer states, which possess the resources to protect themselves. California is sitting on the high, dry moral ground.

The Paris Agreement isn’t working. Global emissions are rising. It’s the tragedy of the commons on a global scale. Californians will eventually realize that their substantial efforts are being hijacked as GHG emission capacity by others, rather than inspiring similarly noble, selfless acts. China, the world’s biggest emitter, is ranked “highly insufficient” by Climate Action Tracker for its efforts, as emissions continue to grow rapidly. The U.S., which emits half that of China, is ranked even lower, at “critically insufficient”, because of its withdrawal from the Paris Agreement despite lowering emissions more than any other country. Shifting energy intensive industries from America’s relatively clean energy mix to China’s is going in the wrong direction.

The current approach needs to be rethought. Perhaps what’s required is a set of agreed objectives that are attainable, even if those objectives fall short of what the UN’s IPCC report recommends. Extremists such as the precocious Greta Thunberg with her global scolding at the UN (“How dare you?”) and Extinction Rebellion are irritating or simply wacky. Movie stars who speak on climate change before hopping back onboard their private jet easily betray their hypocritical, virtue signaling goals. They make a few headlines, but the extreme solutions they advocate aren’t supported and aren’t being implemented. They are counter-productive.

.avia-image-container.av-tvfkj3-6f669827045e65ed42effaf0ddfe83af img.avia_image{ box-shadow:none; } .avia-image-container.av-tvfkj3-6f669827045e65ed42effaf0ddfe83af .av-image-caption-overlay-center{ color:#ffffff; }

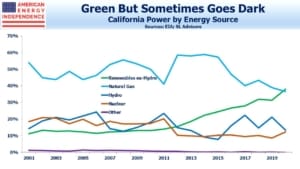
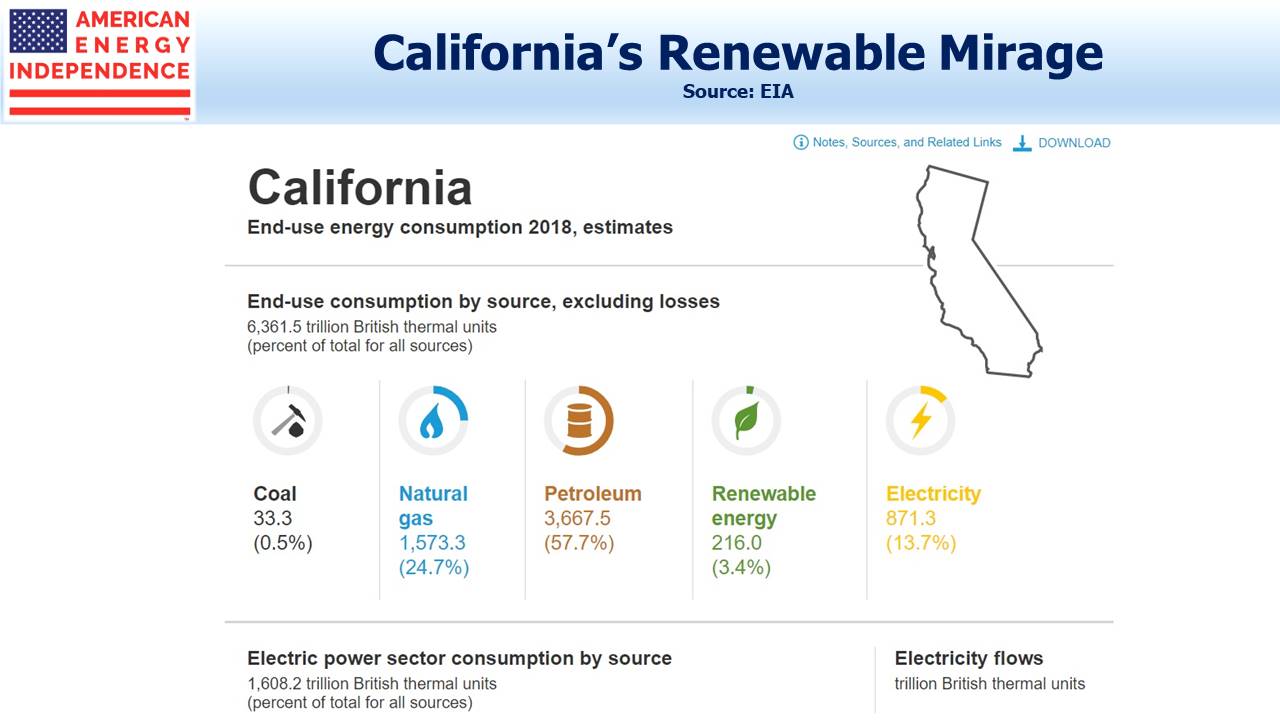
There’s probably not much popular support in America for green policies to support higher living standards in Asia. What remains clear is that solutions should include substitution of one relatively clean fossil fuel (natural gas) for the dirtiest one (coal), since fossil fuels are what work. California relies on natural gas for 46% of its in-state power generation. Natural gas pipeline companies will be needed more than ever.


Drilling Down on Shale Depletion Rates

The Shale Revolution has substantially increased America’s output of oil, natural gas and natural gas liquids. We often use the chart below to highlight this exponential growth.

.avia-image-container.av-jb3v99-6293e44219e48a01597de723e6844b62 img.avia_image{ box-shadow:none; } .avia-image-container.av-jb3v99-6293e44219e48a01597de723e6844b62 .av-image-caption-overlay-center{ color:#ffffff; }

Those exponential curves are going to flatten, not only because nothing can rise that fast indefinitely, but also because of the high initial depletion rates of fracked wells.

.avia-image-container.av-1msokd9-05585c146dd9db55cf64ed294a4bb28d img.avia_image{ box-shadow:none; } .avia-image-container.av-1msokd9-05585c146dd9db55cf64ed294a4bb28d .av-image-caption-overlay-center{ color:#ffffff; }

The chart above from Goldman Sachs provides a useful picture of shale oil production, which shows a gently flattening growth curve. It can be helpful to examine more closely how the lifecycles of cumulative wells combine to render growth ever harder to achieve.

The chart below is a theoretical model, showing a shale oil play in which production drops at 50% annually from previously drilled wells, while at the same time new wells are fracked each year with initial production of 1.6 million barrels per day (MMB/D).

.avia-image-container.av-12xa3vh-94da7578ca4bcba2b881d517decbe7e3 img.avia_image{ box-shadow:none; } .avia-image-container.av-12xa3vh-94da7578ca4bcba2b881d517decbe7e3 .av-image-caption-overlay-center{ color:#ffffff; }

It’s a busy chart but worth a moment to examine carefully.

Year 1 production of 1.6 MMB/D experiences 50% depletion in Year 2, of 0.8 MMB/D. But new production of another 1.6 MMB/D raises Year 2 total productioln to 2.4 MMB/D, a 50% jump.

Follow the successive depletion arrows from Year 1 production through Years 3-5, and you’ll see that they’re joined by depletion from later years of production. By Year 5, depletion from the four prior years totals 1.5 MMB/D, almost negating that year’s new production.

This illustrates a fundamental advantage of “tight” oil over conventional production. Output can rise very quickly and capital is invested over time in successive wells. This creates the short-cycle feature since capital is recycled very quickly (see Shale Cycles Faster, Boosting Returns). Moreover, if prices drop in, say, Year 3 the E&P company in this example can simply stop drilling. Production quickly plummets, since New Production is at least half of Total Production.

The model is intended to provide a couple of insights. One is that after an initial ramp up, production has to flatten. The other is that production can quickly fall, and following an initial sharp recovery starts to plateau again. This is visible on the Goldman chart during the 2014-16 oil collapse.

Our model is simplistic to illustrate a point. Productivity continues to improve, technology enhancements are regularly found, and the most productive areas are often drilled first. These and other factors will all obscure the depletion effect illustrated.

.avia-image-container.av-vosypp-29c0f62d4c4607e37da96075692bf9da img.avia_image{ box-shadow:none; } .avia-image-container.av-vosypp-29c0f62d4c4607e37da96075692bf9da .av-image-caption-overlay-center{ color:#ffffff; }

The chart above is an estimate of what we expect U.S. shale oil production growth to be from now until 2025.

.avia-image-container.av-vhu6xp-1516417ce60c7880056c605248e1d1f4 img.avia_image{ box-shadow:none; } .avia-image-container.av-vhu6xp-1516417ce60c7880056c605248e1d1f4 .av-image-caption-overlay-center{ color:#ffffff; }

A final interesting note is that this depletion effect is much more pronounced with oil wells versus natural gas. Crude wells experience faster initial depletion. This tends to shift the Oil-Gas ratio in favor of the latter, and also means that the inexorable drag on total output caused by depletion is less pronounced for natural gas wells compared with crude oil. The pair of charts above illustrate this. It’s partly why natural gas output is likely to continue growing, keeping prices depressed. By contrast, growth in U.S. crude output is likely to moderate. This is net bearish for natural gas prices and bullish for oil.

If you missed our webinar last week, titled “Volumes, Cashflow and ESG”, here’s a link to a replay.

SL Advisors is the sub-advisor to the Catalyst MLP & Infrastructure Fund. To learn more about the Fund, please click here.

SL Advisors is also the advisor to an ETF (USAIETF.com).


Unicorns Not Working

The rapid transition of WeWork from IPO in early September to almost bankrupt says something about the superficial due diligence of bankers prior to a roadshow. Reports suggest that co-founder Adam Neumann’s $1.7BN million payoff in exchange for much of his stock and his board seat will save him from having to file for personal bankruptcy. Like the late Aubrey McClendon when he ran Chesapeake, Neumann bet everything by borrowing heavily against his equity holdings. Meanwhile, Softbank has invested over $10BN into a company whose equity is now worth at $8BN. In January, WeWork was valued at $47BN. Another report suggested that layoffs were delayed because the company didn’t have the cash for severance payments.

Few will shed a tear for Neumann or Softbank. If you aim high and miss, down’s a long way. Founders and investors in a company can be expected to talk up its valuation.

.avia-image-container.av-w5j8sh-869da408cd015d838468b4edd7a75fe2 img.avia_image{ box-shadow:none; } .avia-image-container.av-w5j8sh-869da408cd015d838468b4edd7a75fe2 .av-image-caption-overlay-center{ color:#ffffff; }

But what about the bankers, who only a few weeks ago were out there pitching a hot growth stock that in reality was desperately in need of cash simply to stay afloat? We’re not natural IPO buyers, but doesn’t this company just sign long term property leases and then sub-lease for shorter terms?

Stocks can dip after an IPO, but it’s rare for bankers to so misread investor sentiment that the deal is cancelled. Early this year there were over 300 high growth, private companies valued at over $1BN (“unicorns”). Some mutual funds sought to boost returns on their public equity portfolios with a sprinkling of unicorns. That strategy has recently backfired, as Uber, Lyft and Peloton all slumped following their recent IPOs.

.avia-image-container.av-1qxen9d-e9f5dcd851cf2e04ec1be1b4c31a1d93 img.avia_image{ box-shadow:none; } .avia-image-container.av-1qxen9d-e9f5dcd851cf2e04ec1be1b4c31a1d93 .av-image-caption-overlay-center{ color:#ffffff; }

Investors seem to be recovering a protective layer of cynicism.

A close family member is an astute investor with an age-appropriate, conservative portfolio. She allocates a small portion for interesting, risky ideas, and bought into Tilray (TLRY) in its Canadian IPO in July 2018. CFA charterholders shouldn’t bother looking at marijuana stocks. Farmers all over the world rely on enormous government subsidies, without which their businesses apparently couldn’t survive. This simple observation, along with TLRY’s stratospheric multiples, supported my advice to my wife not to follow our relative’s lead. TLRY quickly soared to almost six times its IPO.

.avia-image-container.av-1bel6v5-113c11db7065d8f35cdf1bc8361cfe6f img.avia_image{ box-shadow:none; } .avia-image-container.av-1bel6v5-113c11db7065d8f35cdf1bc8361cfe6f .av-image-caption-overlay-center{ color:#ffffff; }

Our family’s most ruthless trader sold enough near the high to cover her cost within three months, as one of the most beautiful short squeezes in recent years swept away those who had shorted TLRY based on fundamentals. It’s been an occasional topic in our house at breakfast, along the lines of “Do you know what I could have bought if you hadn’t told me to avoid that pot stock?” Responding that my wife doesn’t pay enough in fees to warrant an account review while I’m eating my cereal draws a predictable retort.

.avia-image-container.av-jdsbgh-a607bd3bcb3fbe5d50fa704bc608d022 img.avia_image{ box-shadow:none; } .avia-image-container.av-jdsbgh-a607bd3bcb3fbe5d50fa704bc608d022 .av-image-caption-overlay-center{ color:#ffffff; }

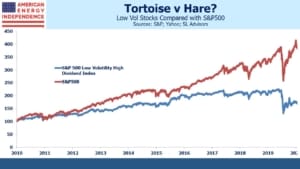
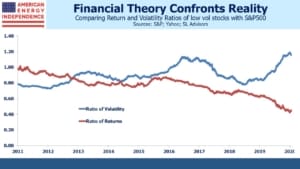
The time for frothy stocks has passed. In a year of strong equity returns, low volatility stocks are ahead, even though they’d be expected to lag at such times. The American Energy Independence Index, jammed full of cheap stocks and with nothing remotely unicorn-like, is keeping up the pace. Investors are turning towards tangible values with proven business models.


Pipeline Stocks Are Quietly Recovering

“Horrific. Terrible. Abysmal. The worst. Those are terms equity analysts are using to describe investors’ attitude toward energy stocks.”

This is from a recent Wall Street Journal article (see Energy Stocks Fall Faster Than Oil Prices).

Sentiment in the energy patch is poor. Too much spending with too little returned to shareholders is the main gripe, along with what seems like a tendency for the sector to follow crude prices lower but then fail to participate in any recovery.

The WSJ article goes on to note that over the past year, crude has dropped 26% while the S&P Exploration and Production index (denoted in the chart by its ETF, XOP) has lost almost half its value.

It’s especially odd when E&P operating performance has been improving. In I Can’t Make You Love Me – E&Ps’ Performance Belies Negative Investor Sentiment, RBN Energy walks through metrics including profitability, reserve replacement and shareholder returns (buybacks and dividends) to illustrate that domestic energy companies are heeding the criticisms of investors. So far, it’s not helping their stock prices.

The gloom is overshadowing the improving outlook for midstream energy infrastructure stocks. Earnings season will provide another opportunity to confirm that the sector remains on track to grow free cash flow (see The Coming Pipeline Cash Gusher). But it’s already becoming clear that the performance of pipeline stocks is deviating markedly from the upstream E&P companies that are their customers.

.avia-image-container.av-1751hxk-61145dd88b3b7cf3765a7e8e5a19eaf9 img.avia_image{ box-shadow:none; } .avia-image-container.av-1751hxk-61145dd88b3b7cf3765a7e8e5a19eaf9 .av-image-caption-overlay-center{ color:#ffffff; }

While XOP is down 49% over the past year, the American Energy Independence Index (AEITR) is close to flat, and was briefly positive following the attack on Saudi Arabia’s oil infrastructure. Although still lagging the S&P500, the sector has recovered from the 20% swoon during last year’s fourth quarter. E&P stocks remain a long way from recovery.

The AEITR is also 7% ahead of the Alerian MLP Index (AMZX) since last October, helped by inflows from ESG funds with their focus on standards of environmental, social and governance practices. The partnership-heavy AMZX holds little appeal to ESG investors, compared with the corporation-heavy AEITR where corporate governance provides stronger investor protections.

Weak commodity prices are another problem for E&P names. Natural gas gets less attention than crude oil, but prices for the benchmark Henry Hub recently sank to $2.25 per MCF (Thousand Cubic Feet). Production continues to grow strongly in the northeast, thanks to the Marcellus and Utica shale formations in Pennsylvania. But a shortage of pipeline capacity has recently led to a discount of as much as $1 per MCF, meaning Marcellus natural gas was worth as little as $1.25 per MCF locally.

Some E&P stocks are almost worthless. Range Resources (RRC) is a company we followed almost a decade ago. In the years preceding the 2014 peak in the energy sector, RRC traded above $50 and was briefly above $90. We liked the management team very much, but noticed that they continued to sell their own shares even while quietly confiding that they thought they could be acquired for $120. We sold out.

.avia-image-container.av-ktxw14-61bee61244af249dc5576b880c6c9613 img.avia_image{ box-shadow:none; } .avia-image-container.av-ktxw14-61bee61244af249dc5576b880c6c9613 .av-image-caption-overlay-center{ color:#ffffff; }

Today, RRC is at $3. In a recent presentation they claimed resource potential of 40 TCF (Trillion Cubic Feet) of natural gas, enough to meet all U.S. domestic consumption for around 16 months. In our write-up from a 2010 RRC presentation, we noted their claim to 30 TCF of resource potential at that time. Holders from nine years ago (if any remain) have lost 90% or more of their investment, and RRC has access to ever more copious volumes of natural gas.

The Shale Revolution has produced enormous output, but profits for upstream investors have been elusive. The sorry history of RRC reflects the frustration investors feel with energy stocks, with abundant resources coinciding with capital destruction.

That’s why it’s a welcome sight to see midstream stocks performing so much better than their customers – the link to commodity prices has been weakening over the past couple of years, and the toll-model of pipelines is once again providing some differentiation.


Pipeline Earnings in a Market Focused Elsewhere

Earnings season for midstream energy infrastructure kicks off with Kinder Morgan (KMI) on Wednesday. In April we identified growing free cash flow (see The Coming Pipeline Cash Gusher) as the most important catalyst for higher security prices. We’ll be reviewing quarterly earnings for evidence that the sector remains on track to generate increasing amounts of excess cash that can be used to reduce debt, increase payouts and buy back stock. There should also be some useful guidance on activity from the sector’s upstream customers. Investors and analysts seems weary of persistent low valuations, so any positive surprises should draw buyers.

The American Energy Independence Index (AEITR) is +16.9% YTD, having pulled back around 3.5% so far in October. It’s 11% ahead of the Alerian MLP Index, because its 80% weighting towards corporations (more ESG-friendly) better reflects investor preferences, which is to favor pipeline corporations over MLPs (see MLPs No Longer Represent Pipelines and ESG Investors Like Pipelines)

.avia-image-container.av-2dqpjy-451949c65f2dc11dc5b82467697ea73f img.avia_image{ box-shadow:none; } .avia-image-container.av-2dqpjy-451949c65f2dc11dc5b82467697ea73f .av-image-caption-overlay-center{ color:#ffffff; }

Although earnings and company guidance ought to dominate sector performance in the weeks ahead, there are a growing number of macro and geopolitical issues that are impacting investor sentiment.

  • Making a deal with China in time to eliminate this as a potential election-year negative seems obvious (see Trade Wars: End in Sight). However, the latest signs of agreement have left the market nonplussed given the fitful journey followed so far.
  • Middle East. Like many observers, we were surprised at how quickly crude oil prices retraced gains following the attack on Saudi infrastructure. Clearly, oil traders regard any disruption of supplies as unlikely, even after the more recent missile attack on an Iranian tanker in the Red Sea near Jeddah. Nonetheless, American midstream energy infrastructure doesn’t face similar risks from terrorists or foreign powers.
  • Another EU deadline approaches in this most riveting drama (see Another Gripping Episode of Brexit). This is of little global consequence unless the UK somehow leaves the EU without an agreement (a “hard Brexit”). This is unlikely, but not impossible if one bluff too many is called.

Earnings may be overshadowed by developments. Global slowdown fears continue to spread. 2019 S&P500 earnings estimates have been softening all year, from $178 per share last October to $164 now, according to Factset. Bond yields remain highly unattractive. The Equity Risk Premium still shows stocks as a far preferable investment (see Stocks Offer Bond Investors an Opening).

Bill Gross recently recommended investors load up on high quality dividend-yielding stocks rather than negative-yielding government debt. We think bond markets are distorted in part by rigid investment guidelines followed by pension funds that require them to maintain large fixed income allocations regardless of return prospects (see Pension Funds Keep Interest Rates Low).

Equities remain attractive, and pipeline stocks exceptionally so.

We are invested in KMI.