Futures Still Disbelieving The Fed

Memories of the 2013 “Taper Tantrum” loom over today’s FOMC as they engineer an exit that will hopefully be more elegant than our current one from Afghanistan. Both were well overdue, although there is no doubt the military withdrawal was handled disastrously. Can the Fed do better?

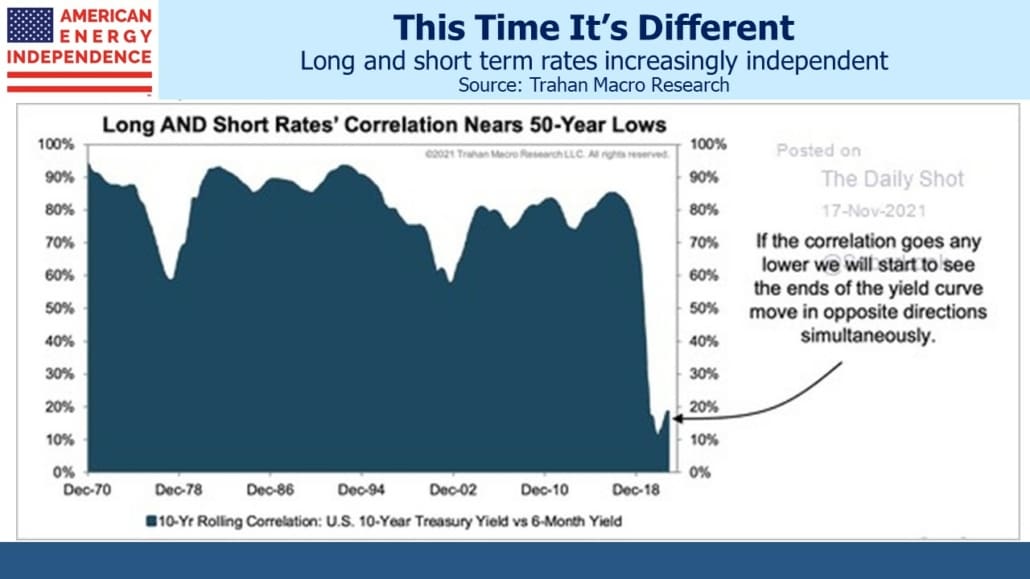
Unlike the Afghan army, the bond market has reacted well to the approaching loss of US government support. Treasury yields even dropped modestly on the week, with the ten-year still around 1.25%, 0.50% below its high in late March.

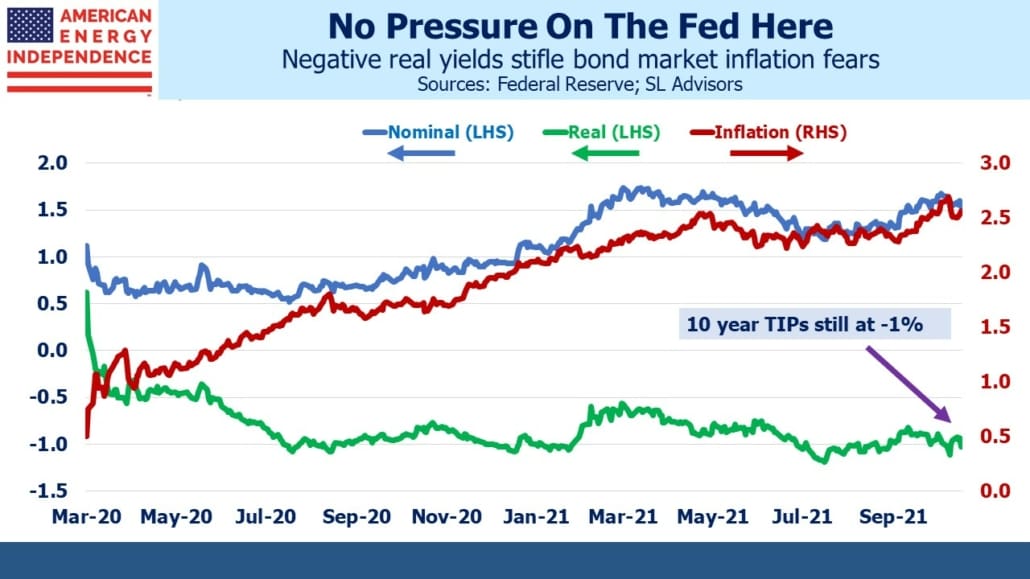
Real yields have stayed below –1.0%, with implied ten-year inflation (nominal yields less TIPs) of 2.3%. Since the Fed’s bond buying will be over within 6-9 months, today’s yields must reflect close to an equilibrium level for a bond market operating without the crutch of partial debt monetization.

Persistently low long-term interest rates remains one of the most important drivers of valuations. Japan holds $1.3TN in US treasury securities, and China over $1TN. These and other holders are clearly not seeking generous returns. Moreover, the specter of foreign investors dumping bonds and causing a recession has gone. Our second stint of Quantitative Easing (QE) shows that the Fed is a fully capable buyer of last resort. China’s position would sit comfortable alongside the other $8TN on the Fed’s balance sheet. Whatever risk premium bond yields once offered against such a possibility has evaporated.

The bond market’s positive response to tapering is more accurately a reflection of concern over the Delta virus. Cyclical stocks have been under pressure since mid-June, and on Thursday the S&P Energy ETF (XLE) dipped below the 200-day moving average. There are signs that Covid is flattering the bond market’s apparent equanimity over tapering. Nonetheless, the Fed stepping back when there’s clearly ample demand for bonds represents a more elegant exit than waiting until yields had risen to, say, 2%.

.avia-image-container.av-j5r21n-1583ca274f97e2360dbf38f0a6bc47c0 img.avia_image{ box-shadow:none; } .avia-image-container.av-j5r21n-1583ca274f97e2360dbf38f0a6bc47c0 .av-image-caption-overlay-center{ color:#ffffff; }

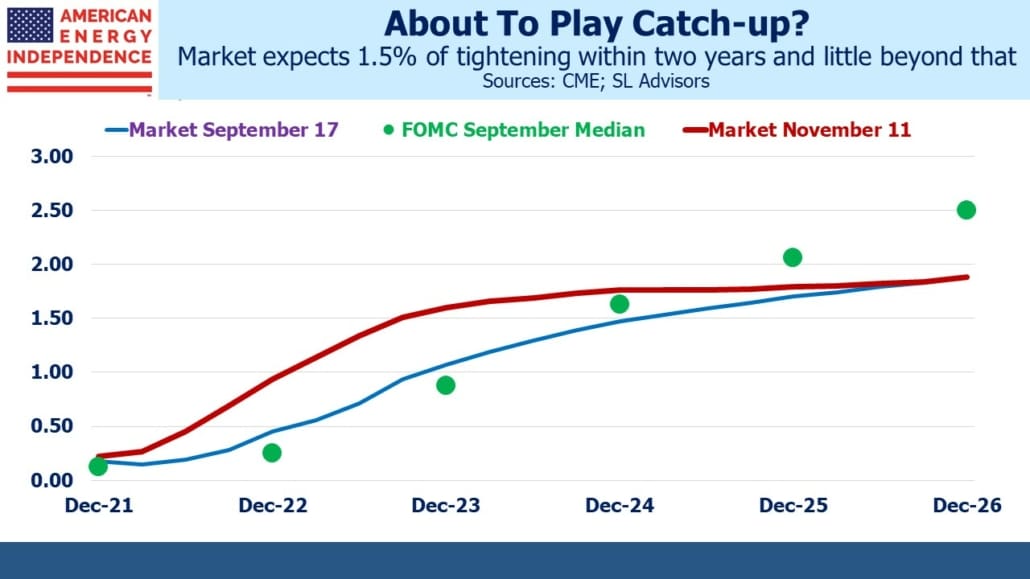
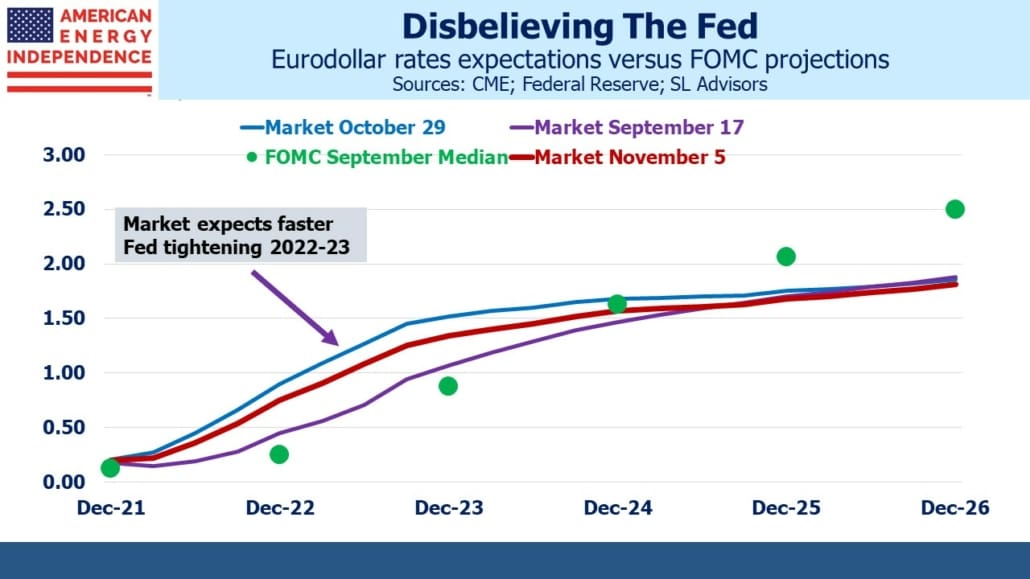
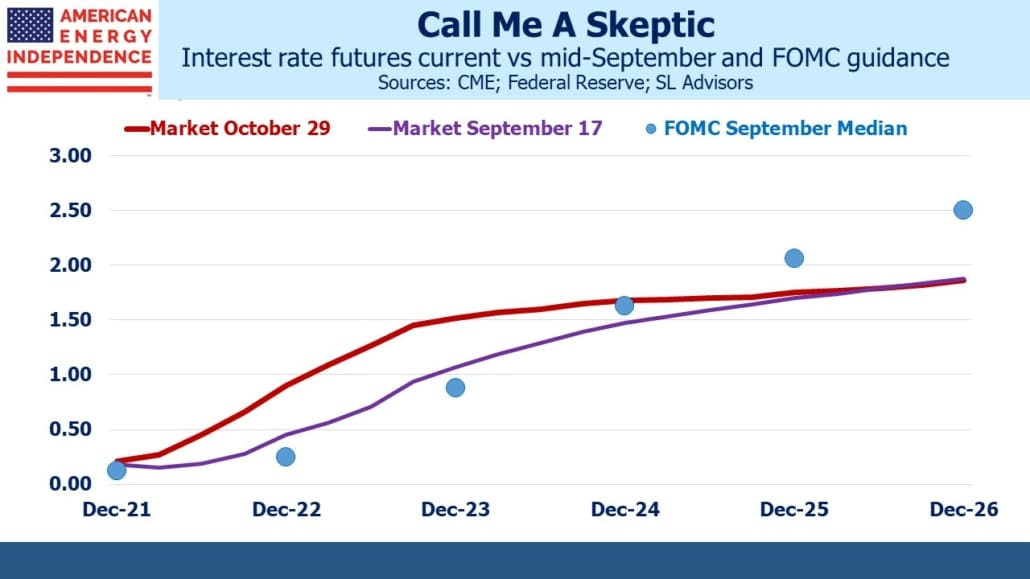
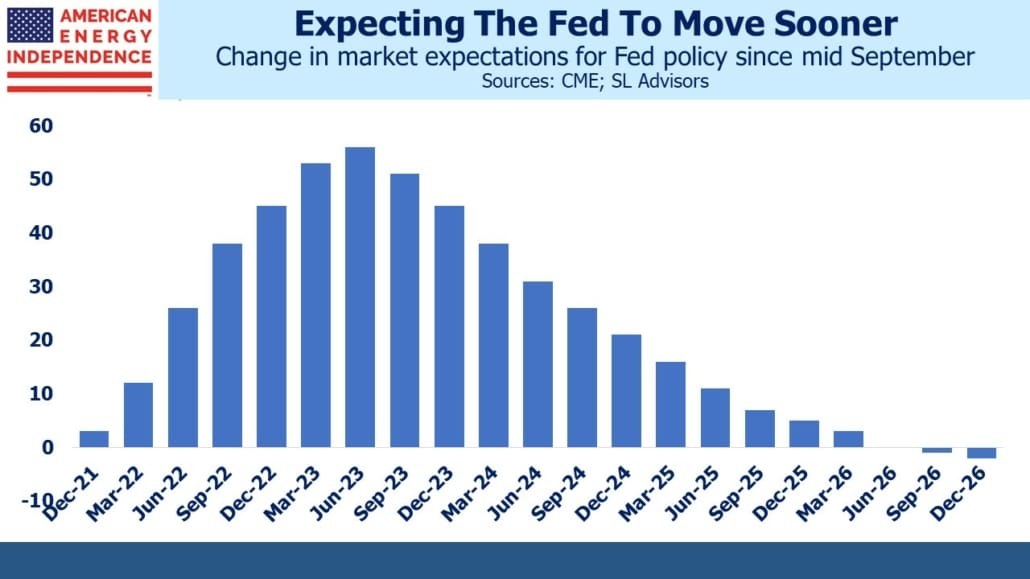
The eurodollar yield curve has flattened over the past couple of months as bond yields have drifted lower. Market interest rate forecasts are now solidly below those of the FOMC. Five years out, even the most dovish of the “blue dots” that indicate individual FOMC members’ rate forecasts is almost 0.40% above the market. Although bond investors have pushed yields lower in response to rising hospitalizations from the Delta virus, it’s unlikely FOMC members’ rate forecasts have altered much two to five years out. And the market is still forecasting around one tightening per year from 2023, about half the pace of FOMC members.

Given their explicitly reactive posture, it’s quite likely that the FOMC will be slow to normalize rates. Chair Powell never misses an opportunity to remind us that achieving full employment, which means an unemployment rate at least as low as the January 2020 pre-Covid level of 3.8%, is their objective. It’s likely that the FOMC will rely on emerging wage inflation as confirmation we’ve reached full employment. So they’ll be playing catch-up, which is why the current flatness of the eurodollar curve seems incorrect. Put another way, with the market priced for two tightenings during 2024-25, we think three is more likely than one, and four a decent possibility.

Interest rate futures reflect a slow pace of easing at odds with FOMC forecasts and past history. Given that a philosophy of unlimited spending now drives fiscal policy (see Modern Monetary Theory Goes Mainstream), if the lethargic pace of tightenings turns out to be accurate, there wil be ever greater calls for additional fiscal stimulus to boost economic growth.

It began with the Greenspan put, and successive Fed chairs have been awarded the same moniker. Add to that the Biden put. At the first sign of economic weakness the call will go out for more spending, which remains virtually costless. With debt funded at negative real rates, it almost seems irresponsible to not take advantage of the opportunity.

In 2008 Ben Bernanke revealed the limitless balance sheet capacity of the Federal Reserve, which has moved from $2TN to $8TN since then with no discernible disadvantage to the US economy. Covid-induced fiscal stimulus ushered in Modern Monetary Theory (MMT) as mainstream policy, exploiting a country’s unlimited ability to borrow in its own currency.

Now that Congress has discovered the Magic Money Tree (i.e. MMT), the conditions that justify super-stimulus will become steadily relaxed, just as the use of QE will transition from an extraordinary measure to business as usual.

It’s against that context that the forecasts embedded in the interest rate futures market must be judged.

We are invested in all the components of the American Energy Independence Index via the ETF that seeks to track its performance.


US Explores The Limits On Spending

Paul Kennedy’s The Rise and Fall of the Great Powers coined the term “imperial overstretch”. Throughout history, the decline of every great power has coincided with military commitments beyond its means. Such cycles last many decades, and Kennedy’s 1987 book speculated that Japan was the new rising power about to overtake America. That call was spectacularly wrong, but the underlying principles remain valid. After twenty years, almost a $1TN and over 2,300 US military lives lost in Afghanistan, we have little to show for it. America’s humiliating exit from Kabul is not how superpowers conclude military expeditions.

Simple math shows that US military dominance will slowly give way to a multi-power world. War is expensive, and economic size drives success. US share of global GDP has declined from 40% in 1960 to 24% today, as emerging economies such as China have made strides.

.avia-image-container.av-z7mds9-c3efa16e3b0ded7fc575221a15a87c16 img.avia_image{ box-shadow:none; } .avia-image-container.av-z7mds9-c3efa16e3b0ded7fc575221a15a87c16 .av-image-caption-overlay-center{ color:#ffffff; }

Historically, great powers have begun to decline when they continued to assume obligations inconsistent with their capacity to meet them. Such decisions aren’t inevitable, and the arc of history is long. America remains a great country. But it’s useful to consider episodes such as our recent withdrawal from Afghanistan against our growing debt, set to test all notions of sustainability.

America’s debt:GDP is projected to double in the next three decades, according to the non-partisan Congressional Budget Office (CBO). This assumes no new pandemic and no wars, both significant sources of past unplanned spending.

It’s likely we will not acknowledge whatever constraints on our spending this projection should imply. Long term interest rates remain low, helped by the Fed’s monetization of around half of all newly issued Federal debt (see Behind The Fed’s Benign Inflation Outlook).

Modern Monetary Theory (MMT) is the great enabler (see Reviewing The Deficit Myth, Stephanie Kelton’s book on the subject). It teaches that the only constraint on a government’s ability to borrow and spend in its own currency is inflation. Since the Federal government can always issue bonds to the Federal Reserve with its unlimited ability to create the funds to buy them, we always have a buyer of last resort. If government spending goes beyond the economy’s ability to deliver the goods and services offered, thereby driving up prices, inflation results. This is the only practical constraint on the budget deficit.

.avia-image-container.av-lgoqll-cb832a8b49a2ef93501c9844be185163 img.avia_image{ box-shadow:none; } .avia-image-container.av-lgoqll-cb832a8b49a2ef93501c9844be185163 .av-image-caption-overlay-center{ color:#ffffff; }

Forget about our foreign creditors’ willingness to finance our borrowing. The threat of Japan, or in recent years China, dumping US bonds and causing a recession through sharply higher rates has been periodically raised. It hasn’t happened, and likely won’t. They couldn’t sell $1TN in bonds, and if they tried the Fed would undoubtedly step in to manage the process. Ben Bernanke opened the Pandora’s Box of a greatly expanded Fed balance sheet during the 2008 Great Financial Crisis. Having discovered its power, we will steadily increase the set of circumstances that justify such largesse. The bar will be lowered, because it’s apparently costless to do so.

This is why inflation is likely, because there is no other force limiting our ability to borrow. Today’s deficit hawks have lost influence because their message doesn’t resonate. That’s because it doesn’t fit the facts. Their predictions of fiscal disaster make climate change forecasts look astute. The world is 1°C warmer than pre-industrial times if not obviously much worse for it. By contrast, record low bond yields suggest record indebtedness is harmless.

This serves to further increase the government’s perceived ability to borrow, because both the Administration and the Fed assess the current uptick in inflation to be temporary. It may be so, which will show that borrowing hasn’t yet become ruinous. Therefore, more will follow.

Inflation isn’t correctly measured anyway. Statisticians insist on ignoring the rising cost of home ownership even though two thirds of American families choose to obtain shelter that way (see Why It’s No Longer Enough To Beat Inflation). $40BN a month in MBS purchases during a very hot housing market is finally making some FOMC members uncomfortable. Boston Fed president Eric Rosengren recently said, “If you can’t get housing materials and you can’t get construction workers to come back on site, but we do increase demand for housing, then it doesn’t do much for our employment mandate—but it does increase housing prices more than it otherwise would.”

MMT has quietly become mainstream fiscal orthodoxy. Even proponent and author Stephanie Kelton advocated for a CBO-type scoring of the inflationary impact of spending plans. Instead, we are looking at a $3.5TN budget to be passed via reconciliation with no formal consideration of the possible inflationary consequences. If it doesn’t cause the economy to overheat, such budgetary largesse will become business as usual. Inflation is eventually assured.

We are invested in all the components of the American Energy Independence Index via the ETF that seeks to track its performance.


Why It’s No Longer Enough To Beat Inflation

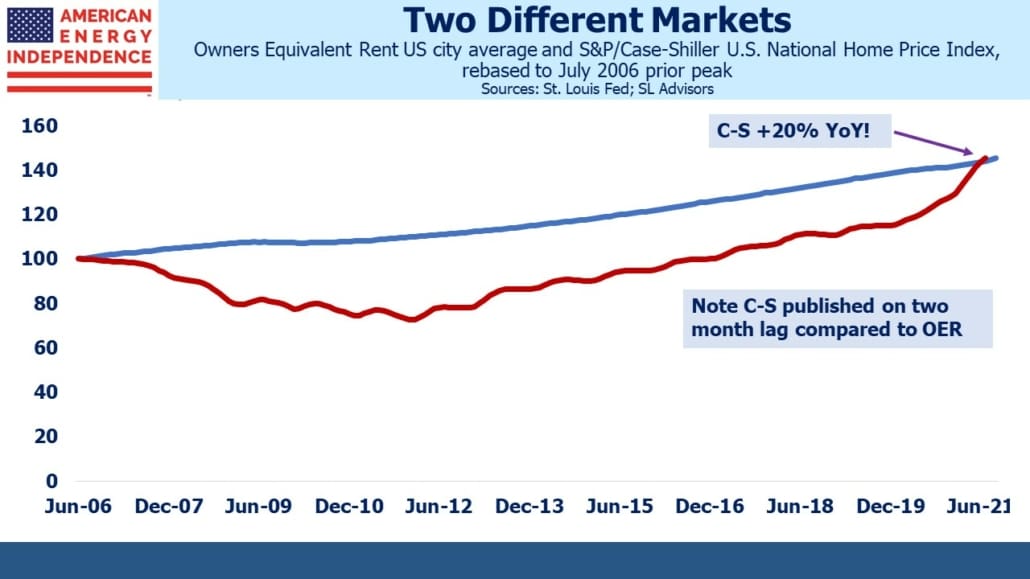
The most recent CPI report was a little better than expected – all-items less food and energy was up 4.3% year-on-year. Used car prices had boosted prior inflation figures but were up just 0.2% in July. Owners’ Equivalent Rent (OER), the statistician’s’ quixotic means of measuring what it costs to attain shelter through home ownership, rose just 0.29% in July. It’s up 2.1% over the past year, compared with the Case Shiller National Home Price index which is +16.6% through May (most recent available).

CPI is important because it’s used to make cost of living adjustments to social security and other government transfer payments. It’s part of the return on inflation—linked bonds and is often used in long-term commercial contracts to make price adjustments. But it’s becoming less relevant as target against which to grow your income. Investing is all about retaining purchasing power for the future. Most interpret this as being able to afford in ten years what you could buy today. It turns out that’s CPI is inadequate for this.

Because incomes grow faster than inflation, if your income fails to keep up with the median, you’ll be relatively poorer. Savers don’t just want to maintain today’s absolute purchasing power – they want to keep the same relative consumption as their peers. If you enjoy the median income today, growing it at CPI means falling below the median, and won’t feel like much fun. Average income has been dragged above the median by “the 1%”, or the increasing income inequality we often read about. So using the median provides a more representative figure for the typical family.

.avia-image-container.av-1fo99bt-b23c24d62892af10e22c956e2a610b01 img.avia_image{ box-shadow:none; } .avia-image-container.av-1fo99bt-b23c24d62892af10e22c956e2a610b01 .av-image-caption-overlay-center{ color:#ffffff; }

Whenever a writer quotes a price for something decades ago and converts it into “today’s dollars”, he’s using the CPI inflation rate. This understates the effective cost, because it fails to account for the fact that incomes have been rising after inflation. It doesn’t fully capture the chunk of income it cost the median household. For example, a new car in 1953 cost $1,850, which is $17,531 today after adjusting for CPI inflation.

You won’t get much new car for that today – Kelley’s Blue Book reports the average new car costs just over $40K. This is not much different than $37,511, the 1953 price adjusted by income growth. In other words, the average new car cost 44% of the median household’s income in 1953, and it’s 47% today. In relative terms, cars have kept track with incomes, not inflation. Milk and most groceries are much cheaper. Food commands less of a household budget than in the past. Color TVs are dramatically cheaper because they were only just being produced in the early 1950s.

.avia-image-container.av-ef2jd-8cffd83856386ce8a6801205fb292715 img.avia_image{ box-shadow:none; } .avia-image-container.av-ef2jd-8cffd83856386ce8a6801205fb292715 .av-image-caption-overlay-center{ color:#ffffff; }

Electronic goods such as TVs have long experienced deflation, because as their quality has improved the Bureau of Labor Statistics (BLS) converts this into a price drop. The CPI measures a basket of goods and services of constant utility, and a better TV at the same price is like a price cut. They try to adjust for the countless quality improvements that market economies deliver. The problem is that this kind of price cut doesn’t free up any cash to buy anything else. The BLS regards TVs as having fallen in price, even if the actual cost hasn’t.

Most products become better over time, and government statisticians expend much effort converting those improvements into imputed price cuts that don’t make you richer even if they add utility. It’s another example of the inflation statistics being theoretically correct and increasingly out of touch with people’s lives.

The average new home costs a little over 4X median household income, not much different than in 1953 although this is twice as much as if houses had simply risen with CPI inflation.

.avia-image-container.av-rf9d09-de1d4e307fabaa338368e00d16d58d9b img.avia_image{ box-shadow:none; } .avia-image-container.av-rf9d09-de1d4e307fabaa338368e00d16d58d9b .av-image-caption-overlay-center{ color:#ffffff; }

The Financial Times ran an article last week (see Why central bankers keep their cool over rising house prices) which found that separating out the value of shelter that home ownership provides is widely accepted by economists. The US isn’t alone in using a non-cash theoretical input for housing in its inflation statistics.

The article goes on to note that central bankers don’t worry about housing inflation because it rarely shows up in OER and its foreign equivalents. It’s a circular argument – OER is low because it’s not measuring the cash cost of home ownership, and therefore appears well behaved.

Median family incomes have always grown faster than inflation, but that gap has widened in recent years. Over the past decade, incomes grew twice as fast as inflation. This is mostly good news, because higher real incomes mean higher living standards. It’s bad news only for those whose incomes are tied to inflation since they’re slipping behind their peers at a faster rate than before.

The inflation statistics remain important for financial markets and those whose incomes are linked to it, but are steadily losing relevance for anyone who’s saving for the future.

We are invested in all the components of the American Energy Independence Index via the ETF that seeks to track its performance.


Is China Worried About Global Warming?

The UN’s Intergovernmental Panel on Climate Change (IPCC) released their latest report on Monday, in preparation for COP26, the November meeting of heads of government in Glasgow to discuss how we should respond.

The report says humans have warmed the planet by 1° C since pre-industrial times, the agreed-upon benchmark. A further 0.5°C is likely on current trends within the next two decades. The New York Times, rarely short of hyperbole, misleadingly wrote, “Even if nations started sharply cutting emissions today, total global warming is likely to rise around 1.5 degrees Celsius within the next two decades, a hotter future that is now essentially locked in.” This sounds like an additional 1.5° over the next 20 years, unless you’ve read the IPCC Summary for Policymakers.

Putting aside biased news coverage, the most important question is what does China think? The IPCC’s summary presents a sober case that the world needs to begin dramatically cutting CO2 emissions from fossil fuel use with a view to reaching carbon neutrality by 2050. Only then can we be assured that the remaining capacity of the atmosphere to absorb additional CO2 will not be exhausted, with irreversible consequences.

.avia-image-container.av-1lmlb39-1fee0a32ee059804a0cba72e161e742a img.avia_image{ box-shadow:none; } .avia-image-container.av-1lmlb39-1fee0a32ee059804a0cba72e161e742a .av-image-caption-overlay-center{ color:#ffffff; }

As with most things, actions count for more than words. Even though we’re supposed to cut emissions now, China plans to keep increasing them until 2030. At that point, an improbable pledge to be carbon neutral within three decades is supposed to usher in a sharp decline. While China could perhaps do this, there’s good reason to doubt they will.

How must Chinese policymakers regard their choices? Real per capita GDP has grown at 5% pa since 1980, three times the US rate. It wouldn’t have happened without higher energy use. Yet even now, China is at less than 24% of the US level. The looming energy transition is hugely expensive and negative for growth.

.avia-image-container.av-172d4xx-4b56f0a78a4d295f1dd932d94141fffe img.avia_image{ box-shadow:none; } .avia-image-container.av-172d4xx-4b56f0a78a4d295f1dd932d94141fffe .av-image-caption-overlay-center{ color:#ffffff; }

Improving living standards beats climate in China. They likely deem the increased incidence of heatwaves and extreme weather as inconsequential. Although much of the western media appears almost suicidal over the planet’s future, everyday life for the typical Chinese citizen (or US for that matter) isn’t visibly impacted by the 1°C warming we have engineered so far.

While the science of human-caused warming is generally beyond question, predicting the consequences is far harder. The UN has an unfortunate track record of offering dire predictions that miss, although the science is presumably now better than ever. Chinese citizens, if they think about it, may even conclude that the current climate isn’t necessarily the best we could have.

Like many people, I spend far more time and money coping with excessive cold rather than heat. I head to Florida as soon as the daytime high in New Jersey drops below a golf-impeding 50°F. Cold weather is miserable. If human-induced Global Cooling threatened, I’d find that far more distressing — it might get me to join the Sierra Club. But a slightly warmer planet, like a slightly warmer day, doesn’t sound so bad. The Chinese probably feel the same way.

Despite the absence of any meaningful weather impact, as a matter of risk management, it seems sensible to take the science seriously. As an investor, it’s important to assess the likely outcomes.

.avia-image-container.av-srb1id-72e13356d3d96c4e125c2a60f8bc16bb img.avia_image{ box-shadow:none; } .avia-image-container.av-srb1id-72e13356d3d96c4e125c2a60f8bc16bb .av-image-caption-overlay-center{ color:#ffffff; }

Emerging economies are where energy use, emissions and living standards are growing fastest. Regardless of its pronouncements, China shows every sign of valuing continued growth of living standards over reduced energy use to lower CO2 emissions. Non-OECD countries emit around two thirds of global CO2, and this is growing at eight times the pace of rich countries. China and India count for 35% of the total. Although both countries regularly highlight renewable energy, they’re using more of everything, including coal. Their energy needs continue to rise.

Moreover, emerging economies want money from rich countries to finance green energy investments. $100BN per year was pledged but not delivered last year. Some are asking for far more (listen to our recent podcast, Episode 79: The Bill For The Energy Transition to hear South Africa’s Environment Minister telling citizens substantial foreign aid is needed). This receives no attention in the US media but certainly does in supplicant countries. The Biden Adminstration recognizes that US political support for the energy transition doesn’t mean voters are willing to pay for it.

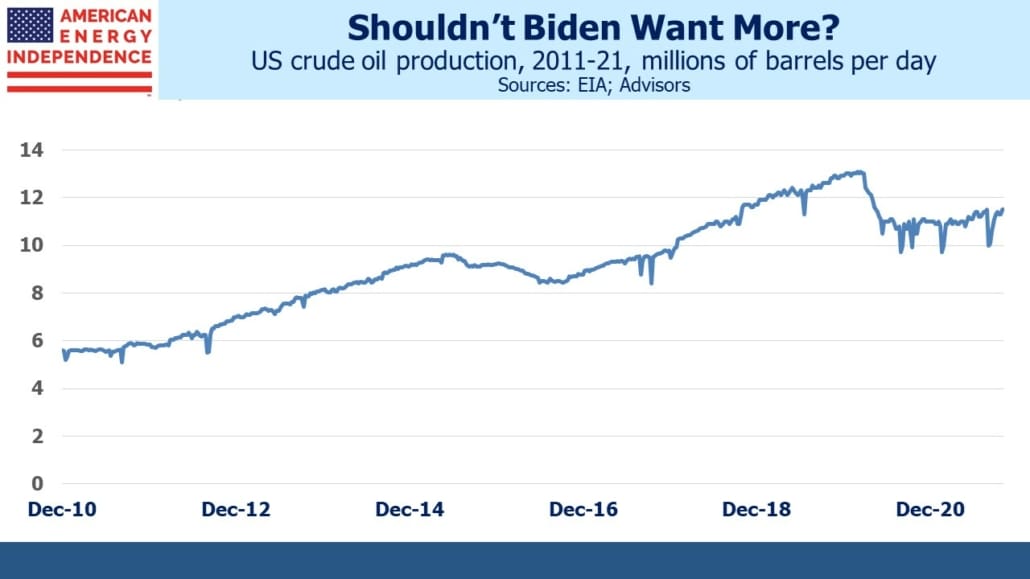
High crude oil prices are a necessary step in inducing drivers to switch to electrric vehicles, but the White House continues to urge increased production from OPEC. National Security Advisor Jake Sullivan called for, “Americans to have access to affordable and reliable energy, including at the pump.” It remains the case that there are votes in appearing to push for the energy transition but fewer in executing, which is why Democrats continue to be good for the sector.

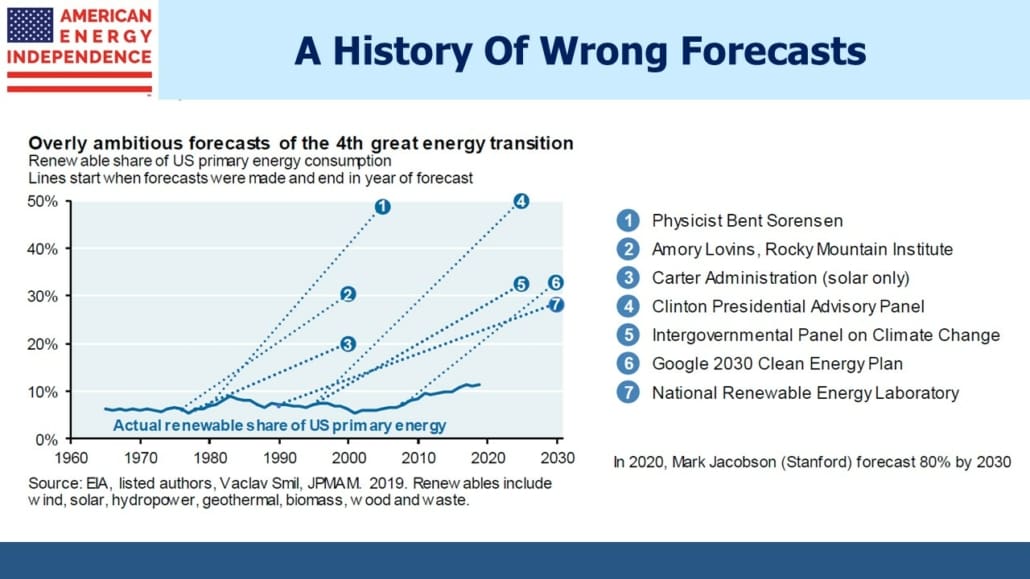
The inevitable conclusion is that climate change is occurring too slowly and with too limited impact to cause the dramatic behavioral changes called for by the IPCC. Western countries are moving aggressively to confront it, but the most likely outcome is that we’ll be stuck with the negative consequences of ever more solar panels and windmills without seeing any discernible impact on global CO2 emissions. Even though the IPCC report warns that populations in poorer countries are most vulnerable to heatwaves and rising sea levels, their energy consumption shows they deem increasing living standards to be more important.

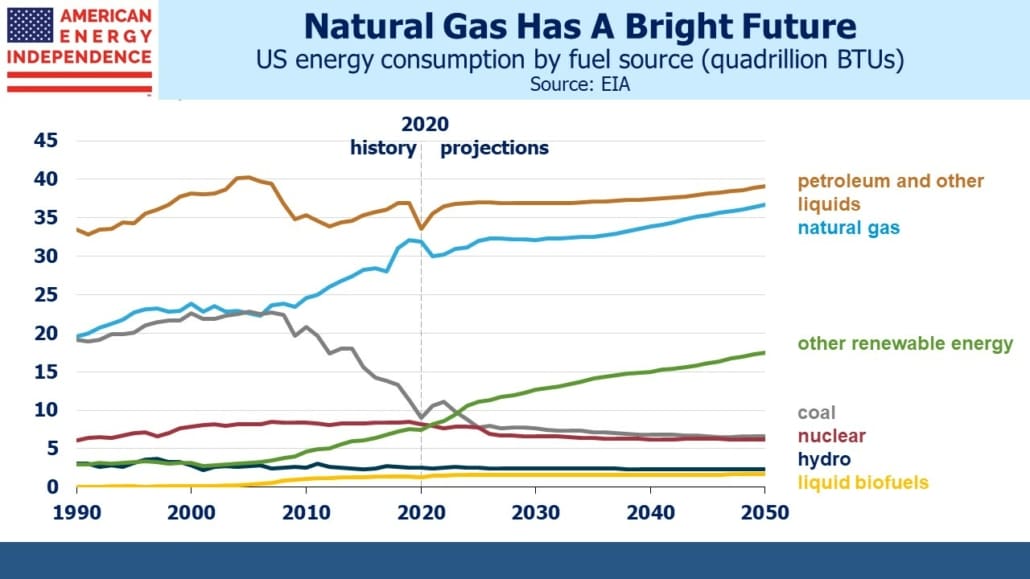
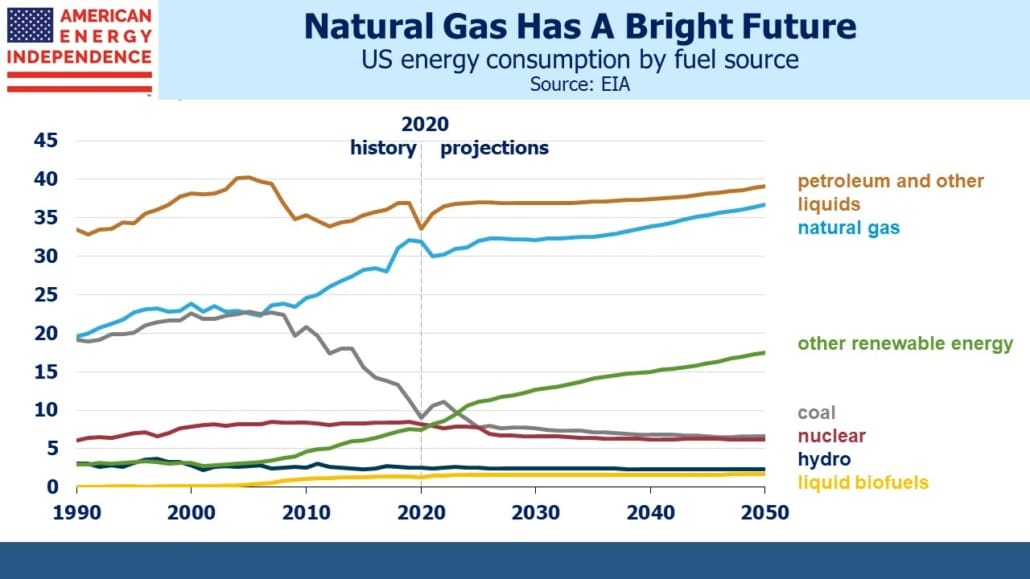
We’re going to adapt to a modestly warmer planet, while at the same time pursuing policies that reduce CO2 emissions. Coal to natural gas switching remains a big global opportunity, and US LNG export growth remains a bright spot for the domestic energy business. But the conflicting goals of raising living standards versus lowering emissions will continue to dominate the outcome.

We are invested in all the components of the American Energy Independence Index via the ETF that seeks to track its performance.


Inflation Concerns Remain

The fall in treasury yields can be misinterpreted as implying that inflation expectations are moderating. Although ten-year treasury yields have dropped 0.40% over the past three months, almost all of that has been through lower TIPs yields. Inflation expectations (nominal yields minus TIPs) have hardly budged.

Given the Fed’s outsized role in the bond market, it’s hard to discern market expectations absent their activity. They’re buying 54% of all net supply this year, and as we noted a couple of weeks ago (see Behind The Fed’s Benign Inflation Outlook) they bought 85% of net new supply in July. Over the next couple of months, reduced maturities and increased issuance combined with the Fed’s regular $80BN in monthly purchases will draw on increased purchases by others to balance the market.

.avia-image-container.av-1g0p7ue-8262b31e6f6102d1fcbc665e0aca7716 img.avia_image{ box-shadow:none; } .avia-image-container.av-1g0p7ue-8262b31e6f6102d1fcbc665e0aca7716 .av-image-caption-overlay-center{ color:#ffffff; }

Friday’s payroll report kept us on the interminable path towards tapering and an eventual cessation of Fed debt monetization. Former NY Fed president Bill Dudley was interviewed on Bloomberg and noted that restoring the Fed’s $8TN balance sheet to more normal levels will take many years.

Prior to 2008, quantitative easing via Fed buying of bonds was an unknown tool. Former Fed chair Ben Bernanke unlocked it to good effect, but the Fed’s balance sheet continued to grow for several years after the 2008-09 financial crisis. It took almost a decade for assets to start rolling off meaningfully. Covid hit within a year, and the Fed’s assets soon doubled.

.avia-image-container.av-103ni3a-1378fed376211625c549bb53077a5475 img.avia_image{ box-shadow:none; } .avia-image-container.av-103ni3a-1378fed376211625c549bb53077a5475 .av-image-caption-overlay-center{ color:#ffffff; }

It is a partial monetization of our debt, no matter how Fed chair Powell may describe it otherwise. Society’s tolerance for this is one more proof that inflation has few opponents nowadays. Monetary policy aims, “to achieve inflation moderately above 2 percent for some time” according to the FOMC’s most recent statement, and the bond buying will continue until, “substantial further progress has been made toward its maximum employment and price stability goals.”

While the Fed aims to boost inflation, fiscal policy is striving for the same. The $1TN infrastructure plan working its way through Congress will add $256BN to the deficit according to the non-partisan Congressional Budget Office, even though negotiators claimed that it would be revenue neutral.

Expect very little outcry over this, since low bond yields reflect the inconsequential cost. With fiscal hawks long gone, excessive deficit spending will continue until it causes inflation. The stock market’s brief pullback in mid-July was arrested in part because of the “Biden put” — a severe drop in economic activity would draw another multi-$TN fiscal stimulus.

.avia-image-container.av-k12geu-a8806bde3dd110fff5d9bb5b59b94c5b img.avia_image{ box-shadow:none; } .avia-image-container.av-k12geu-a8806bde3dd110fff5d9bb5b59b94c5b .av-image-caption-overlay-center{ color:#ffffff; }

Although bond yields have remained near their recent lows, eurodollar futures yields rose during the week as the odds of a tightening in short term rates by the end of next year increased.

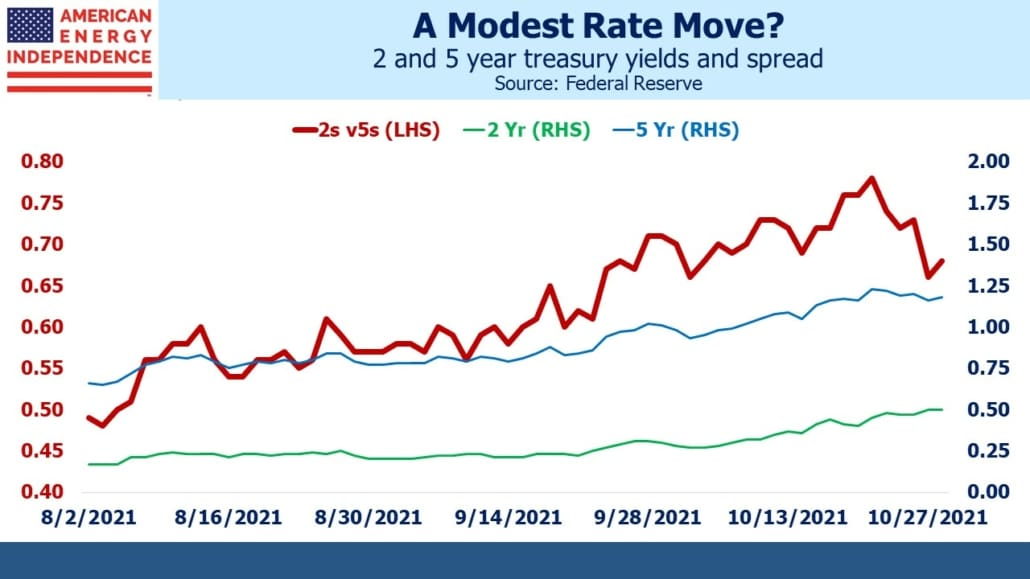
The yield curve nonetheless remains too flat. Median FOMC projections of short-term rates as well as the most dovish forecasts both suggest a sharper rate of increase from 2023 on. The FOMC’s forecasting record is abjectly poor. But this Fed is unashamedly dovish, so FOMC forecasts that are more aggressive than the market continue to look like an opportunity to bet with the FOMC by positioning for a steeper yield curve in eurodollars 2023-25, or that the 0.55% spread between two and five year treasuries is too narrow.

In other news, the Economist magazine recently ran a piece called A 3°C world has no safe place. It presented a sober contrast between the (mostly unmet) pledges of countries to reduce CO2 emissions and the scientific modeling that predicts the consequences. Rich countries committed $100BN per year to help developing countries adapt, although even this sum has not been delivered. Even though such promised transfer payments get virtually no coverage in US media, political leaders in countries like South Africa can be found on TV telling viewers that much larger sums are needed to pay for the energy transition.

As we noted in a recent podcast (Episode 79: The Bill For The Energy Transition), South Africa believes $750BN per year is needed from OECD to emerging economies, which would work out to $250BN from the US if apportioned among rich countries based on relative GDP. This is almost 4X what we spend on Medicare and Health, or over 40% of our defense budget. It’s as well that such discussion doesn’t make it to the US, because it would at a minimum cast a pall over the Adminstration’s excited talk about green growth opportunities.

One of the most striking features of the Economist article was how slowly the climate changes. Models, which have a checkered past of making climate predictions although presumably are better today than ever, forecast dire consequences by 2100. None of the people likely to be impacted by this can read the article, while the people who must make sacrifices in the meantime to reduce emissions will have mostly died by then.

It’s why developing countries like China and India are more concerned about increased energy use to raise living standards now, and don’t share the concern of OECD countries about global warming.

We are invested in all the components of the American Energy Independence Index via the ETF that seeks to track its performance.


Absurdity Abounds In The Energy Sector

Williams Companies (WMB) announced 2Q21 earnings on Monday. Results were largely in-line with expectations; Adjusted EBITDA came in at $1,317MM, $11MM ahead of forecasts reflecting the stability of their business. Their dividend is +2.5% YoY and is now expected to be 1.9X covered by Available Funds From Operations (analogous to the Distributable Cash Flow metric often used in the past by MLPs). The $1.64 dividend yields 6.6%. Under the old ~90% payout regime MLPs used to follow, WMB would yield over 11%.

6.6% is an attractive yield by any measure. Transco, WMB’s extensive pipeline network running along the eastern US, has investment grade bonds outstanding to 2050 that yield 3.06%. The equanimity with which bond investors accept equity-type risk for comparatively little is not unique to the pipeline sector. Rigid investment mandates partly explain the bifurcated market for WMB’s securities, and emphasize the continuing opportunity for equity buyers. Leverage (Net Debt:EBITDA) is expected to reach 4.2X by year-end, down from 4.35X the prior year.

.avia-image-container.av-7biu03-9ce41b4e269cd4763b32cd2cc2965fb3 img.avia_image{ box-shadow:none; } .avia-image-container.av-7biu03-9ce41b4e269cd4763b32cd2cc2965fb3 .av-image-caption-overlay-center{ color:#ffffff; }

The energy transition notwithstanding, natural gas volumes passing through WMB’s pipeline network showed continued healthy growth. Of particular note was the 30% jump in natural gas for export, either as Liquified Natural Gas (LNG) or via pipeline to Mexico.

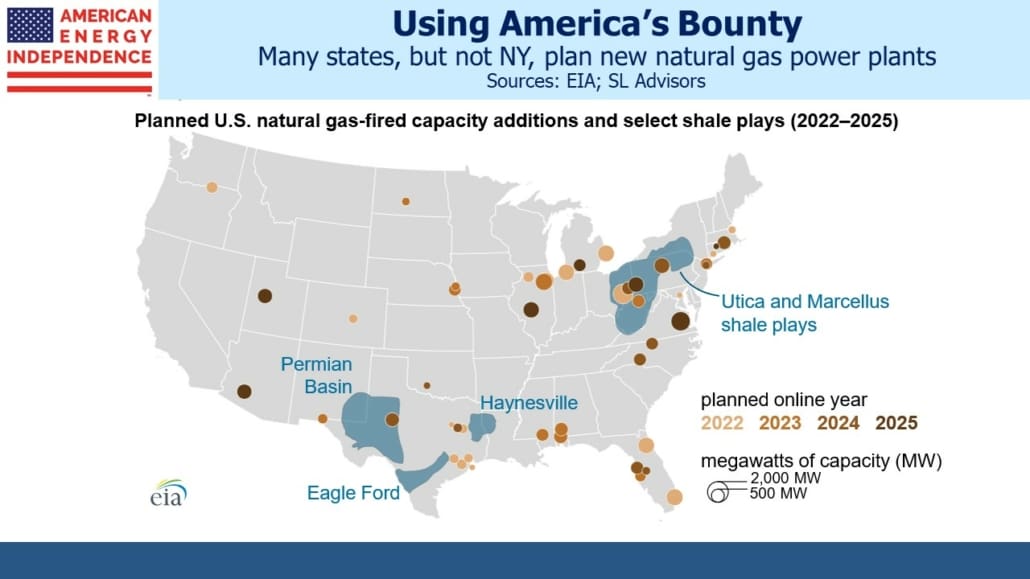
WMB is planning to invest $2BN to bring an additional 1.8 Billion Cubic Feet per Day (BCF/D) of natural gas to customers, mainly in the northeast. Careful examination of the map shows that the expansion only reaches as far as NJ and Pennsylvania. Massachusetts, which could surely use more natural gas, is currently debating whether to require that new construction omit natural gas connections (see Towns Trying to Ban Natural Gas Face Resistance in Their Push for All-Electric Homes). All-electric homes don’t sell as quickly as regular ones, reflecting a market push-back against the imposition of new regulations.

.avia-image-container.av-1s5ciw3-a8817e46b11403a63b7587fb5c42a689 img.avia_image{ box-shadow:none; } .avia-image-container.av-1s5ciw3-a8817e46b11403a63b7587fb5c42a689 .av-image-caption-overlay-center{ color:#ffffff; }

Residential power supplies are already prone to outages during bad weather, so it’s understandable that the prospect of becoming fully reliant on electricity even while utilities add intermittent renewables is not appealing. Natural gas never goes down.

Meanwhile, South Africa is sensibly looking to natural gas as a way to reduce its CO2 emissions (see Coal-Reliant South Africa Is Turning to Gas Power). They estimate electricity produced using natural gas will cost 3X as much as from the coal plants that are nearing the end of their useful lives. Renewables may even be cheaper, but tellingly South Africa is willing to spend more for reliability.

.avia-image-container.av-106kixv-c8e97dfa2ef8f10e842f575ddca93357 img.avia_image{ box-shadow:none; } .avia-image-container.av-106kixv-c8e97dfa2ef8f10e842f575ddca93357 .av-image-caption-overlay-center{ color:#ffffff; }

In preparation for the COP26 UN meeting in Glasgow in November, environment ministers have been discussing the level of financial support OECD countries should be willing to provide to emerging economies to help them pay for the energy transition. It’s a valid debate, but not one that has yet caught the public’s imagination. South Africa’s Environment Minister recently suggested that $750BN per year would be needed in financial support from rich world countries. Assuming this burden was shared according to each OECD country’s share of OECD GDP, the US would be on the hook for about a third.

The prospect of the US paying $250BN per year to poor countries to speed their energy transition is sharply at odds with Joe Biden’s message that it was all about well-paid union jobs. There’s zero prospect that Congress would approve anything like this – but the fact that such figures are floated exposes the gulf between practical solutions and underlying political support. OECD countries have already failed to meet a $100BN pledge for 2020.

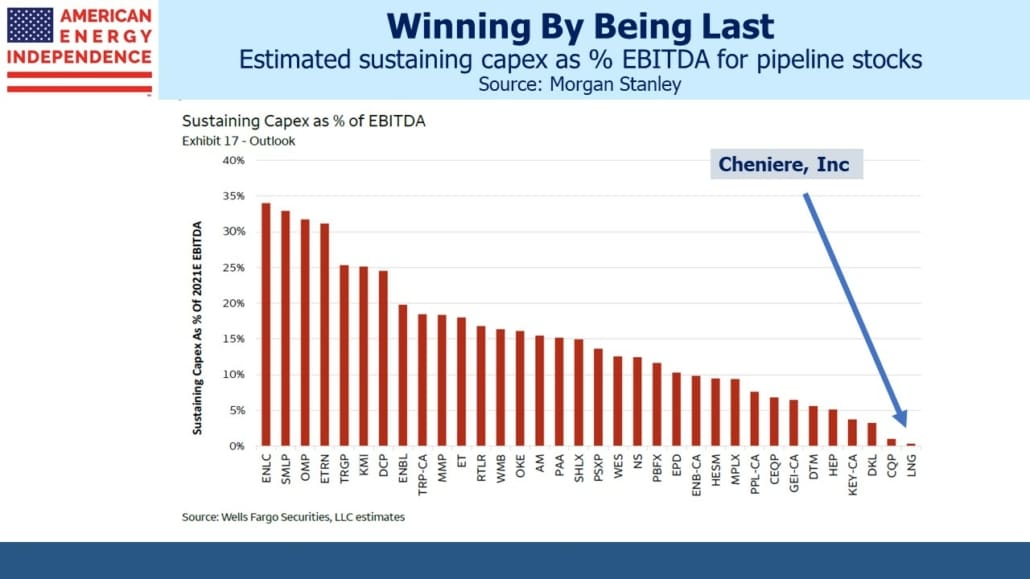
Returning to WMB, like most pipeline companies they self-funds their growth plans. Cash generated now goes to dividends and capex. Rising EBITDA reduces leverage and investors do not expect any dilutive secondaries.

.avia-image-container.av-73fr7-c14384b9d243931f3dc85d22ef2bc045 img.avia_image{ box-shadow:none; } .avia-image-container.av-73fr7-c14384b9d243931f3dc85d22ef2bc045 .av-image-caption-overlay-center{ color:#ffffff; }

This is in marked contrast to many utilities, which are spending $BNs on renewables and delivering negative Free Cash Flow (FCF) in the process. Today’s market forgives them because they’re investing in green projects. But battle-scarred US energy investors will recall the same willingness of Wall Street to overlook negative FCF during the early years of the Shale Revolution.

Germany has demonstrated that too much reliance on renewables leads to much more expensive electricity. California has managed to combine high prices with unreliability. Many of the utilities currently outspending their cash flow may find that expensive intermittency isn’t highly valued if they go too far, at which point the years of negative FCF will not look so smart.

Banning new natural gas hookups, outspending cash flow to build renewables and poor countries demanding GDP-sized payments to help reduce emissions; the energy sector is witnessing much that is absurd. Fortunately, natural gas pipeline transmission continues to grow reliably.

We are invested in all the components of the American Energy Independence Index via the ETF that seeks to track its performance.


Pipelines Still Linked With Inflation

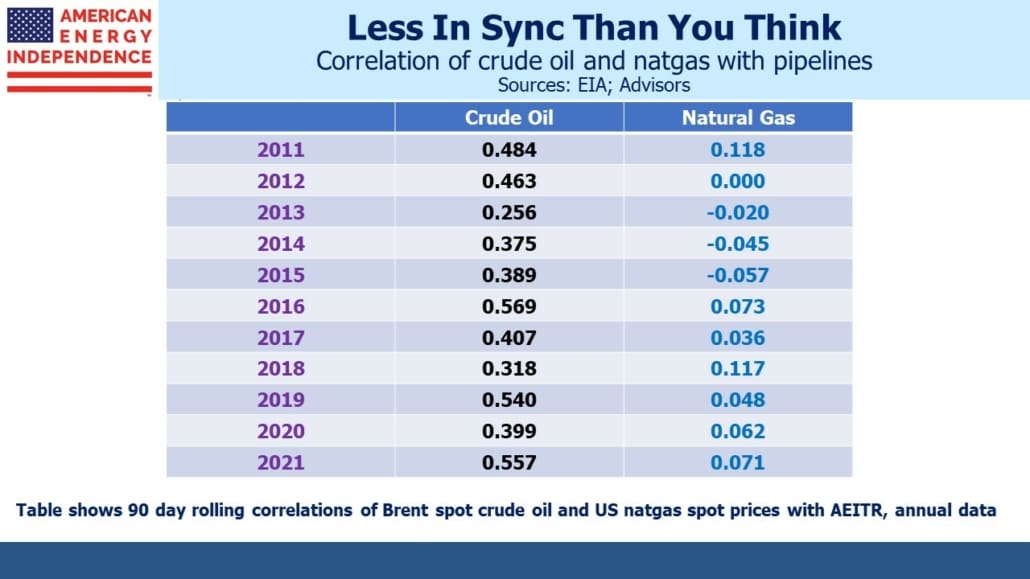
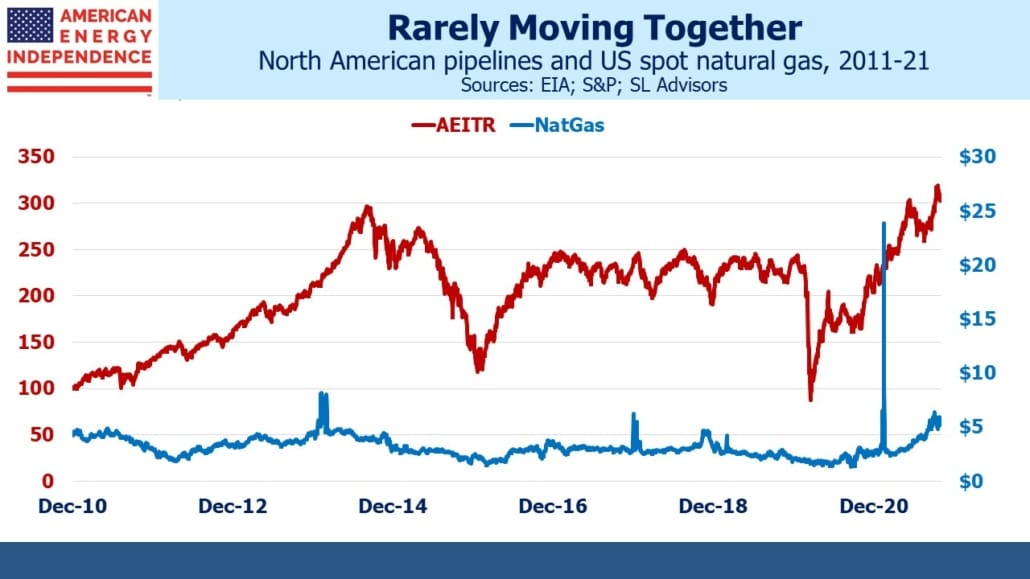
The link with crude oil is a familiar topic for investors in pipelines, who have often been told that the two are uncorrelated only to experience both inconveniently plunging together.

Since the Covid bottom in March, crude oil and midstream energy infrastructure have conveniently tracked each other higher – until the last several weeks during which the sector has slid while crude oil has held its gains. Visually, the last 16 months looks as if the two are closely linked. But the correlation of daily returns over that period is surprisingly low at only 0.28.

.avia-image-container.av-1vw5288-f209265e00e79ca5f234e126667ca19a img.avia_image{ box-shadow:none; } .avia-image-container.av-1vw5288-f209265e00e79ca5f234e126667ca19a .av-image-caption-overlay-center{ color:#ffffff; }

Episodes such as April 2020, when the two diverged sharply as crude went briefly negative, have an outsized impact on this statistic. As we’ve also noted, 2020 operating performance for most big pipeline companies came in within a few % of pre-Covid operating performance. It remains the case that stock prices move far more with oil than cash flows.

One reason for the relative weakness in midstream recently has been the drop in bond yields. The rise in inflation expectations increased interest in businesses with pricing power, and many pipelines have agreements that link price hikes to PPI. The ability to increase prices with inflation used to be an attractive feature years ago when MLPs were bought for their stable yields.

The volatility ushered in by the Shale Revolution took focus elsewhere, but this feature of contracts has remained and will likely become more important in the years ahead. In research last month (see Market Underprices Rate Hike Risks), Wells Fargo calculated that 60% of midstream EBITDA was exposed to inflation escalators, and with a 5.5% 2021 PPI estimate they calculated a 3% lift to sector EBITDA.

.avia-image-container.av-wtroa0-6b81d472f2f29902e10eb461999c3afc img.avia_image{ box-shadow:none; } .avia-image-container.av-wtroa0-6b81d472f2f29902e10eb461999c3afc .av-image-caption-overlay-center{ color:#ffffff; }

The recent moderation in inflation fears reflected in lower bond yields has similarly depressed the pipeline sector. This is likely to be temporary. As we noted last week, Fed bond buying took up almost all available net new supply in July (see Behind The Fed’s Benign Inflation Outlook). Inflation concerns are everywhere, with both fiscal and monetary policy being managed without regard to rising prices. The government will get what it wants, and the coincident drop in bond yields and pipelines serves to confirm the latter’s use as protection against inflation.

.avia-image-container.av-jdyu3s-899887cf8f6e76274416d68853b71bbb img.avia_image{ box-shadow:none; } .avia-image-container.av-jdyu3s-899887cf8f6e76274416d68853b71bbb .av-image-caption-overlay-center{ color:#ffffff; }

On a different topic, the International Energy Agency (IEA) recently issued a report on global electricity demand growth. It’s easy to conclude that renewables will soon be providing the majority of our power based on today’s popular press. The IEA noted that global electricity demand is increasing faster than renewables-supplied power. Since the power sector is renewables’ most important target, inability to even match demand growth reveals how unrealistic it is to think windmills and solar panels are going to fully solve the problem of climate change.

Moreover, because the growth in global electricity demand is centered in emerging Asia where coal use is high, this dirtiest form of energy is benefitting from strong demand. China represents half the worlds’s growth in power demand. Even last year they saw healthy growth, contrasting with widespread reductions due to Covid.

.avia-image-container.av-ujnzyg-302fc50a90b292c96511bce2a355fe9c img.avia_image{ box-shadow:none; } .avia-image-container.av-ujnzyg-302fc50a90b292c96511bce2a355fe9c .av-image-caption-overlay-center{ color:#ffffff; }

40% of this year’s growth in electricity demand will be provided by coal. China’s refusal to agree to a G20 communique phasing out coal is easily understood when considered alongside these figures from the IEA.

Even though coal continues to retain its outsized share of world electricity production, the opportunity for natural gas to offer a meaningful alternative remains immense.

Tellurian CEO Charif Souki mentioned this in a recent video. Confirming the positive long term outlook for natural gas, Shell became the third company to sign up with Tellurian to purchase 3 million tons per annum of natural gas.

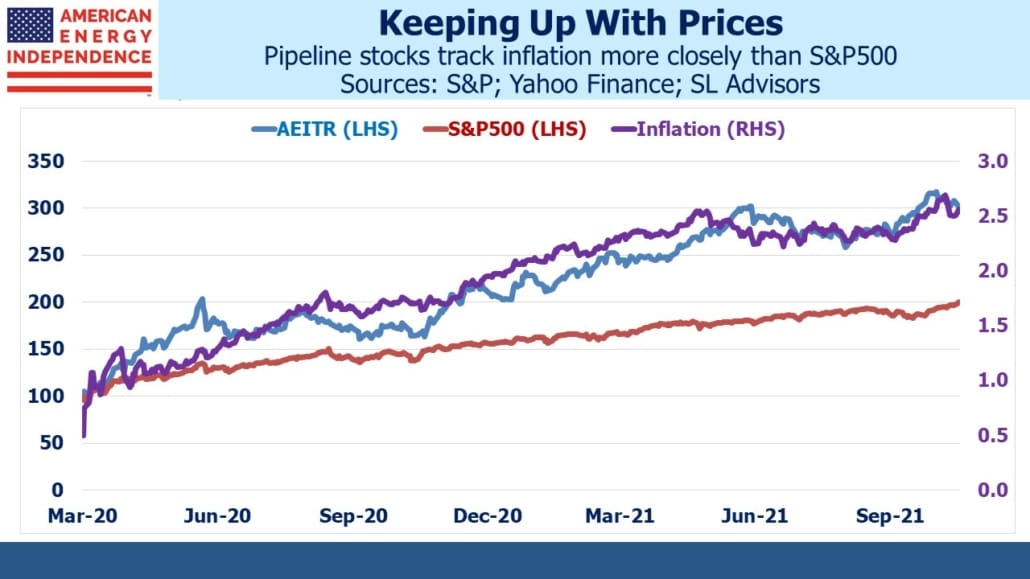
The American Energy Independence Index (AEITR) includes North America’s biggest pipeline companies. We believe the sector offers solid inflation protection as well as continued upside from growing global demand for US natural gas.

We are invested in all the components of the American Energy Independence Index via the ETF that seeks to track its performance.

We have three funds that seek to profit from this environment:

Energy Mutual Fund

Energy ETF

Real Assets Fund


G20 Confronts Environmental Reality

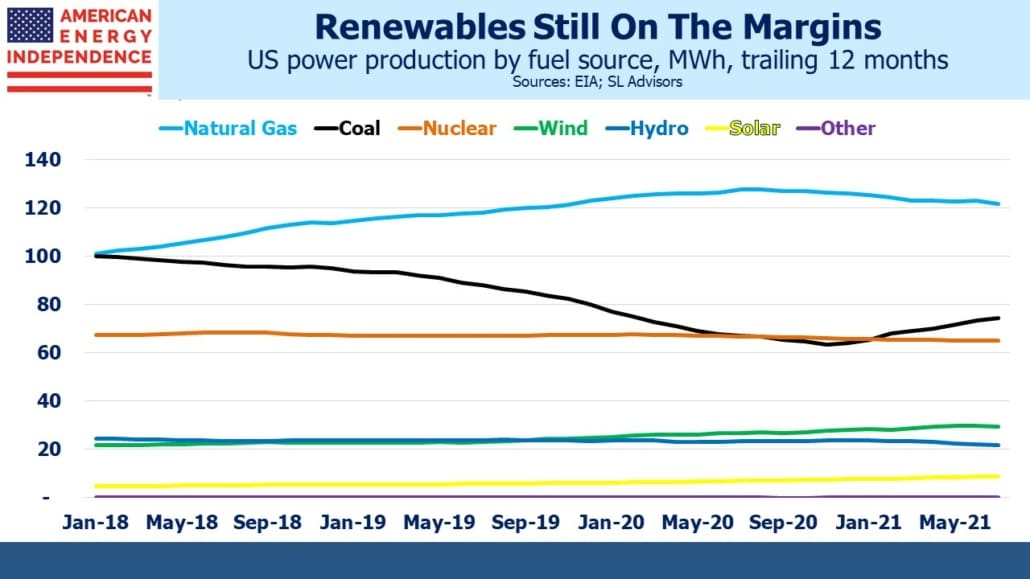
Last week’s meeting of G20 environment ministers to discuss global warming exposed fault lines in the rich world/poor world debate about climate change. Most notably, they couldn’t agree to phase out coal, even though this is the most effective step nations could take to reduce emissions of Global Greenhouse Gases (GHGs). Coal burning power plants can be replaced with natural gas. The US has done this successfully for over a decade, although progress has stalled this year due to higher natural gas prices.

China draws accolades for its huge investments in solar and wind. Last year they reportedly added 120GW of solar and wind power, although analysts were skeptical about the about the figure’s veracity. China has adopted a goal of being carbon neutral by 2060, so you would think that phasing out coal would be consistent with this goal.

But China’s refusal to make such a commitment reveals their other climate commitments to be less than solid. From the origins of the Covid pandemic to supporting cyberattacks, the Chinese government provides plenty of reasons for their public statements to be disbelieved.

.avia-image-container.av-1ndvomt-930936f4e59380d3120621221e45c577 img.avia_image{ box-shadow:none; } .avia-image-container.av-1ndvomt-930936f4e59380d3120621221e45c577 .av-image-caption-overlay-center{ color:#ffffff; }

The pie chart shows the magnitude of the problem. China burns half the world’s coal. The challenge of global warming pits the desire of OECD countries to limit emissions against the drive for higher living standards in the developing world. These two objectives are in conflict, as the G20 meeting showed.

The irony is that rich countries are far better equipped to protect themselves from the consequences should they occur, such as rising sea levels and more extreme weather, than poorer ones. In effect, America’s climate czar John Kerry is telling the developing world, let us help you by all reducing emissions since the results will be worse for you than for us. Those potential beneficiaries are responding that raising living standards for their populations, which requires increased energy consumption, is more important.

Seven years ago, John Kerry in a speech in Jakarta exhorted Indonesians to, “Make a transition towards clean energy the only plan that you are willing to accept.” At the time, an estimated 36 million Indonesians didn’t have access to clean water (see The Moral Case For Fossil Fuels). They have different priorities, appropriately so.

It’s positive that these opposing views are being brought into the open, because it makes eventual progress more likely. John Kerry’s view is hopefully less condescending than it was back then, having confronted reality.

.avia-image-container.av-1ccrk51-aef3921ac702a658e8d965f97734d4b3 img.avia_image{ box-shadow:none; } .avia-image-container.av-1ccrk51-aef3921ac702a658e8d965f97734d4b3 .av-image-caption-overlay-center{ color:#ffffff; }

India published a dissenting statement alongside the official communique, urging countries to reduce per capita emissions down to the global average. This is where political support quickly evaporates. For the US, this would require a 70% cut in GHGs, and therefore energy use. Joe Biden understands Americans have little tolerance for constrained access to energy. The White House recently lobbied OPEC to raise production so as to slow the increase in gasoline prices, even though higher prices are both necessary to reduce emissions and a consequence of his administration’s policies.

The White House has stopped short of seeking to phase out coal in the US, although it has a plan to “Invest in Coal and Power Plant Community Economic Revitalization” which aims to support areas “hard-hit by past coal mine and plant closures and vulnerable to more closures” (italics added). Phasing out coal in the US would be more easily done as part of a global consensus to do so which was sadly absent.

.avia-image-container.av-vjv5it-729207bb0c768e724b98d236ed315301 img.avia_image{ box-shadow:none; } .avia-image-container.av-vjv5it-729207bb0c768e724b98d236ed315301 .av-image-caption-overlay-center{ color:#ffffff; }

OECD countries are reducing emissions, but the world overall is not, other than through last year’s Covid recession. Climate extremists would have us shift to intermittent renewables even while the world’s biggest emitter, China, continues to add coal burning power plants at a dizzying pace. China’s planned coal plant additions outnumber the entire US fleet. They’ll more than offset any progress we make in this country. The G20 conference just concluded did at least expose the conflicting goals.

We are invested in all the components of the American Energy Independence Index via the ETF that seeks to track its performance.


Behind The Fed’s Benign Inflation Outlook

This week the FOMC meets on Tuesday and Wednesday. Most recently released minutes suggest that the gradual cessation of the $120BN in monthly bond buying ($80BN in US treasuries and $40BN in mortgages) is getting closer. Given the history of prior efforts to wean the bond market off Fed support, popularly referred to as “taper tantrums,” careful consideration is being given to every aspect of the decision.  

Unilever added to the list of companies reporting pricing pressure last week. CEO Alan Jope reported that, ““We are facing very material cost increases,” He provided examples, noting year-on-year increases in palm oil (up 70%), soyabean oil (up 80%), crude oil (up 60%) and ocean freight (up 40%).  

Procter and Gamble, which is in many of the same markets as Unilever, has already warned of price hikes to come in September. Operating chief Jon Moeller said,” “This is one of the bigger increases in commodity costs that we’ve seen over the period of time that I’ve been involved with this, which is a fairly long period of time.” 

The housing market continues to be red hot. One client told us he plans substantial increases in rents on properties he owns on Long Island, NY. This is in part to compensate for the difficulty in evicting delinquent tenants. Although the CDC’s eviction moratorium, which has been the subject of court challenges, expires at the end of July, New York State has issued their own moratorium.  

More expensive real estate is pushing up rents. Data from Zillow shows that rents are up 7% across the country from a year earlier.  

House prices are up too. The most recent Case-Shiller US National average rose 2.1% in the previous month, +14.6% for the year. It is the topic of cocktail conversation among the lockdown-liberated. The Fed’s $40BN a month of mortgage buying is boosting home prices by holding mortgage rates down. 

.avia-image-container.av-18flol7-b09400f0e5639eecc65e1f08a69a1d2a img.avia_image{ box-shadow:none; } .avia-image-container.av-18flol7-b09400f0e5639eecc65e1f08a69a1d2a .av-image-caption-overlay-center{ color:#ffffff; }

The FOMC will discuss the frothy housing market but may draw comfort from other data. For example, Owners’ Equivalent Rent (OER) is showing a 2.3% year-on-year increase. As we’ve noted, OER is drawn from a survey that asks homeowners what rent they believe their house would command in the market (see Why You Can’t Trust Reported Inflation Numbers). Most homeowners have only a vague notion of what this figure is, or OER would be rising along with actual rents and house prices.  

Moreover, how is the FOMC to regard OER if it belatedly starts rising, especially if the actual market for housing and rents starts to cool? OER is never tested against the market, since it’s not based on actual transactions. A homeowner can theoretically offer an aspirational rent estimate in response to a survey from the Bureau of Labor Statistics even if their home would never rent at that level. It’s likely that this dovish FOMC would dismiss rising OER as inconsistent with other data and not reflective of cash transactions. So it’s a useless component of the CPI, albeit a significant one with a 24% weighting. The Fed prefers the index of Personal Consumption Expenditures which uses OER but at a smaller weight.  

Dumping the OER concept and relying on actual cash expenditures on shelter would usher the Fed into the world the rest of us inhabit. 

.avia-image-container.av-qo3zq3-f139330b13b063914d6cad442559f614 img.avia_image{ box-shadow:none; } .avia-image-container.av-qo3zq3-f139330b13b063914d6cad442559f614 .av-image-caption-overlay-center{ color:#ffffff; }

The FOMC may also draw some comfort from falling bond yields. Ten-year inflation expectations, derived from the difference between nominal and real yields on US treasuries, have fallen from 2.5% in late May to 2.28% currently. Fed chair Jay Powell has repeatedly assured us that the rise in inflation is transitory, so he may point to the bond market as confirming this belief. The FOMC remains convinced that there remains plenty of slack in the labor force. Interestingly, the non-partisan Congressional Budget Office believes we are closer to potential GDP, which in their view implies less economic slack than the Fed believes.  

Chair Powell may peruse recent work from Citi Research, which takes monthly gross issuance of US treasuries, deducts redemptions and Fed buying to arrive at the net supply to be absorbed by other buyers. July’s $94BN of net supply is the lowest figure of the year, a third less than the monthly average of $150BN. Citi argues that bond scarcity was behind the recent drop in yields.  

At first, I thought this seemed too simplistic. Surely the buyers, who are largely central banks and sovereign wealth funds and others with inflexible mandates, must nonetheless be aware of this seasonality and adjust their buying accordingly. But then I realized that our own central bank doesn’t even do that. Their monthly purchases are fairly consistent.  

In July, Fed buying will take up 85% of net supply, versus 54% on average during the year. In May the Fed bought up only 45% of net supply. 

Therefore, the recent drop in inflation expectations that will cause some relief among FOMC members may be in part their own doing. Combined with their failure to accurately measure housing inflation, the FOMC looks increasingly divorced from the real economy.   

September is a heavy issuance month, and the Fed will only be buying around 44% of net supply. If they’ve begun tapering by then, it could be even less. Managing portfolios while the FOMC tries to elegantly exit their ongoing partial debt monetization will require deft risk management for the rest of us.  

We are invested in all the components of the American Energy Independence Index via the ETF that seeks to track its performance.


Was That A Delta Head Fake?

Crude oil fell sharply on Monday, hit by the long-awaited confirmation of increased production from OPEC and growing concerns about the Delta Covid variant. Pipeline stocks dropped along with the energy sector. Financial markets’ concern coincided with the dropping of all remaining Covid restrictions in the UK (although visitors still face mandatory testing and/or self-quarantine, depending on where they’re coming from). After a strong rally for most of the year, some investors were clearly caught out by the market’s sudden concern with the Delta variant. Although infections are rising, there are far  fewer hospitalizations than before in developed nations because of widespread vaccinations and acquired immunity.

Lockdowns and other measures that seek to protect populations continue to inflict much damage. Deaths from drug overdoses in the US rose by 30% in the past year, a jump at least partially blamed on Covid lockdowns. Moreover, CDC data shows that 87% of all deaths among all age cohorts above 40, even including those 85 and older, didn’t involve Covid. All those people who died since January 2020 endured a lousy last year of life trying to avoid Covid, but the vast majority succumbed to something else.

.avia-image-container.av-vuit81-05b4528ceb50bb4de455ea78cb9c3f98 img.avia_image{ box-shadow:none; } .avia-image-container.av-vuit81-05b4528ceb50bb4de455ea78cb9c3f98 .av-image-caption-overlay-center{ color:#ffffff; }

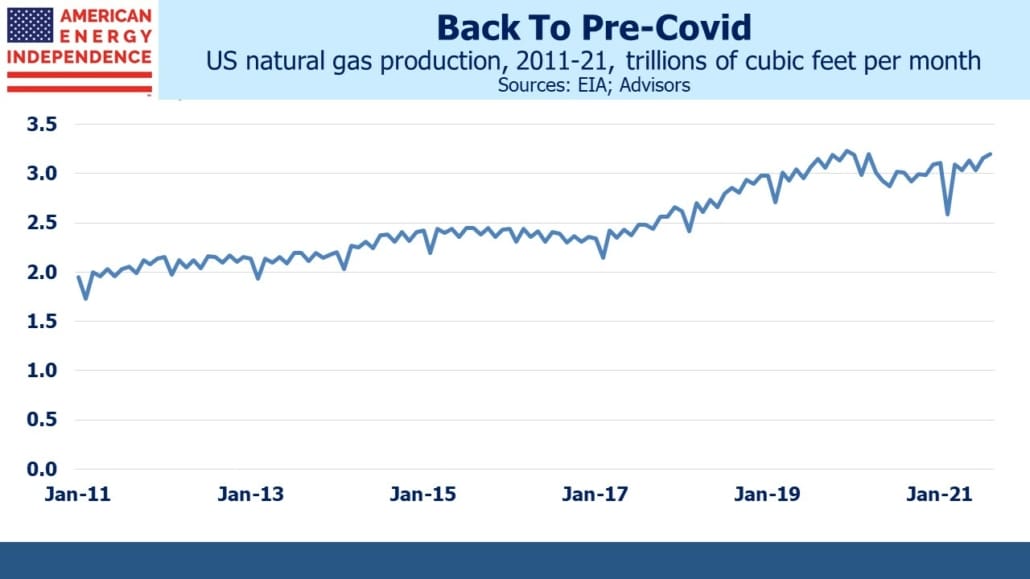
Although oil garners most attention, natural gas is at least as important to North American midstream, energy infrastructure. Global prices have been rising, even recently when oil prices have weakened. The JKM benchmark for Japan and South Korea continues to trend higher, as does the TTF European benchmark. This has improved the economics for exports of US Liquified Natural Gas (LNG), and volumes continue to grow.

Even last year, global LNG volumes were flat, contrasting with crude oil where global demand was down 7%. The US saw the biggest growth in LNG exports, +1.5 Billion Cubic Feet per Day (BCF/D) to 6.5BN. Following a fall last summer as the world endured its brief Covid recession, volumes rebounded in October.

The outlook for LNG exports looks very strong. The International Energy Agency (IEA) recently forecast that global power demand would rise 5% this year following a drop of just 1% in 2020. This is driven by emerging economies, particularly in Asia. Just under half of the increase relies on fossil fuels, especially coal. The continued importance of the dirtiest of fossil fuels in Asian power generation represents a huge opportunity for natural gas. Switching from coal to natural gas would lower emissions, emulating the success the US has had doing just that. Global use of natural gas for power generation is expected to rise 1% this year and almost 2% next, following a 2% drop in 2020.

Over the past five months US exports of LNG plus pipeline exports to Mexico have averaged over 17 BCF/D. After a slow start, Mexican demand is picking up and looks set to grow at 10% pa over the next four years. Even though US power sector demand for natural gas is moderating as higher prices cause switching back to coal, export demand is more than making up the difference.

Recent floods in Germany have become an election issue, with all the major parties attributing this extreme weather event to changing climate. Germany is about 2% of global emissions, so even if voters demanded a swift move towards carbon neutrality, German weather wouldn’t change perceptibly as a result. However, a sensible result of increased German concern about climate could be pressure on China and other emerging countries in Asia to lower their use of coal. Natural gas would stand to benefit.

It’s only a couple of years since the TTF benchmark was under $4 per Million BTUs (MMBTUs), less than a third of today’s price. This is drawing more long-term buyers of US LNG, which has in turn caused leading LNG exporter Cheniere to sign a 15-year purchase agreement from Tourmaline, Canada’s biggest producer of natural gas. Tellurian’s CEO Charif Souki has said he expects to announce additional LNG offtake agreements to add to the two recent ones they signed (see Pipeline Rally Exposes Lagging MLP Sector).

The volatility of crude oil and its consequent impact on energy sentiment distracts attention from the long term commitments being made for natural gas.

We are invested in all the components of the American Energy Independence Index via the ETF that seeks to track its performance.