How Tightening Impacts Our Fiscal Outlook

For anyone in finance, the US budget deficit has always been a looming disaster but rarely a current problem. It hasn’t been a political issue since Clinton ran for office and Jim Carville quipped that the bond market intimidated everybody. For a few brief years we had a budget surplus (1998-2001), but fiscal prudence long ago lost its appeal with voters because the current costs of profligacy are inadequate to impact elections.

But tomorrow is approaching, and according to the Congressional Budget Office (CBO) sooner than we thought a year ago.

.avia-image-container.av-23955vn-ebd9386f72a415ccac9a214be37b3d18 img.avia_image{ box-shadow:none; } .avia-image-container.av-23955vn-ebd9386f72a415ccac9a214be37b3d18 .av-image-caption-overlay-center{ color:#ffffff; }

Last week the CBO updated their 10-year budget projections, with disappointing revisions compared with the prior release last May. Our Debt:GDP is at levels last seen towards the end of World War II. Back then following the end of hostilities spending fell, and artificially depressed government bond yields helped lower the country’s debt burden.

This time around, ballooning Medicare and social security spending will take us into uncharted territory.

.avia-image-container.av-57hubn-088ab160e7b1f37a99c222ed17e41c2c img.avia_image{ box-shadow:none; } .avia-image-container.av-57hubn-088ab160e7b1f37a99c222ed17e41c2c .av-image-caption-overlay-center{ color:#ffffff; }

Rising debt has increased our interest rate sensitivity. The CBO’s outlook for inflation and bond yields hasn’t shifted apart from reflecting today’s higher inflation. Compared with last year’s forecast, inflation is expected to return to the Fed’s 2% target a year later.

The impact on our finances has been dramatic. Debt will now exceed GDP next year, four years earlier than before. Interest expense over the next decade will be $159BN higher annually, bringing forward by approximately two years milestones such as $500BN, $1TN or $1.25TN in annual debt servicing cost.

The White House is unlikely to dwell on this, but the change in circumstances between the two CBO publications might represent the most rapid deterioration in America’s finances in history. The bigger the problem gets the harder it is to solve.

.avia-image-container.av-124pg9v-d995ebdfad990227673672d83df45021 img.avia_image{ box-shadow:none; } .avia-image-container.av-124pg9v-d995ebdfad990227673672d83df45021 .av-image-caption-overlay-center{ color:#ffffff; }

It would be worse without Quantitative Easing (QE). The Fed still holds $5.4TN in government bonds and another $2.6TN in MBS. Without return-insensitive buyers such as central banks (see More Than A Fiscal Agent) and others with inflexible investment mandates financing our debt would be even more costly.

The Fed follows its dual mandate by focusing on whichever of the two variables (employment or inflation) is farthest from its desired level. In the summer of 2019 at Jackson Hole, they concluded that we could tolerate a little more inflation over short periods to boost employment (see The Fed’s Balance Sheet Has One Way To Go). The timing was unfortunate, and within a couple of years a modest overshoot demanded their attention.

.avia-image-container.av-mnqfur-1c37994a23c79d5268ac5c5a6ef509cb img.avia_image{ box-shadow:none; } .avia-image-container.av-mnqfur-1c37994a23c79d5268ac5c5a6ef509cb .av-image-caption-overlay-center{ color:#ffffff; }

The Fed’s Congressional mandate doesn’t include concern about the fiscal impact of their actions, but they are becoming more impactful. QE has emasculated debt hawks by hiding the apparent cost of fiscal excess. QE’s slothful removal has impeded the Fed’s efforts to slow the economy, as seen in recent strong data such as employment and retail sales.

The current tightening cycle hasn’t been enough to raise unemployment, but it’s had a meaningful impact on our debt outlook. The Fed’s interpretation of its dual mandate now has a fiscal dimension.

The logical response is to tolerate higher inflation. There’s nothing magic about 2% – stability is more important than its level (see El-Erian, Rogoff Say It’s Too Late to Fix Too-Low Inflation Target). The numbers suggest that tolerance of 3% inflation leaves us better able to service our debt than 2%. There are few tangible benefits from the current effort to stick to the old inflation target.

Last year interest expense alone was 1.90% of GDP. Within a decade it is expected to reach 3.52%, up from a 3.254% projection in May.

The Fed’s Summary of Economic Projections has the Fed Funds rate ending this year at 5.1% and next year at 4.1%. The CBO expects Fed Funds to average 3.6% in 2024 (last year they were projecting 2.6% for 2024). If the Fed is right, the CBO’s 2024 interest rate forecast will be around 1% too low, which will result in further adverse updates to our fiscal outlook.

The CBO aligns with where interest rate futures were when they prepared their budget outlook. Since then, strong data has caused the market to shift towards the Fed’s projections.

Fed chair Powell has been clear that bringing inflation back to 2% is in everyone’s interests. While this is consistent with their Congressional mandate, it’s no longer the most desirable public policy. Our vast debt, poor fiscal outlook and heightened interest rate sensitivity make increased inflation tolerance preferable.

For now, investors should take the Fed at its word that they’ll do what it takes. But the impact on our finances of returning inflation to its 2% target is eventually going to make this a consideration. It means defining price stability as 2% inflation is becoming more costly. Maintaining the purchasing power of your assets means assuming inflation settles in higher than this target.

We have three funds that seek to profit from this environment:
Energy Mutual Fund

Energy ETF

Inflation Fund


Market Bows To FOMC Forecast

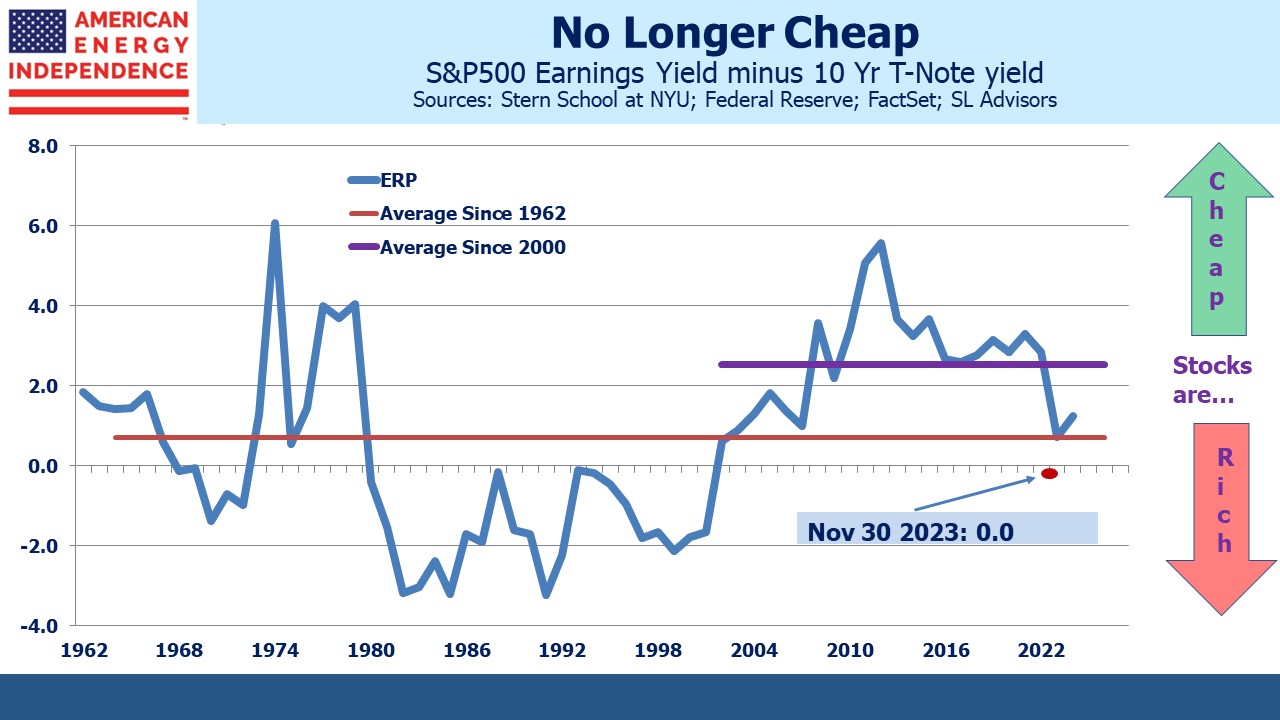
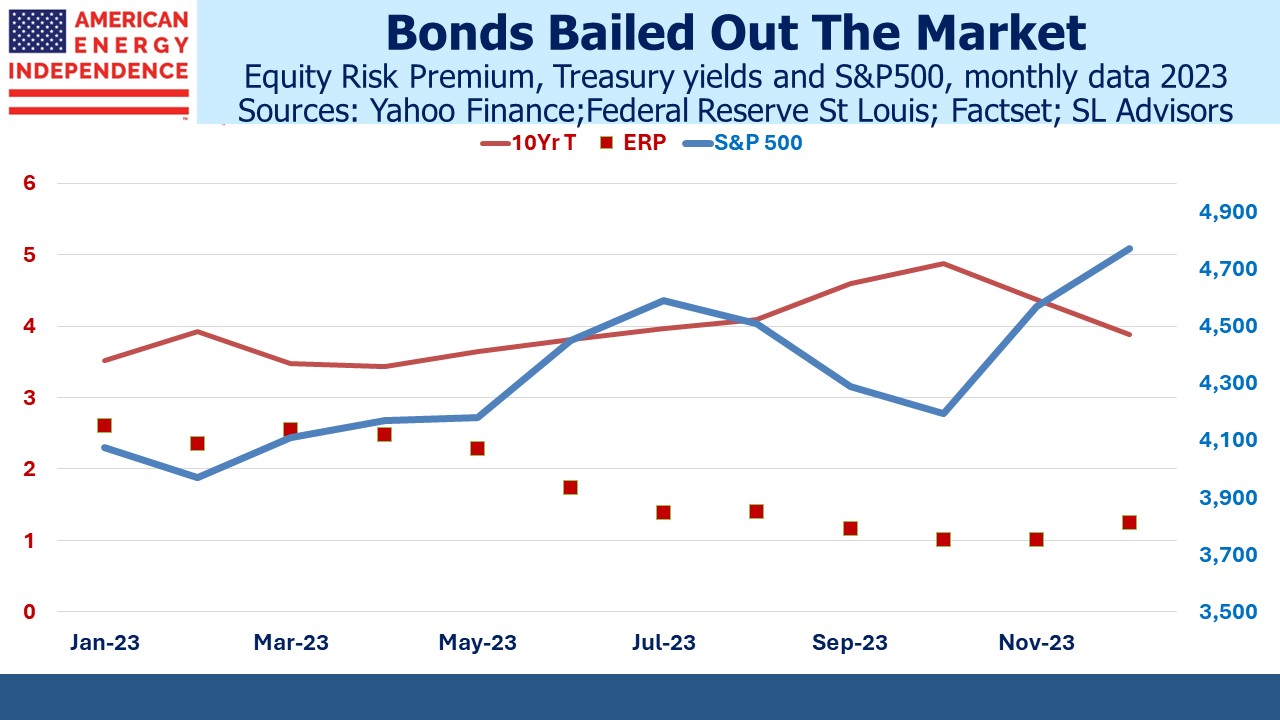
A couple of weeks ago stocks and bonds looked vulnerable to strong data (see Confronting Asymmetric Risks). Since then the narrative of impending recession has been punctured by employment, retail sales and inflation figures that all surprised to the upside. Valuations based on the Equity Risk Premium (ERP) were only moderate. Since then, stocks are slightly lower and ten year yields sharply higher.

The result is that the ERP shows stocks are the least attractively priced in over a decade. Earnings growth could offset this, except that analysts continue to revise them down. Bottom-up S&P500 2023 EPS of $224 is 10% lower than last summer and still trending down. It’s possible the strong jobs and spending figures will translate into upward revisions to earnings forecasts, but unlikely to be enough to change the overall picture.

.avia-image-container.av-1trr7md-3da969216ae341f4a2d7769b38603d8b img.avia_image{ box-shadow:none; } .avia-image-container.av-1trr7md-3da969216ae341f4a2d7769b38603d8b .av-image-caption-overlay-center{ color:#ffffff; }

Fed funds futures have also repriced sharply. The brief euphoria when Fed chair Jay Powell mentioned “disinflation” has been replaced by a growing acceptance that the FOMC’s predicted 4% YE 2024 Fed Funds rate might even be too low.

The ten-year treasury yield has risen around 0.30% since the end of January, but the correction in Fed Funds futures has been more severe. The likely path of monetary policy over the next couple of years has adjusted 0.50-0.60% higher in less than three weeks. In the past, large discrepancies between futures and the FOMC’s Summary of Economic Projections have been resolved in a way that confirms the Fed’s poor forecasting record (see Don’t Bet On A Return To 2% Inflation). For once the market has been forced to adjust.

.avia-image-container.av-14g6fat-43c87ad42a25e5e46285512a14682b79 img.avia_image{ box-shadow:none; } .avia-image-container.av-14g6fat-43c87ad42a25e5e46285512a14682b79 .av-image-caption-overlay-center{ color:#ffffff; }

Interestingly, some are beginning to make the case for dropping the 2% inflation target. Mohamed El-Erian argues that, “You need a higher stable inflation rate. Call it 3 to 4%.” Such views are in the minority and there’s no chance the Fed will alter their 2% target. So the risk for short term rates is that they go higher than currently priced in. However, a moderately higher inflation target is better for the US, if not the lost credibility the Fed would endure in getting there. How this plays out will impact investment returns for years. For now, inflation expectations remain well anchored in spite of the recent strong data.

.avia-image-container.av-wlm3lh-9f0d31865c4e4d5372ae44f5aea28af4 img.avia_image{ box-shadow:none; } .avia-image-container.av-wlm3lh-9f0d31865c4e4d5372ae44f5aea28af4 .av-image-caption-overlay-center{ color:#ffffff; }

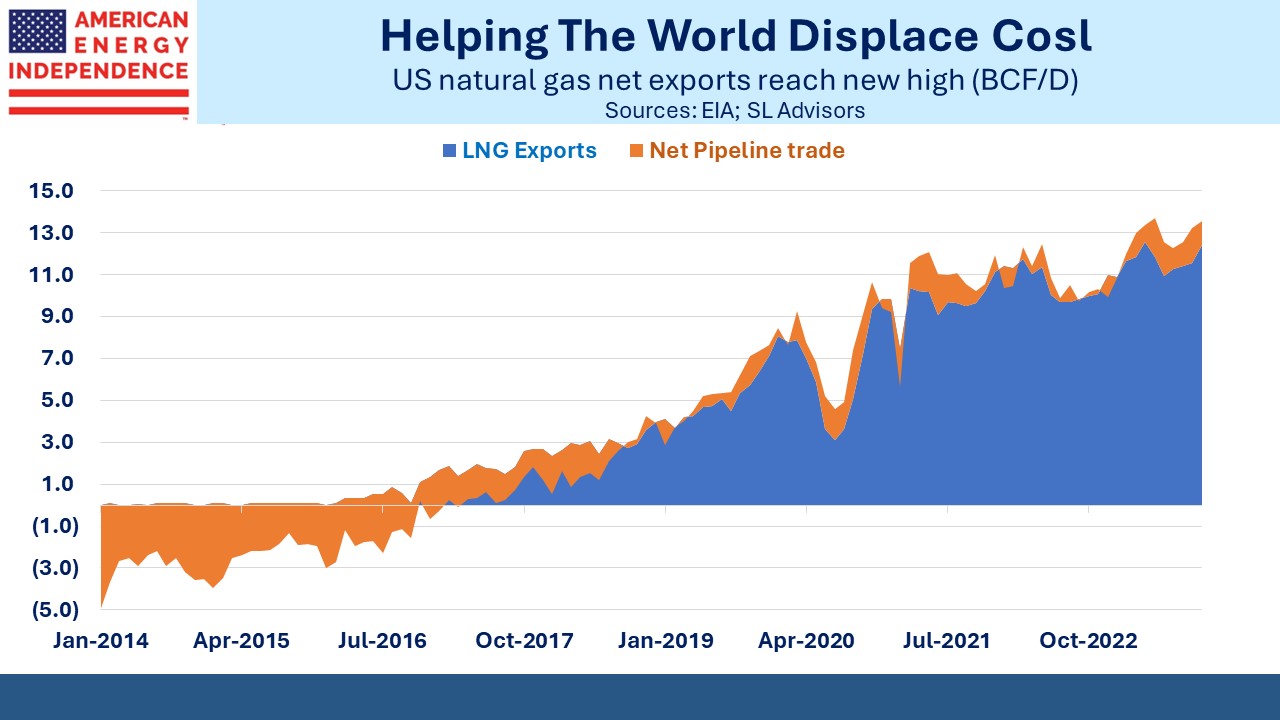
Pipeline earnings continue to come in close to or better than expectations. Energy Transfer (ET) reported 4Q22 EBITDA 4% ahead of analysts’ expectations. On their ensuing earnings call they warned of a delay to their Lake Charles LNG project. Co-CEO Tom Long said that, “The LNG market along the Gulf Coast is currently extremely competitive.” There are several competing projects looking to sign up sufficient buyers to justify Final Investment Decision (FID) so they can start construction. Ultimately there’s little doubt that the US will grow its exports of natural gas, but long-term contracts of twenty years make a good marriage of buyer and seller critical.

An interesting response came when the Barclays analyst asked,”…if you could share your latest thoughts on a potential C-Corp currency.”

In 2014 Kinder Morgan acquired its MLP Kinder Morgan Partners (KMP), leading to a tax bill and reduced dividends for KMP investors. Other simplifications followed, and the MLP sector has never recovered its reputation. Energy Transfer gave up the GP/LP structure, but limited partnerships continue to provide weaker governance. It’s why MLPs are excluded from ESG indices – they score poorly on “G”.

It’s generally thought that the MLP conversions to c-corps have been done. Energy Transfer, Enterprise Products and Magellan Midstream have shown little inclination to adopt a corporate tax burden in exchange for a higher stock price. If you don’t intend to sell your MLP holding, the conversion makes little sense because future earnings and therefore distributions would be lowered by the 21% US corporate tax rate.

However, a business contemplating acquisitions using its equity securities as a currency might conclude the higher price granted a c-corp to be worthwhile. Hence Tom Long’s response was intriguing: “We do have a team that’s working on that. I guess the way I would tell you is that we are spending quite a bit of time in evaluating that. And we feel pretty good about probably 2023.”

This suggests a c-corp conversion is more likely than not and would reflect management’s desire to boost the stock price. ET’s stock price didn’t seem to react to a potential development that might be worth 5-10% to its price, and there were no follow-up questions. Alternatively, perhaps investors are wary of a conversion whose purpose must be to issue more equity so as to buy up assets. The ET management ethos can be characterized as prioritizing increased executive wealth over that of unitholders.

We have three funds that seek to profit from this environment:
Energy Mutual Fund

Energy ETF

Inflation Fund


Cost Overruns Plague Big Projects

Earnings continue to meet or modestly beat expectations. 4Q22 EBITDA at Enbridge of $3,911MM beat expectations by $16MM, or around 0.4%. The small margins between actual and expected at many companies highlight the visibility of their earnings.

Along with TC Energy, both companies have a long history of dividend growth — 28 years at Enbridge and 23 years at TC Energy. However, the two big Canadians represent a disproportionate share of the sector’s growth capex.  Costs for TC Energy’s Coastal GasLink project continue to spiral upwards, now C$14.5BN and more than double its initial forecast. The project’s value has been written down by C$3BN, and a further writedown is expected as additional funding is provided.

Although both Canadian firms are generally well regarded, we have maintained them at below-weight positions in our portfolios because of their extensive capex programs. We estimate that their 2021-23 capex is 38% of the sector’s, ahead of their 31% share of market cap. Enbridge expects EBITDA growth this year of 2.5-6.5%, and TC Energy 5-7%.

The problems with Coastal GasLink highlight the difficulty big construction projects face in North America. Labor is tight and environmental extremists are adept at using legal challenges to impose costly delays. Kinder Morgan executives must thank their good fortune at unloading the Trans Mountain Pipeline (TMX) project to the Canadian Federal government in 2018. After delays and cost overruns it’s now scheduled to be in service next year, costing C$21.4BN versus the C$12BN estimated when Canada bought it.

Our northern neighbor has long struggled to get its oil to market. TMX became embroiled in provincial politics, with liberal British Columbia unsympathetic to land-locked Alberta’s need to move its produced crude oil to the Pacific coast. The ill-fated Keystone XL was another failed effort to solve that problem by sending crude south.

.avia-image-container.av-4p9z77-d43a98d644a1575f028d12152b4cbd03 img.avia_image{ box-shadow:none; } .avia-image-container.av-4p9z77-d43a98d644a1575f028d12152b4cbd03 .av-image-caption-overlay-center{ color:#ffffff; }

Canadian natural gas also travels great distances to reach its market, a problem TC Energy’s Coastal GasLink is trying to solve. Tourmaline sends its gas 3,000 miles via pipeline from British Columbia to Cheniere’s LNG export facility at Corpus Christi, TX where it’s loaded onto LNG tankers. From there it supplies buyers in Europe and Asia at prices 10X the Canadian spot market.

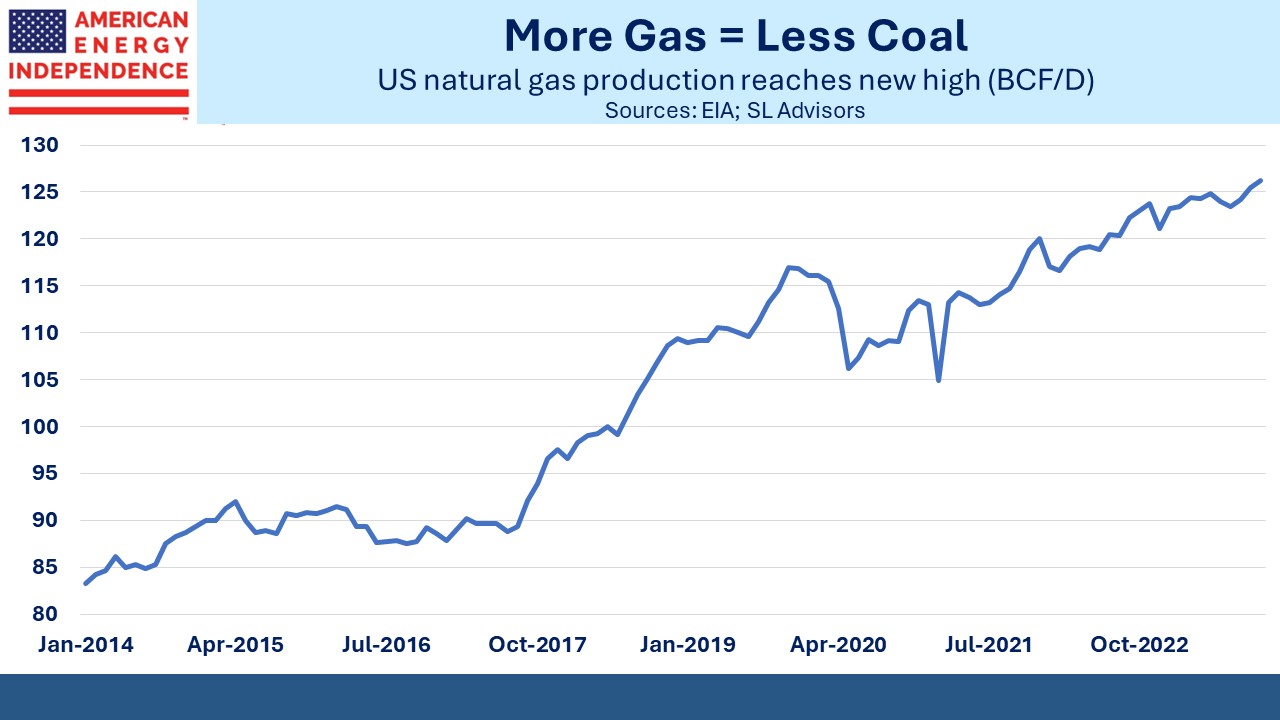
Coal to natural gas switching remains a powerful means of reducing CO2 emissions. Unfortunately, Pakistan just announced plans to quadruple coal-generated electricity and use less LNG because of high prices. Russia’s invasion of Ukraine turned Europe into a significant buyer of LNG, which has made it harder for poorer countries to use it. Pakistan is facing a balance of payments crisis and a debt default looms.

This illustrates that energy security and affordability are more important to developing nations than the energy transition. Some officials in India believe they’re more vulnerable to extreme weather events because of a warmer climate, such as the floods that destroyed neighboring Pakistan’s cotton crop last year. More likely is that these and other countries will raise living standards first and worry about emissions later, when they’re better able to absorb the higher costs of mitigation and low-carbon power. Obviously solar and wind aren’t cheaper, or Pakistan would be emphasizing them instead of coal.

In Germany a project to blend natural gas with green hydrogen in a 70/30 split has been running successfully since the fall.  Green hydrogen relies on solar or wind power to run the electrolysis that separates it from water. Utah’s Intermountain Power Project plans to supply southern California with a similar blend by 2025.

Plugging intermittent solar and wind into electrical grids creates instability, requiring battery back-up or natural gas peaker plants. Because it’s not always sunny and windy, 25-35% capacity utilization is the norm. Personally, I have no interest in weather-dependent power. But converting it into hydrogen nullifies the intermittency problem because electrolysis can run when weather permits without any disruption to customers.

Some regions still cling to the belief that everything can run on solar and wind. Eugene, OR, recently added itself to the list of unappealing places to live by banning gas hookups on new construction.

.avia-image-container.av-rnnmur-00d75802d453d38da5e859ff3f48d423 img.avia_image{ box-shadow:none; } .avia-image-container.av-rnnmur-00d75802d453d38da5e859ff3f48d423 .av-image-caption-overlay-center{ color:#ffffff; }

Remote work is expected to curb oil consumption by reducing commuting. Three years on from the outbreak of Covid, hybrid work is common with Fridays an especially popular day to work from home. 25 years traveling from NJ to New York City daily soon lost its appeal for me.

Goldman Sachs and JPMorgan, along with New York’s city government, all require their workers to be full-time in the office. The reality is different – JPMorgan is barely at 50% occupancy even in 383 Madison Avenue, the building they acquired when bailing out Bear Stearns in 2008 that is their de facto HQ while 270 Park Avenue is being rebuilt. JPMorgan CEO Jamie Dimon famously said, “people don’t like commuting, but so what.”

Americans are spreading out in this vast country, improving quality of life and perhaps even reducing emissions somewhat. Hybrid work is challenged to create a corporate culture and support creative teamwork, but it looks like a permanent change.

We have three funds that seek to profit from this environment:
Energy Mutual Fund

Energy ETF

Inflation Fund


The Pragmatic Energy Transition

The BP Statistical Review of World Energy used to be a fact-based compilation of useful data. Skimming through the 2016 version, it recounts what happened and comments on likely trends. In recent years it has unfortunately degenerated into a political document. The historic data remains useful, but its implausible forecasts are there to defend itself against woke climate cops accusing it of burning up the planet.

BP can point to its Net Zero and Accelerated scenarios which show global CO2 emissions immediately declining from 40 Gigatonnes (GT) to reach 9 and 4 GTs respectively by 2050. This shows they’re on board with global energy consumption dropping by a third or a fifth, at odds with over a hundred years of history. The emerging world’s insatiable desire to raise living standards and energy use will somehow be ameliorated by a dramatic increase in efficiency improvements. Nobody who has studied the issue takes this seriously.

.avia-image-container.av-2z0bkhs-914dba9d967e7001ba474ea432aa28a3 img.avia_image{ box-shadow:none; } .avia-image-container.av-2z0bkhs-914dba9d967e7001ba474ea432aa28a3 .av-image-caption-overlay-center{ color:#ffffff; }

If you accept that solar and wind are better for the environment, they are certainly not more efficient. They are much less energy dense which means they require more land. Long distance transmission lines move power from lightly populated areas where it’s produced to cities where it’s needed.  Batteries or natural gas power plants provide back up for weather-induced intermittency. More renewables means higher energy costs, possibly a price worth paying, and a choice made most clearly in western Europe.

.avia-image-container.av-8x9xxc-70fad770dc1c941991d25266355298b3 img.avia_image{ box-shadow:none; } .avia-image-container.av-8x9xxc-70fad770dc1c941991d25266355298b3 .av-image-caption-overlay-center{ color:#ffffff; }

BP can wave this document at the climate extremists who reject everything but solar and wind, to show that they are directionally aligned if not yet in the same place. Net Zero and Accelerated are climate sound bites.

But the executive summary then adds, “These scenarios are not predictions of what is likely to happen or what BP would like to happen.”

BP neither wants nor expects Net Zero or Accelerated? So why include them? It’s how big energy companies deflect their left-wing critics while delivering the energy the world needs in the form it wants, at considerable profit last year. What BP puts in its energy outlook doesn’t reflect its assumptions when investing capital, allowing them to act differently than they speak.

New Momentum, the third and only realistic scenario BP offers, is based on current trends and plausible policies. It’s the only one worth considering.

.avia-image-container.av-rlt6v4-90190f66fa6bd10463e52d19f3ce50f7 img.avia_image{ box-shadow:none; } .avia-image-container.av-rlt6v4-90190f66fa6bd10463e52d19f3ce50f7 .av-image-caption-overlay-center{ color:#ffffff; }

We think the world will reduce greenhouse gas emissions with cleaner energy (coal to gas switching), increased use of other forms of reliable energy (nuclear; hydrogen), carbon capture and new technologies such as additives for cattle feed (see How Seaweed Can Fight Global Warming).

Solar and wind will assuredly grow but don’t offer the reliable long term cash flows available in infrastructure. The reality of investment results caused BP to slow its planned reduction in fossil fuel production from 40% to 25% by 2030 amid disappointing returns on renewables. Shell plans to keep renewables at about 14% of capex, flat with last year.

.avia-image-container.av-1r3pzpc-267c35319f1f66ae0dcca92aa894f5d0 img.avia_image{ box-shadow:none; } .avia-image-container.av-1r3pzpc-267c35319f1f66ae0dcca92aa894f5d0 .av-image-caption-overlay-center{ color:#ffffff; }

Duke Energy is taking a $1.3BN impairment loss on the sale of its renewables business. Dominion Energy recorded a $1.5BN impairment on its unregulated solar business. Exxon has slashed funding for Viridos Inc, a company in La Jolla, CA that makes environmentally friendly fuels from algae. This initiative was once among Exxon’s highest profile in its Low Carbon Solutions unit. They now see better opportunities in carbon capture and hydrogen.

.avia-image-container.av-4182cg-c5b2ff36c0ca212f43fa053d0c890bc6 img.avia_image{ box-shadow:none; } .avia-image-container.av-4182cg-c5b2ff36c0ca212f43fa053d0c890bc6 .av-image-caption-overlay-center{ color:#ffffff; }

The outlook for practical climate change solutions is improving. Growth in natural gas trade will temper coal consumption and offers the world’s best chance to reduce emissions if emerging countries follow what the US has done. The Inflation Reduction Act increased the tax credits for carbon capture. This is causing much greater take-up than the Congressional Budget Office (CBO) forecast, so Credit Suisse believes the $3BN ten year cost the CBO originally forecast is likely to be over $50BN (see US Oil And Gas Production Growing).

.avia-image-container.av-kk8obk-356302382561015d79f0c8b13f02f262 img.avia_image{ box-shadow:none; } .avia-image-container.av-kk8obk-356302382561015d79f0c8b13f02f262 .av-image-caption-overlay-center{ color:#ffffff; }

Enbridge has 10-15 hydrogen projects underway in Ontario and Quebec. They’re developing a hydrogen and ammonia production/export facility near Corpus Christi, TX. Converting renewable energy into clean-burning liquids that can be transported via pipeline or ship to power plants seems more viable than a grid that’s overly dependent on sunny and windy weather. It pushes the intermittency problem back to a production facility, doesn’t rely on batteries or require extensive new transmission lines.

Midstream is transitioning beyond fossil fuel infrastructure to play a critical role in reducing emissions. The fear of stranded assets is receding in favor of repurposed assets that gain a longer useful life and a higher net present value.

We have three funds that seek to profit from this environment:

Energy Mutual Fund

Energy ETF

Inflation Fund


Pipelines Grow Into Lower Risk

Enterprise Products Partners’ (EPD) earnings release last week revealed that leverage (Debt:EBITDA) fell to 2.9X at the end of last year. They are now targeting 3.0X, down from 3.5X previously. This is among the lowest in the industry, and reflects a continuing trend to strengthen balance sheets, de-risking the businesses. Years ago, Kinder Morgan argued to rating agencies and investors that their diverse asset footprint justified a 5.5X debt multiple. Poor capital allocation (see Will Kinder Morgan Cover Its Cost Of Capital?) led to distribution cuts and KMI has since fallen in line.

Also cheering for investors is that higher EBITDA has been the main driver of the lower risk profile. Growth is creating stronger balance sheets.

JPMorgan estimates that average leverage at big US pipeline corporations and MLPs this year will average 3.5X. Canadians Enbridge (ENB) and TC Energy (TRP) push this figure higher. ENB’s business includes gas distribution with regulated rates and is generally perceived as less risky.

.avia-image-container.av-1ctz1s6-340de56d823966f1dd585450379d54c2 img.avia_image{ box-shadow:none; } .avia-image-container.av-1ctz1s6-340de56d823966f1dd585450379d54c2 .av-image-caption-overlay-center{ color:#ffffff; }

The International Energy Agency recently forecast continued demand growth for global supplies of LNG.

News from the energy patch has been uniformly good in recent weeks, led by strong earnings but supplemented by greater realism about energy security and its impact on the energy transition. Emerging economies, especially in Asia, are growing and how they provide increasing energy to their upwardly mobile populations will determine the path for CO2 emissions.

.avia-image-container.av-lmgpc6-2019ea848bba711fbf17b96351adf5a1 img.avia_image{ box-shadow:none; } .avia-image-container.av-lmgpc6-2019ea848bba711fbf17b96351adf5a1 .av-image-caption-overlay-center{ color:#ffffff; }

The US shift from coal to cleaner-burning natural gas for power generation is a great success story in reducing global Green House Gases (GHGs). India is providing encouraging signs of emulating this, with its biggest LNG importer looking to add an additional 12 million Metric Tonnes per year under long term contracts.

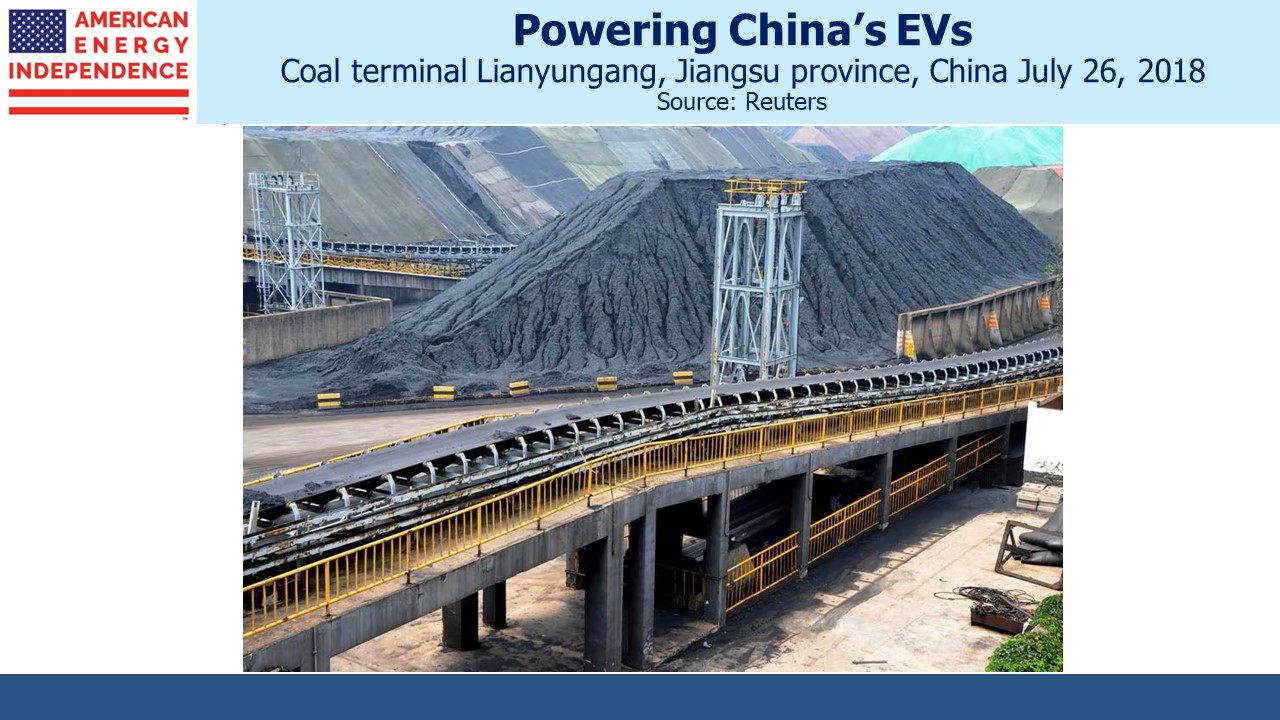
Asia-ex Japan burns vast quantities of coal for power generation. The Asia Pacific region consumes an astonishing 80% of the world’s coal output. China is in a league of its own, burning more than the rest of the world combined. India is a distant second at 12% of global demand. PM Narendra Modri  recently said he wants natural gas to provide 15% of India’s power by 2030, up from 6% today.

Poorer countries following the US lead in relying more heavily on natural gas to produce electricity offer our best chance of curbing emissions. It won’t be done with only solar and wind.

South Korea is recognizing the shortcoming of intermittent, weather dependent energy. They’re now planning for nuclear to meet a third of their power needs by 2030, up from 24% in their prior forecast. Renewables have been downgraded from 30% to under 22%. In countries with growing energy needs, reliability is a priority.

Exxon and Chevron both reported record profits recently. BP just followed suit, and now plans to increase its spending on oil and gas production although they’re still targeting a production cut of 25% by 2030 (previously 40%). This follows earlier reports that investments in renewables are delivering disappointing returns, leading to less emphasis on ESG goals. BP’s capex decisions are now guided by a long-term price target for Brent crude of $70 per barrel, up from $60 previously.

Siemens Energy is an example of the low returns in windpower, having recently announced a 4Q22 loss of €598MM due to quality issues on installed wind turbines. Siemens is planning to raise €1.5BN in additional equity to shore up its balance sheet.

ESG-driven capital allocation doesn’t assure profits.

Asian urgency around securing long term commitments of LNG supplies contrasts with Europe. Buyers are fearful that signing 20-year deals typically required by suppliers to ensure an adequate return on infrastructure investments will conflict with government regulations on hydrocarbon use. The EU is the region most willing to impose higher costs and inconvenience on their population in pursuit of reduced emissions.

Carbon capture is also growing in Europe. Denmark just approved a project that will by 2030 inject up to 8 million metric tonnes a year of CO2 into depleted oil and gas formations under the North Sea. Returning carbon in the form of CO2 underground into the formations it left as hydrocarbons has a certain logic to it. We noted a similar virtuous loop in Enlink’s plan to transport CO2 in south Texas from a petrochemical plant for eventual storage in the Eagle Ford (see Putting Carbon Back In The Ground).

Energy companies are showing they’re critical to providing secure energy with reduced emissions. It seemed improbable just three years ago, but the sector is having a good energy transition.

We have three funds that seek to profit from this environment:
Energy Mutual Fund

Energy ETF

Inflation Fund


More Than A Fiscal Agent

Wednesday’s soothing words on inflation from Fed chair Jay Powell seemed a distant memory after Friday’s blockbuster employment report. The market liked hearing that , “…the disinflationary process has started.” More relevant now is his warning that, “The historical record cautions strongly against prematurely loosening policy.” Investors are Confronting Asymmetric Risks, as we noted on Wednesday.

Lost among the inflation questions was Powell’s reminder that the Federal Reserve is Treasury’s “fiscal agent.” This was in response to a question about the debt ceiling and whether the Fed had done its own “analysis of any legal constraints” that might impede or affect its actions during the fiscal brinkmanship that would accompany a stand-off over raising the debt ceiling.

A refusal by Congress to authorize more borrowing is a crisis of its own making, a rare but significant error in the US constitution. Whenever Congress approves spending it’s axiomatic that includes the intent and ability to pay for it, through taxes, borrowing or asset sales. The debt limit should be raised by whatever’s necessary to fund spending that’s been approved. The refusal by Congress to treat the two issues as one may one day lead us all off a fiscal cliff led by miscalculating innumerate Tea Party Republicans.

.avia-image-container.av-1z8iyzc-cc78ea767b8fed8407581c12fcbc28a3 img.avia_image{ box-shadow:none; } .avia-image-container.av-1z8iyzc-cc78ea767b8fed8407581c12fcbc28a3 .av-image-caption-overlay-center{ color:#ffffff; }

The Fed is much more than Treasury’s fiscal agent. They are the biggest holder of US government debt ($5.4TN), a position they’re unlikely to exit in the foreseeable future. In total, central banks own $8.3TN is US debt, almost 40% of the total. When long term bond yields stubbornly fail to rise to levels that might induce purchases from a return-oriented investor, it’s because the biggest holders have non-commercial objectives. Foreign central bank holdings have been stable in absolute terms but falling as a percentage of debt outstanding because, well, there’s a lot more debt.

.avia-image-container.av-5oxuag-5d63168381c85de1a36aba5a42e99543 img.avia_image{ box-shadow:none; } .avia-image-container.av-5oxuag-5d63168381c85de1a36aba5a42e99543 .av-image-caption-overlay-center{ color:#ffffff; }

Warnings of US fiscal catastrophe have been around for at least as long as my 43-year career. A perpetual trade deficit creates lots of dollars needing a home, and a fiscal deficit creates lots of debt seeking buyers. It is to the benefit of US taxpayers that this benign symmetry has resulted in persistent demand for treasuries. We should hope it continues.

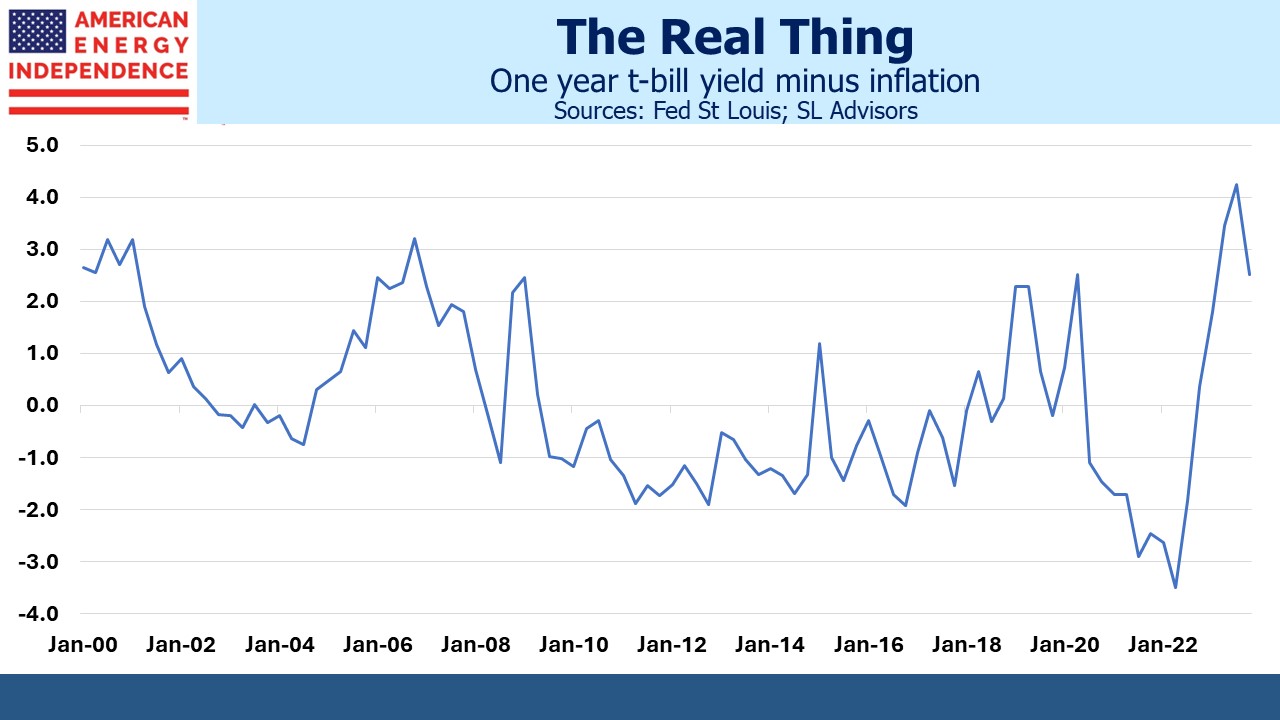
Low or negative real yields are the savior of profligate governments. Elevated inflation has temporarily slashed the real cost of financing our debt. Fed policy has been to ensure such a benefit is fleeting. 2% inflation is not the optimal policy for our fiscal outlook, and positive real rates won’t help. The only time in living memory when there was political consensus to improve our fiscal balance was in the early 1990s when ten year notes yielded as high as 8%. Since then, the tangible costs of profligacy have receded, along with any political gain to be had from tackling it.

The Congressional Budget Office (CBO) publishes extensive information on our fiscal future complete with charts and figures that leave little room for optimism. A couple of years ago we noted the surprisingly low cost of financing in their projections (see Inflation – Back By Popular Demand).

.avia-image-container.av-1byu2u0-ae75e1749f7a01b238f4162c48422716 img.avia_image{ box-shadow:none; } .avia-image-container.av-1byu2u0-ae75e1749f7a01b238f4162c48422716 .av-image-caption-overlay-center{ color:#ffffff; }

In subsequent revisions, the real cost of financing has moved up by almost 1% over the next decade. The CBO’s long term inflation outlook is unchanged, but by last July tighter monetary policy had raised the cost of new debt issuance above what the CBO was forecasting in 2021. It’s likely that the next long term budget outlook from the CBO will project even higher real rates.

The Federal Reserve has considerable influence on fiscal policy because of Quantitative Easing (QE), although Jay Powell would prefer not to concede this. Because QE keeps bond yields lower than they would otherwise be, it dampens the concern about fiscal profligacy that the market would otherwise communicate. The CBO and numerous private forecasts are out there for all to see, but QE constrains the urgency. It’s doubtful that we would have had a balanced budget in the 1990s (albeit for one year) if QE had been employed then.

.avia-image-container.av-vb6ac8-9e3f665ddc9c8743c644edfd02adb9a9 img.avia_image{ box-shadow:none; } .avia-image-container.av-vb6ac8-9e3f665ddc9c8743c644edfd02adb9a9 .av-image-caption-overlay-center{ color:#ffffff; }

Monetary policy also directly impacts the cost of issuing new debt. The average interest rate paid by the US government has risen quite sharply in the past year. The longer tight policy is required, the worse our fiscal outlook will become. The Fed will continue to pursue their dual mandate, but a graceful exit from QE is probably necessary to generate serious concern about skyrocketing Debt:GDP. Legislating limits on QE would help but is unlikely.

Higher inflation is the only long-term solution to our slowly developing fiscal catastrophe. It’s hard to keep real rates negative when inflation is only 2%. This is why we’re invested in the energy sector.

We have three funds that seek to profit from this environment:

Energy Mutual Fund

Energy ETF

Inflation Fund


Confronting Asymmetric Risks

The Fed’s mid-week policy meeting will punctuate a busy earnings week. Sell-side analysts continue to ratchet down earnings forecasts. Factset reports bottom-up 2023 earnings expectations of $226, down over 10% compared with last spring when Fed tightening started to have an impact.

Energy continues to be a bright spot, providing positive surprises in 4Q earnings released so far. Companies continue to return capital to shareholders. Chevron tripled its planned buybacks to $75BN over the next five years, drawing more economically illiterate criticism from the White House for not plowing this money into increased production. Incoherent energy policies and fair-weather friendship aren’t inducing Chevron CEO Mike Wirth and other energy executives to alter their capital allocation.

.avia-image-container.av-2izvojs-857aff91030ca8c047bbf15e2c47ef24 img.avia_image{ box-shadow:none; } .avia-image-container.av-2izvojs-857aff91030ca8c047bbf15e2c47ef24 .av-image-caption-overlay-center{ color:#ffffff; }

The broad equity market isn’t cheap, based on the Equity Risk Premium (ERP). Stocks are vulnerable to higher interest rates. Fed funds futures project a peak in Fed policy this summer with rates coming down later this year. By contrast, the FOMC Summary of Economic Projections (SEP) released on December 14 pushes that scenario back around a year.

.avia-image-container.av-23hlilk-6424b69956d96601bd33ac36e86acd06 img.avia_image{ box-shadow:none; } .avia-image-container.av-23hlilk-6424b69956d96601bd33ac36e86acd06 .av-image-caption-overlay-center{ color:#ffffff; }

Fed funds futures six to twelve months out differ as much as 1% from the FOMC. Data since the last SEP has been on balance slightly weaker. So a surprising move in futures to more closely align the two would leave the stock market vulnerable, especially given the trend towards weaker earnings forecasts.

Morgan Stanley strategist Michael Wilson is cautious because of the Fed outlook, although Robert Kad, who heads up their MLP and Energy Infrastructure research, is gloriously bullish on his sector.

Midstream energy infrastructure should be resilient to higher rates. Yields of 5-6% are already attractive, but more important is the embedded inflation hedge that is in many pipeline tariffs. Inflation expectations remain low considering recent history. Risk here is also skewed to the upside. Wells Fargo has estimated that half the industry’s EBITDA is linked to inflation protected contracts.

.avia-image-container.av-1j4zmq0-d55b2c8fbd808d1072e527db3dd44297 img.avia_image{ box-shadow:none; } .avia-image-container.av-1j4zmq0-d55b2c8fbd808d1072e527db3dd44297 .av-image-caption-overlay-center{ color:#ffffff; }

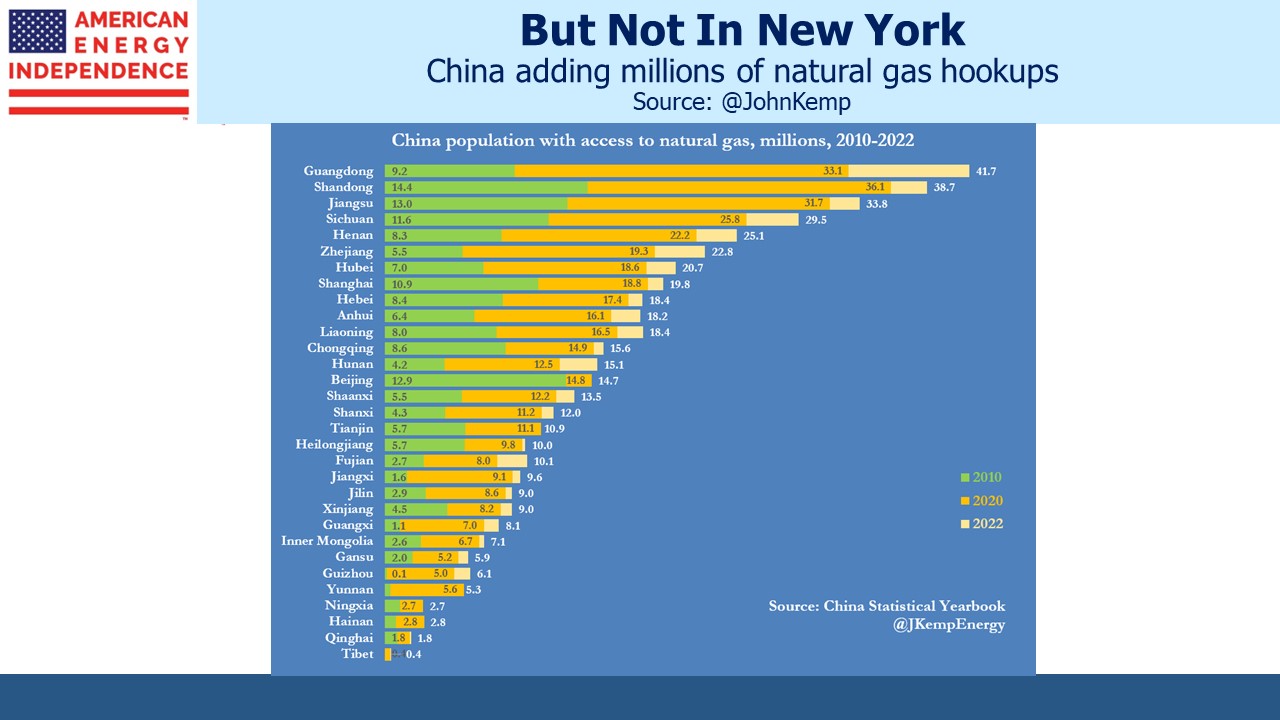
European demand for LNG imports jumped last year, but over the long-term emerging economies are likely to grow consumption. The Gas Exporting Countries Forum expects natural gas to increase market share from 23% to 26% by 2050 while global energy demand increases at 0.7% pa. Thanks to Stephen Stapczynski of Bloomberg for pointing this out.

.avia-image-container.av-w5h90o-69f2b18752f60ebfe0f55c24e1535aa8 img.avia_image{ box-shadow:none; } .avia-image-container.av-w5h90o-69f2b18752f60ebfe0f55c24e1535aa8 .av-image-caption-overlay-center{ color:#ffffff; }

The University of Michigan consumer survey revealed the uncertainty consumers have about the inflation outlook. Although households expect it to return to 2% based upon the average of responses, the range of expectations is the highest it’s been since the 1980s. The difference between the 25th and 75th percentiles for 5-10 year inflation is 4%. Over the next year it’s 8%. There’s not high confidence that it’s returning to 2%.

Benign inflation forecasts, which are similar in the bond market, represent asymmetric risk. Inflation isn’t going to trend below 2%. Retirement planning should be based on 3% and scenarios should be run with higher rates to test how well an investment portfolio will meet one’s spending needs. There are several reasons why conventionally reported inflation figures aren’t a good basis on which to plan growth in living expenses (see Why You Can’t Trust Reported Inflation Numbers). The most obvious is the hedonic quality adjustments that are routinely applied to the CPI to reflect improvements in quality. CPI tries to measure a basket of goods and services of constant utility. Quality improvement at the same price is treated as a price cut.

Hedonic quality adjustments are made to a wide range of products such as clothing, electronic goods and housing. The problem this creates for a consumer is that if a jacket, iPhone or rental property provides better quality at the same price, you don’t have any money left over even though your utility has risen. If you plan on replacing your iPhone regularly in retirement, it’s going to cost you more even though the Bureau of Labor Statistics calculates iPhones are cheaper (because they’re better).

.avia-image-container.av-tyngiw-1979157548d253dbad7f8d7982f3813d img.avia_image{ box-shadow:none; } .avia-image-container.av-tyngiw-1979157548d253dbad7f8d7982f3813d .av-image-caption-overlay-center{ color:#ffffff; }

Returning to the ERP – based on the past two decades, the S&P500 is somewhat expensive compared with bonds. Low inflation expectations and optimistic futures create asymmetric upside risk to interest rates, and downside risk to earnings, forecasts for which are trending lower. Both leave stocks vulnerable.

For now, Factset bottom-up earnings for 2023 is for 3% growth over 2022. Flat earnings and ten-year yields back to 4% where they were in November would require a 15% drop in the S&P500 before the ERP was back to its two-decade average. We’re not selling stocks for long-term investors, but the risk asymmetry suggests little need to rush purchases.

We have three funds that seek to profit from this environment:
Energy Mutual Fund

Energy ETF

Inflation Fund


Energy Transfer’s Distribution Management

Last week Energy Transfer (ET) raised their quarterly distribution to $0.305, restoring it to a level last paid in July 2020. This cheered a great many people. Among the financial advisors we talk to it is the most widely held individual name. It is perennially cheap. JPMorgan, Morgan Stanley and (according to Refinitiv) 94% of sell side analysts list ET as Overweight.

Following the distribution hike, up 75% year-on-year, ET yields 9.1%. It remains the cheapest big MLP with a 2023 Distributable Cash Flow (DCF) yield of 18%. Under the old MLP standard that prevailed prior to the shale investment bust, 90% of DCF was commonly paid in distributions. Following the hike, their payout ratio is a parsimonious 50%. Like a great performer, ET leaves its audience hoping for more.

Co-CEOs Marshall McCrea and Tom Long retain the deft touch of former CEO (now Executive chairman) Kelcy Warren. ET executes well but always prioritizes management’s interests. Search results on our blog reveal they’re mentioned in 141 separate posts. Enbridge is 54.

.avia-image-container.av-1ngx21q-37adfedc240e4d2393c1a75f8456f86e img.avia_image{ box-shadow:none; } .avia-image-container.av-1ngx21q-37adfedc240e4d2393c1a75f8456f86e .av-image-caption-overlay-center{ color:#ffffff; }

In 2016 Energy Transfer Equity (ETE), the entity that ultimately became ET, issued a lucrative class of convertible preferred securities to insiders on the management team (see Is Energy Transfer Quietly Fleecing its Investors?). These securities allowed reinvestment of preferred dividends at $6.56 even if the prevailing unit prices was higher which it always was. This attractive feature was denied to other investors which led to a class action lawsuit. We wondered aloud, Will Energy Transfer Act with Integrity? ET answered by arguing that their maneuver had allowed them to preserve their distribution, winning the case.

ETE was once the General Partner (GP) of MLPs Sunoco Logistics, Energy Transfer Partners and Regency Partners. Through a series of mergers culminating with being absorbed by ETE in 2018, all these LP unitholders endured substantial distribution cuts while ETE’s was preserved (see Energy Transfer: Cutting Your Payout, Not Mine). Management’s investment in Energy Transfer was overwhelmingly in the GP, ETE. We made our investment there to assure the best possible alignment of interests. Notwithstanding the legal case argued in Delaware Chancery by ETE in defense of its indefensible preferreds, many investors in the Energy Transfer family have endured payout cuts.

.avia-image-container.av-1didtjy-95872730d9464cd0c1a30612fcd02153 img.avia_image{ box-shadow:none; } .avia-image-container.av-1didtjy-95872730d9464cd0c1a30612fcd02153 .av-image-caption-overlay-center{ color:#ffffff; }

ET, the surviving entity having absorbed all its MLPs, cut its distribution in late 2020. Investor skepticism about the payout had driven the yield to 18%. Covid-led demand destruction, albeit brief, didn’t help. With no reward in the stock price for such largesse and facing rating agency pressure because of its 5X Debt:EBITDA leverage, the company decided it had better uses for available cash than paying ungrateful unitholders (see Why Energy Transfer Cut Their Distribution). This 50% cut meant long-time investors in Sunoco Logistics, Energy Transfer Partners and Regency Partners had endured cuts of 66%, 72% and 76% respectively since being combined with the parent.

.avia-image-container.av-rnlhmm-f587888ec64dd925b87025d9521907e0 img.avia_image{ box-shadow:none; } .avia-image-container.av-rnlhmm-f587888ec64dd925b87025d9521907e0 .av-image-caption-overlay-center{ color:#ffffff; }

Following last week’s distribution hike ET still trades at a meaningful discount to other large MLPs Enterprise Products Partners (EPD) and Magellan Midstream (MMP). We retain a full position for this reason, but always with a self-protective wariness. ET’s history does not induce the comfort of straight dealing that, say, Jim Teague of EPD provides to their investors.

In 2019 Blackstone acquired the 56% of Tallgrass Energy it didn’t already own via a transaction that paid a substantial premium for management’s units versus the lower one paid to everyone else (see Blackstone and Tallgrass Further Discredit the MLP Model). Perhaps ET’s $41BN market cap makes it too big for such a coup. But you know that if they could do it, they would.

ET’s diverse and well positioned midstream assets, which are largely supported with fee-based contracts offer attractive upside. Their Lake Charles LNG project will add exposure to growing global demand for US natural gas.

LNG import terminals allow for diverse sources. As Germany has learned, if your energy comes via a pipeline you’re locked into a long-term relationship with the supplier. European LNG demand is growing but Asia remains the biggest market. The Philippines expects to increase imports as their Malampaya gas field in the South China Sea winds down. The government just approved construction of a seventh import facility.

The slide in US natural gas prices is due to our mild winter. The Freeport LNG export unit is coming back on line, which will create some additional demand. Cheap US gas will stimulate additional demand for US exports, which will eventually support domestic prices. Curbing US households’ use of gas stoves never looked like a serious proposition, but in any event will not alter the growth in long-term demand.

We have three funds that seek to profit from this environment:
Energy Mutual Fund

Energy ETF

Inflation Fund


Behind Soft Natural Gas Prices

Most of the commodity questions we get relate to crude oil, since its price reflects energy investor sentiment and can move midstream prices. When oil and pipelines are down, people want to know why the volume dependency of midstream cashflows isn’t visible in stock price performance. The correlation between the two is unstable (see Energy’s Asynchronous Marriage).

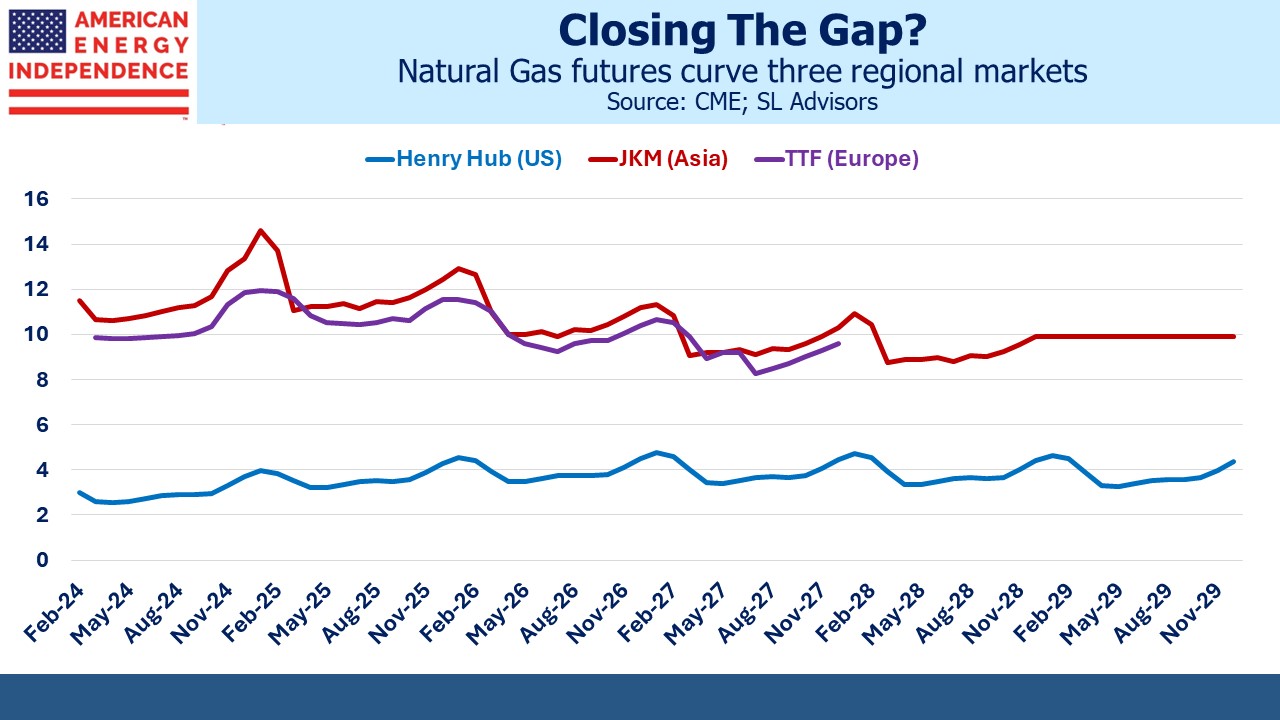
Pipelines are even less correlated with natural gas. This is partly because there are enormous global price disparities. US LNG exports are growing but still constrained by insufficient liquefaction capacity to satisfy global demand. Hence US natural gas prices are far lower than European and Asian benchmarks.

.avia-image-container.av-3fw4zws-42791bb6bc8758b8a003b620bf4ee515 img.avia_image{ box-shadow:none; } .avia-image-container.av-3fw4zws-42791bb6bc8758b8a003b620bf4ee515 .av-image-caption-overlay-center{ color:#ffffff; }

Gas prices have been sliding in recent weeks, confounding some who think Europe’s pivot away from Russian pipeline exports should create immediate incremental demand. The main reason is weather. Just before Christmas the US experienced a cold snap which boosted domestic demand, but since then it’s been a relatively mild winter. The same has been true in Europe, where fears that rationing might be required before winter’s end are receding.

.avia-image-container.av-34vog6k-30eef51f5782488bc48c70e008b08aeb img.avia_image{ box-shadow:none; } .avia-image-container.av-34vog6k-30eef51f5782488bc48c70e008b08aeb .av-image-caption-overlay-center{ color:#ffffff; }

Most of the US has seen milder weather as defined by Heating Degree Days (the average of the day’s high and low subtracted from 65, or 0 if negative). Only the Rocky Mountains and west coast have been different. California’s relentless rain is being blamed by some on global warming, but it reaches the mountains as snow which I can personally attest is creating great skiing conditions.

.avia-image-container.av-2gcblxo-c0ce28af0f3452404b697dc9063b844c img.avia_image{ box-shadow:none; } .avia-image-container.av-2gcblxo-c0ce28af0f3452404b697dc9063b844c .av-image-caption-overlay-center{ color:#ffffff; }

The milder winter is curbing demand for natural gas, most clearly seen in the 17% drop in the residential and commercial category compared with a year ago. Exports are also less than forecast. The Freeport LNG plant is the 2nd biggest such facility in the US behind Cheniere’s Sabine Pass. Restarting operations there following the fire last June has also taken longer than expected, curbing demand for natural gas supplies to be converted into LNG. The company is sticking with its latest forecast that it’ll be back up by the end of January.

.avia-image-container.av-77w5e4-b0f2404c601b33be29c3e875f016984e img.avia_image{ box-shadow:none; } .avia-image-container.av-77w5e4-b0f2404c601b33be29c3e875f016984e .av-image-caption-overlay-center{ color:#ffffff; }

Looking ahead, LNG demand will assuredly grow and the weather will fluctuate. The Energy Information Administration’s Short Term Energy Outlook sees US LNG exports averaging 12.1 Billion Cubic Feet per Day (BCF/D) this year and 12.6 BCF/D in 2024. They did trim this year’s forecast modestly because of the delay in Freeport’s restart.

.avia-image-container.av-lpmass-a7cf9e1da959af5409d24fdafad8b51b img.avia_image{ box-shadow:none; } .avia-image-container.av-lpmass-a7cf9e1da959af5409d24fdafad8b51b .av-image-caption-overlay-center{ color:#ffffff; }

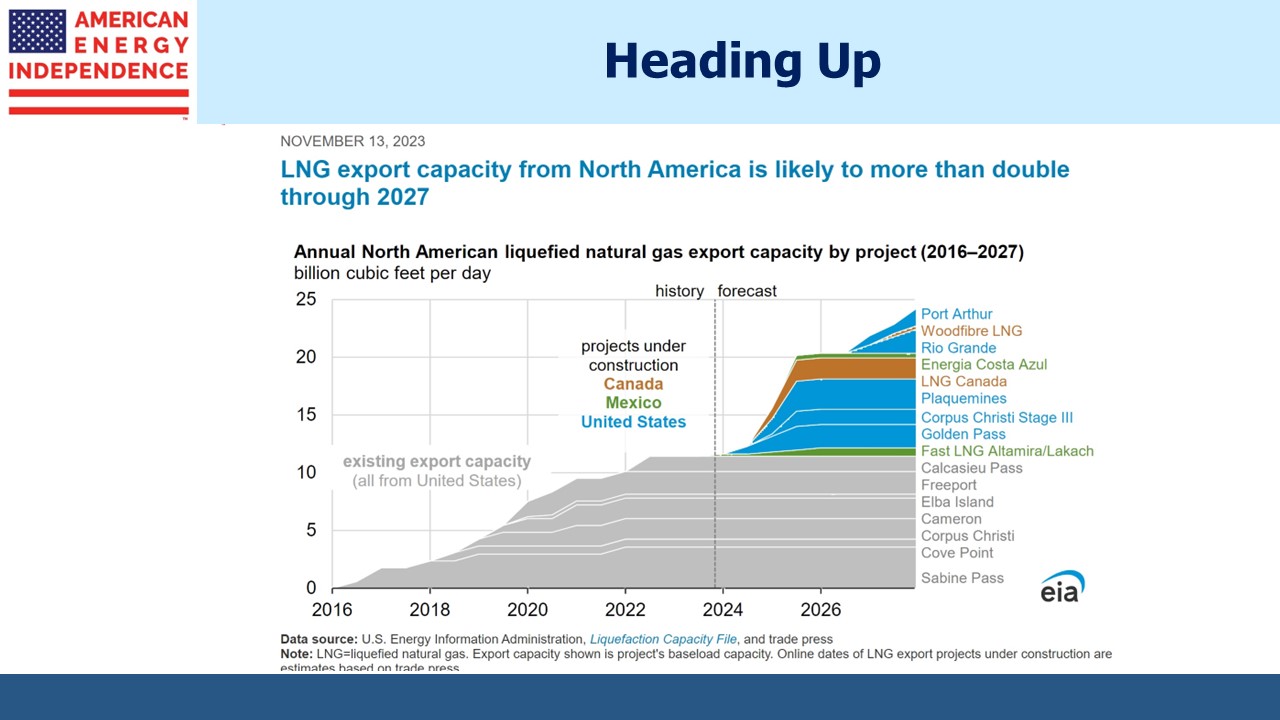
US LNG export capacity won’t grow significantly for another couple of years, but by 2030 will have almost doubled in a decade. This will help close the price gap between US natural gas and other global benchmarks, although even then LNG exports will represent less than 20% of domestic demand.

.avia-image-container.av-110teng-1cbfd68951953e1e0f8526e8c16244ec img.avia_image{ box-shadow:none; } .avia-image-container.av-110teng-1cbfd68951953e1e0f8526e8c16244ec .av-image-caption-overlay-center{ color:#ffffff; }

Australia vies with the US and Qatar for top LNG exporter. But LNG exports have become a political issue down under, because such a big portion of production is flowing overseas that it’s boosting domestic prices. In recent years Australia’s federal government has contemplated export curbs. These are vehemently opposed by the gas industry which argues they may be forced to violate contractual obligations. Partly as a result of political pressure, Australian LNG exports are expected to dip this year.

.avia-image-container.av-k1s8i4-3fa10c598f7e9a561fd5f38b6ad20d60 img.avia_image{ box-shadow:none; } .avia-image-container.av-k1s8i4-3fa10c598f7e9a561fd5f38b6ad20d60 .av-image-caption-overlay-center{ color:#ffffff; }

The Netherlands is also planning to curb exports, but for different reasons. Their Groningen gasfield, the largest in western Europe, has been widely linked with earthquakes. There have been up to 100 annually since 1980, ranging as high as magnitude 3.6. Several years ago tremors in Oklahoma were attributed to fracking, although blame was eventually pinned on improper wastewater disposal not the fracking itself.

But fracking is not used in Groningen, and it appears that the removal of natural gas itself destabilizes the ground. 160,000 damage claims have been submitted by residents of the area. The Dutch government has been promising to halt gas production there since 2018 and now sounds as if they will finally follow through.

The timing is awkward because Groningen borders Germany and supplies the northwest of the country. The EU pressed the Dutch to increase production following Russia’s invasion of Ukraine. Depending on Europe’s supplies Groningen may continue production until October 2024 but not beyond that.

Political pressure in Australia and the Netherlands will enhance the prospects for US LNG exports both to Europe and Asia.

Following Sunday’s blog critical of Kinder Morgan, some readers asked why we have any position in the company at all. We’ve been critical of their returns on invested capital for several years (see Kinder Morgan’s Slick Numeracy) and they’ve long been an underweight for us.

Today the company’s poor investment history is well known by analysts if not acknowledged by the board since they just elevated a long-time member of the management team and former CFO Kim Dang to CEO. We’ll look for signs of improvement. Their Enhanced Oil Recovery business (EOR) was an unwelcome source of EBITDA volatility, but with the Inflation Reduction Act increasing tax credits for CO2 capture including from EOR, there’s some chance for this segment to become more interesting.

We have three funds that seek to profit from this environment:
Energy Mutual Fund

Energy ETF

Inflation Fund


Will Kinder Morgan Cover Its Cost Of Capital?

Kinder Morgan (KMI) reported earnings last week and announced that President Kim Dang will be taking over from Steve Kean as CEO. This prompted us to look back over KMI’s history, which reflects some of the best and worst of the MLP sector for the past ten years.

A decade ago the shale revolution drove increased capex for upstream E&P companies as well as the midstream ones that service them. Prior to 2014 KMI operated as the General Partner (GP) to MLPs Kinder Morgan Partners (KMP) and El Paso Partners (EP). The GP-MLP structure always looked to us like the hedge fund manager-hedge fund relationship.

The GP (HF manager) calls the shots and the MLP (HF) does what it’s told with limited rights for the limited partners. The GP could and often did sell assets to its MLP (a “dropdown”), directing the MLP to issue equity and debt to pay for them. Or the GP could direct the MLP to build new infrastructure. The GP had Incentive Distribution Rights (IDRs) which operated like the carried interest taken by HF or private equity managers. It gave them a share of the profits with minimum capital at risk.

Back then we always invested in the GP rather than the MLP because, as with hedge fund managers, that’s where the big money gets made. Rich Kinder exploited his MLPs masterfully and became a billionaire in the process. However, by 2014 the increasing need of MLPs to raise ever more capital to finance infrastructure for the shale revolution was driving up yields, making raising equity capital more expensive.

.avia-image-container.av-113m56f-1f8c26b4990e54f6561eb4bec3b687db img.avia_image{ box-shadow:none; } .avia-image-container.av-113m56f-1f8c26b4990e54f6561eb4bec3b687db .av-image-caption-overlay-center{ color:#ffffff; }

Kinder was frustrated at KMP’s high cost of capital, so in August 2014 Kinder Morgan announced it was simplifying its structure and rolling its MLPs into KMI to create one single entity. We were moved to write enthusiastically about it (see Valuing Kinder Morgan in its New Structure).

Rich Kinder said at the time, “”We have vastly simplified the structure” and promised “modest cost synergies,” He also promised a $2 annual dividend growing at 10% for the next five years. Less than two years later it was slashed by 75% and still hasn’t recovered.

KMI began a trend to roll MLPs up into their GP parent, which was often a corporation. MLPs had attracted income-seeking, K-1 tolerant investors but the model broke when midstream companies followed their upstream clients into over-investing. Increased leverage led to distribution cuts, alienating the traditional income-seeking investor. The MLP structure has never recovered, and they now represent around a third of the sector. The Alerian MLP ETF remains as an anachronistic vehicle for those who only want MLP exposure and are content with a tax-inefficient structure (see AMLP Trips Up On Tax Complexity).

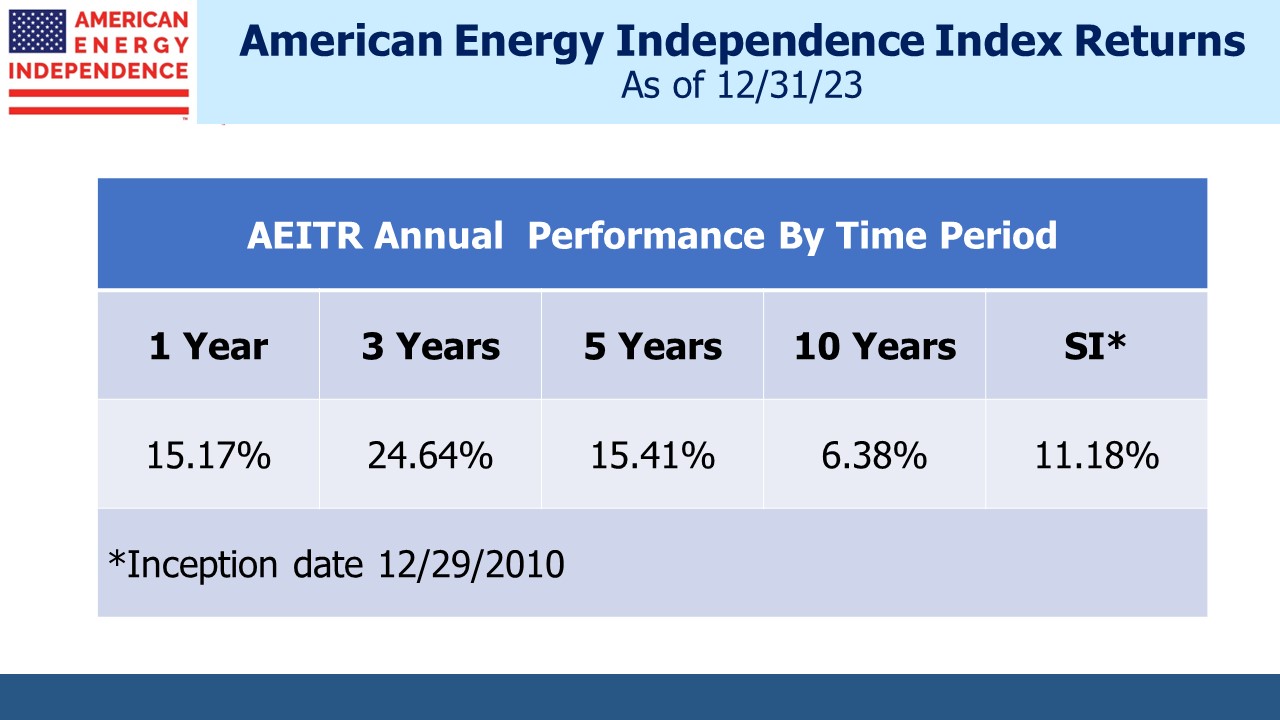
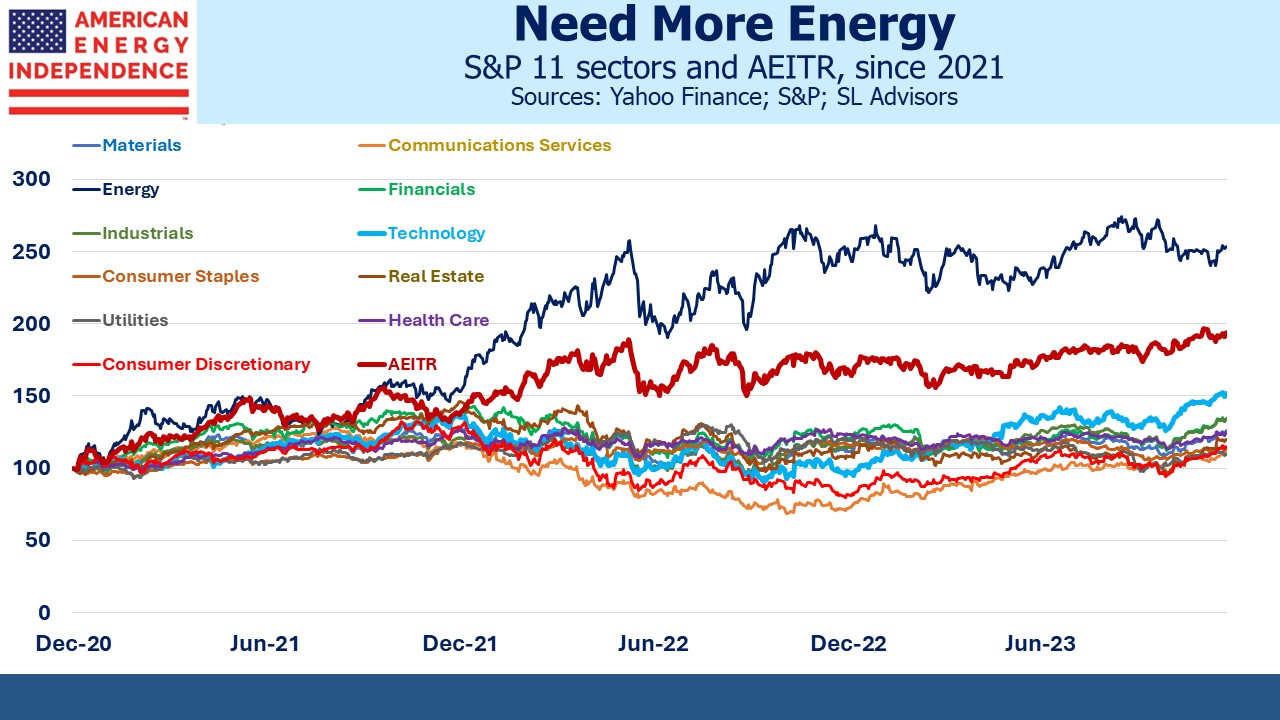
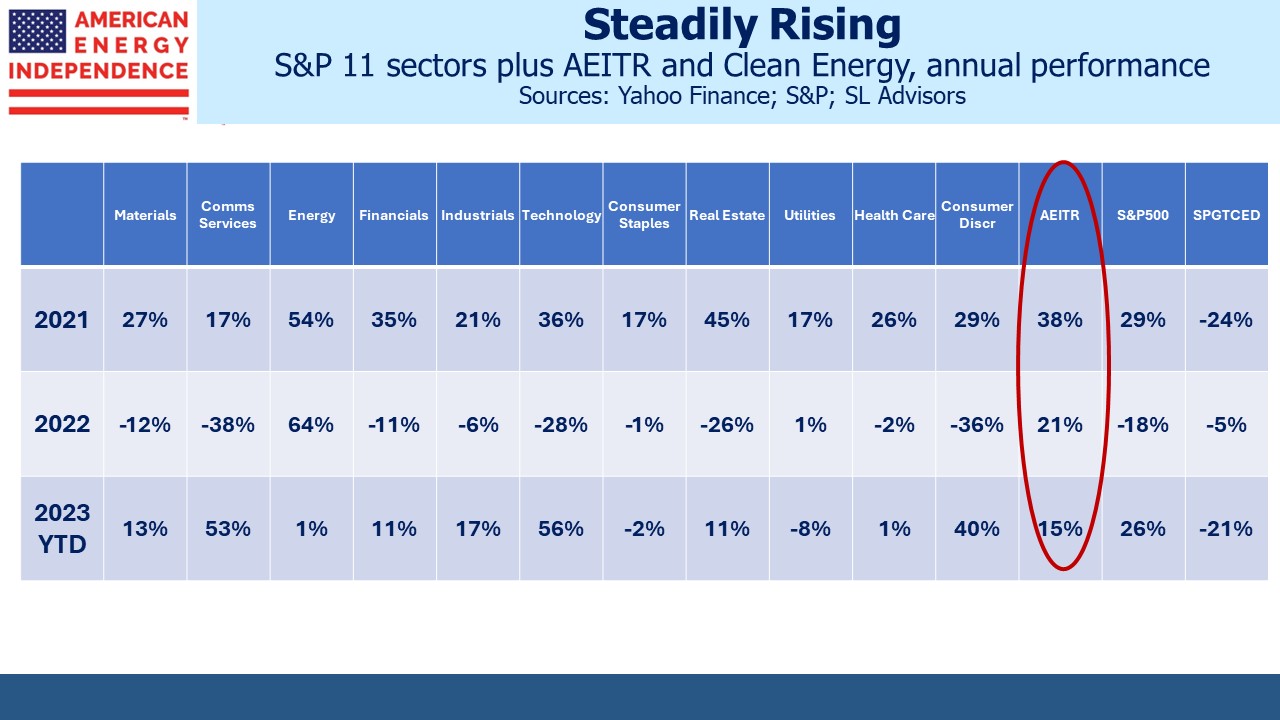
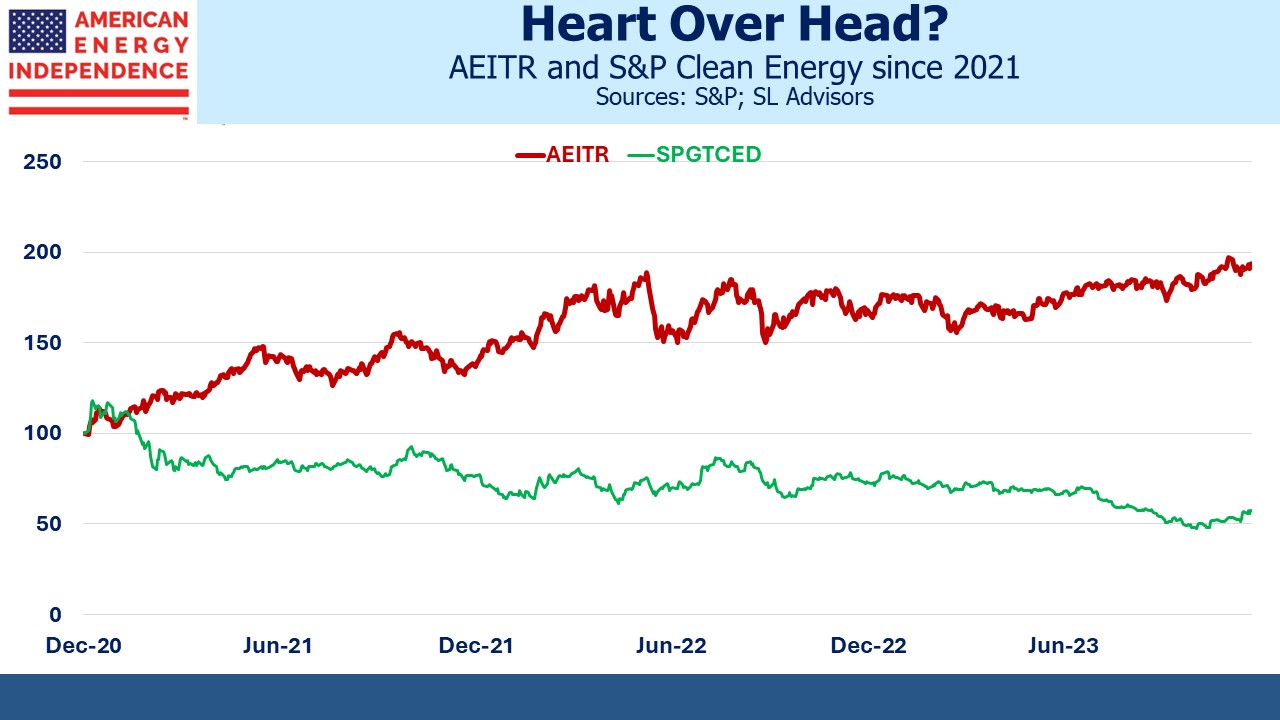
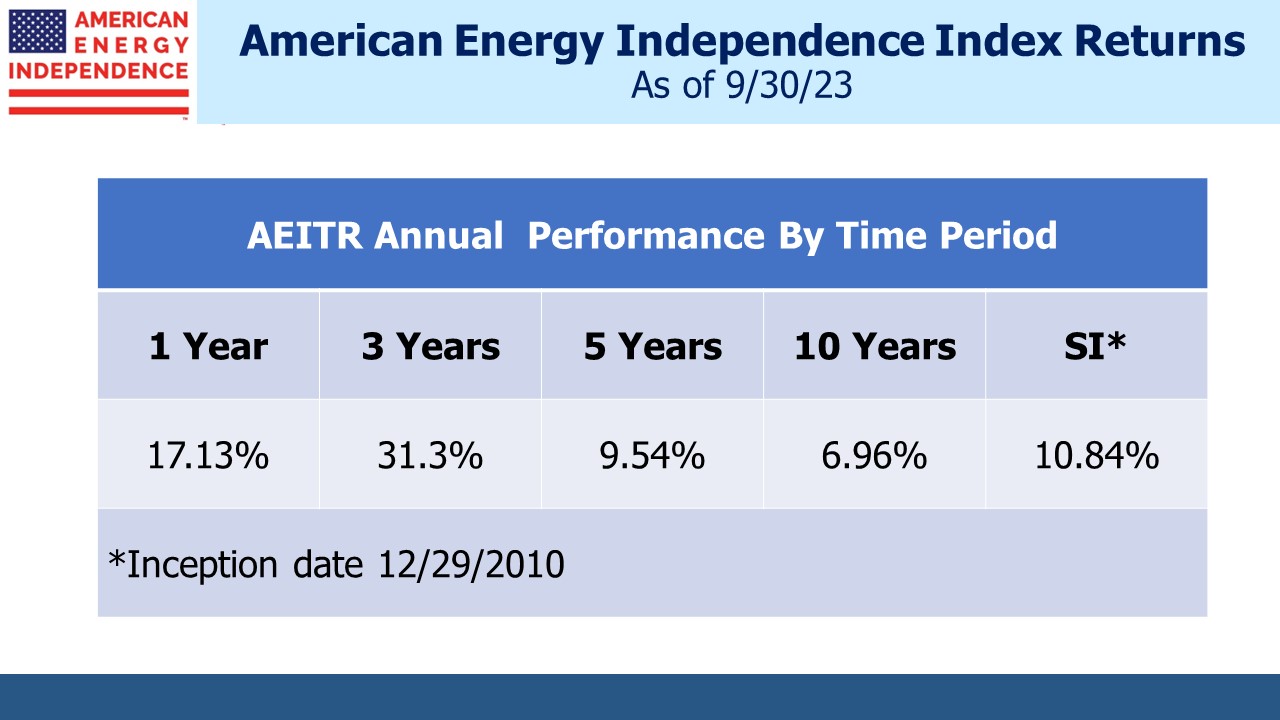
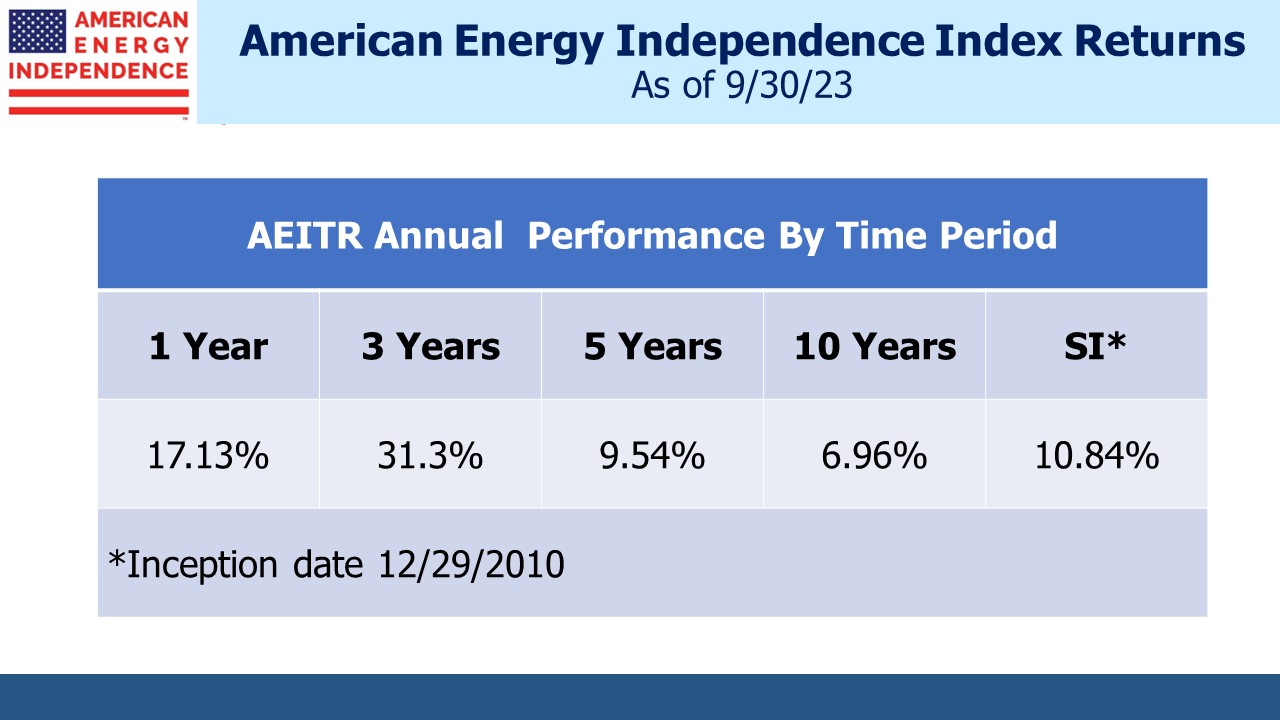
August 2014 was the peak in the energy sector for that cycle. Since then, KMI has generated a minus 2.9% annual return with dividends, lagging the sector, defined as the American Energy Independence Index (AEITR), which has generated 3.3% pa. KMI’s dividend is $1.11, still a long way from the $2 promised nine years ago.

.avia-image-container.av-26hdcn-e3937457af1e55fc97c22fc2b4c39e3a img.avia_image{ box-shadow:none; } .avia-image-container.av-26hdcn-e3937457af1e55fc97c22fc2b4c39e3a .av-image-caption-overlay-center{ color:#ffffff; }

KMI has a track record of investing in low return projects. Wells Fargo calculates that over the past five years KMI has earned a Cash Return On Investment (CROI) of only 4.4%, the lowest of any big company. Since 1999 they’ve earned 5.6% versus an industry median of 10.7%. KMI’s stock has lagged because they keep investing in projects that earn less than their cost of capital.

Rich Kinder ran the company during most of this period, and he’s misallocated his own capital as well as his investors’ because he’s still the biggest individual owner of KMI shares with around 11% of the company. His personal fortune is from understanding how to exploit the GP/MLP structure that used to exist, but he must think it’s from making good investments.

Which brings us to the new CEO Kim Dang. She became CFO in 2011 and has been part of the management team ever since. The low CROI projects substantially occurred on her watch. Did she internally oppose misdirected capital, or did she misestimate returns as much as Kinder? Neither explanation is good, and KMI’s pliant board of directors doesn’t seem too concerned about the company’s investment track record.

On KMI’s 4Q22 earnings call, Dang commented that, “A large part of my job is going to be about continuity.” Long-time investors may feel a twinge of nervousness at this prospect. An improvement on past performance is needed.

Encouragingly, KMI added $1BN to their buyback program. Given the stock’s poor performance for many years, this might be one of their best uses for excess capital.

We continue to own KMI but at a reduced size relative to its percentage of the sector’s market cap.

We have three funds that seek to profit from this environment:
Energy Mutual Fund

Energy ETF

Inflation Fund