Pipeline Buybacks and ESG Flexibility

Targa Resources, a perennial mis-allocator of capital, is not an obvious candidate to initiate a buyback program. Nonetheless they did on Monday, and the stock rose almost 11% on the news. In February last year, when Joe Bob Perkins was CEO, he responded to questions about their capex plans by arrogantly calling them “capital blessings.” This reflected an attitude that building new infrastructure and buying assets was part of their mission, regardless of whether such projects made financial sense.

TRGP’s stock performance says much about how they have allocated capital in recent years. It’s lost almost two thirds of its value over the past year, and 88% from its all-time high in 2014 when Energy Transfer was believed to be interested in acquiring them. Perkins remains with the company as Executive Chairman, having undelivered and been overpaid.

.avia-image-container.av-1y1035w-50584c4c63cf7a3b83bd8cd829a13a12 img.avia_image{ box-shadow:none; } .avia-image-container.av-1y1035w-50584c4c63cf7a3b83bd8cd829a13a12 .av-image-caption-overlay-center{ color:#ffffff; }

If the buyback reflects a new respect for the math behind how the company deploys its cash, it represents an overdue shift. TRGP is on track to begin generating Free Cash Flow (FCF) next year. Although buybacks allow plenty of discretion around timing, the market welcomed the announcement that $500MM would be dedicated to repurchasing stock.

TRGP’s buyback program is roughly equal to their expected 2021 FCF, so they’re to complete the program quickly. But it’s worth noting that, if the industry similarly dedicated its 2021 FCF to buybacks, that would amount to $40BN in purchases, twice the size of all the mutual funds, closed end funds and ETFs in the sector. There’s much more FCF available than what’s at TRGP.

.avia-image-container.av-kfeysk-40bcc85882902f8e731c78a0ec46257d img.avia_image{ box-shadow:none; } .avia-image-container.av-kfeysk-40bcc85882902f8e731c78a0ec46257d .av-image-caption-overlay-center{ color:#ffffff; }

In another sign that the MLP structure retains few friends, TC Energy (TRP) announced they’d be buying in the rest of TC Pipelines (TCP) that they don’t already own. With a 9% yield and limited investor base, TCP isn’t much use as a source of capital. It’s down 23% over the past year, whereas TRP has dropped 15%. Without a ready pool of K-1 tolerant income-seeking buyers, TRP concluded there was little value in maintaining their MLP.

Both TRGP and TRP are buying their own securities, which they deem undervalued. This is positive news.  As more of the industry follows suit, it will provide further support for a beaten-down sector.

On a different topic, Jared Dillian wrote an informative article (see ESG Investing Looks Like Just Another Stock Bubble) highlighting how much of the interest in ESG investing is a fad. Picking companies that possess good ethical values seems pretty reasonable – except that the beauty of ESG lies in the beholder. Because there are no agreed criteria, just about every company can claim such credentials, and most do. For example, coal producer Peabody Energy publishes an ESG report.

.avia-image-container.av-1pn1150-4ab84b921c6e1d05d88100c2aabba3f7 img.avia_image{ box-shadow:none; } .avia-image-container.av-1pn1150-4ab84b921c6e1d05d88100c2aabba3f7 .av-image-caption-overlay-center{ color:#ffffff; }

Dillian notes that much of the returns to ESG investing have been driven by liquidity. Inflows have surged over the past year, with Morningstar estimating almost $200BN invested in ESG funds.

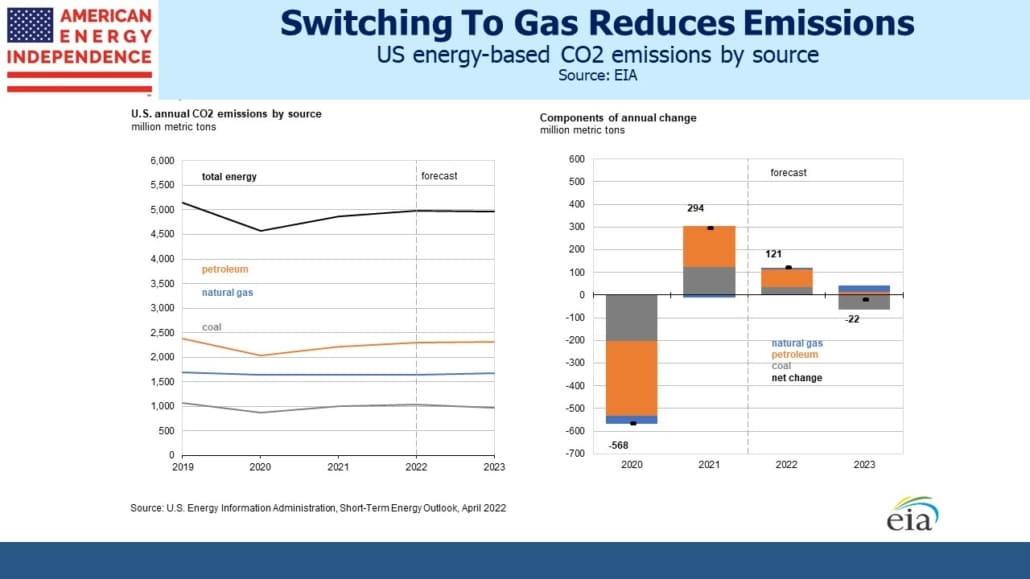
Given the numbers involved, few companies can risk being non-ESG. Pipeline corporations are included (watch ESG Investors Like Pipelines), as they should be since increased use of natural gas is replacing coal in power generation. This is the biggest driver of reduced emissions in the U.S.

Confusingly, this means that Williams Companies’ (WMB) ESG credentials are based on successfully reducing demand for Peabody’s product.

MLPs generally don’t show up in ESG lists, because their weak governance (the “G” in ESG) disqualifies them.

.avia-image-container.av-ns9ylg-642d97e8ddbb6d81b19654ff3e636ccb img.avia_image{ box-shadow:none; } .avia-image-container.av-ns9ylg-642d97e8ddbb6d81b19654ff3e636ccb .av-image-caption-overlay-center{ color:#ffffff; }

The infinite flexibility of ESG is shown by Lockheed Martin’s (LMT) regular inclusion in the Dow Jones Sustainability Index. Manufacturing products that blow people up sustainably meets the threshold. This is why Jared Dillian is right to say, “…ESG is nothing but a passing investment fad.”

We are invested in LMT and all the components of the American Energy Independence Index via the ETF that seeks to track its performance.


Devon Shows Occidental How To Buy

The merger between Devon (DVN) and WPX Energy (WPX) offers a marked contrast to Occidental’s (OXY) ill-fated acquisition of Anadarko. Synergies are coming from cost savings not revenue opportunities, a defensive move that will likely spur further consolidation. The annual savings of $575MM will cover the modest 2.6% premium paid by DVN in less than two months. OXY paid a 62% premium 18 months ago.

.avia-image-container.av-ldne1e-789d4527172a3bcf02e2c8eb1af9bd18 img.avia_image{ box-shadow:none; } .avia-image-container.av-ldne1e-789d4527172a3bcf02e2c8eb1af9bd18 .av-image-caption-overlay-center{ color:#ffffff; }

The new Devon’s dividend policy has been well received – by paying out half the excess Free Cash Flow (FCF) over the current dividend, it allows investors to model different oil price scenarios and their impact on the payout. It’s another acknowledgment that bringing energy back in favor requires greater financial discipline.

A Biden administration has vowed to cease issuing new permits for fracking on Federal land, a policy that would constrain DVN’s Permian output. States benefit from the associated economic activity – the labor involved in drilling, fracking, transportation of water and other inputs to and from the site all create local jobs. In addition, New Mexico for example, where DVN has much of its Permian acreage, receives a 20% royalty. The Biden campaign’s promise to curtail fracking plays well with the base but is unlikely to be popular closer to the regions affected.

Switching gears, society is adjusting to life with Covid, where data continues to show positive trends. New Jersey, population 9 million with the worst fatality rate of any U.S. state, has 421 Covid patients in hospital, down 95% from the peak in April. We spend hours poring over the data, reading and learning about it. As chronicled before, your blogger doesn’t want to get sick and follows mask/hygiene protocols. But we think the market’s rapid recovery reflects the data – vulnerability increases sharply with age and certain risk factors. For the vast majority it’s not fatal.

Anecdotes also inform – here are some of ours:

One good friend at serious risk because of pre-existing health issues endured an extremely mild case of “Covid toes” – chilblains and nothing more. Once it was clear he was not in danger, I applied one of Winston Churchill’s many great quotes to him. “There’s nothing more exhilarating than to be shot at and missed.”

Another friend, in his late 50s and fit with no obvious risk factors, spent four days in hospital on oxygen (but thankfully not on a ventilator). His entire family was infected when their son returned from college. He’s recovered, but doesn’t care to repeat the experience.

The head of Trauma at a local hospital recounted somberly what his life was like in March and April. He’d never seen x-rays and conditions like those that presented. He’s hopeful it’s under control, but also noted that substance abuse is up sharply. Self-quarantines and the stress of financial losses are creating mental health issues.
Another friend recounted how her daughter, at college in Colorado, has endured a series of self-quarantines. As soon as one finished, she was found to have been in contact with another infected person and had to do another two weeks. This has continued for a couple of months, and the daughter is showing signs of mental stress.

My wife is a teacher, and modified in-person classes require wearing a mask all day. Although there’s no evidence than extended mask wearing causes any harm through oxygen deprivation, and it’s routine for health care workers, working with a mask on permanently is a lousy way to spend your day.

Then there’s the older woman in North Carolina who was sufficiently fearful of infection that she insisted her landscapers wear booties over their shoes. She brought home a case of diet coke, and out of an abundance of caution decided to sterilize the cans by placing them in her dishwasher. Well into the dishwasher cycle she was awoken in bed by a series of loud explosions, as the hot water ruptured the soda cans. Convinced her house was under attack, she alerted her neighbors.

Very little attention is being paid to the human and financial costs of mitigation, but we suspect that when a final reckoning is done it’ll be clear that cost-benefit analysis was completely absent.

We are invested in all the components of the American Energy Independence Index via the ETF that seeks to track its performance


The Smart Money In Pipelines

With pipeline stocks having their worst month since the depths of Covid-panic selling in March, investors are wondering when the smart money will finally respond to today’s extreme undervaluation and commit capital. Recent price action makes little sense, something that becomes very apparent in discussions with clients. 2Q20 earnings were as expected, and dividends unchanged. The yield on the American Energy Independence Index, the most representative index of North American midstream energy infrastructure, is now over 10%.

.avia-image-container.av-100wvd8-4beb3325b97050bf8577456c14686fd5 img.avia_image{ box-shadow:none; } .avia-image-container.av-100wvd8-4beb3325b97050bf8577456c14686fd5 .av-image-caption-overlay-center{ color:#ffffff; }

Two items stand out as the most compelling bullish arguments. The first is that the yield on Free Cash Flow (FCF, the cash flow available after ALL capex spending) is approaching 13% for 2021. We had previously been targeting $30BN for next year, (see Pipeline Earnings Should Confirm Growing Cash Flows), but following second quarter earnings have revised this higher, to $40BN. We don’t know of another sector of the market delivering such a high FCF yield. The broader market’s FCF yield is around 4% and the utility sector, the one most similar to pipelines, has a negative yield.

.avia-image-container.av-wqo6mk-4ad572ed0c7881bc47be4aaf4a2b11eb img.avia_image{ box-shadow:none; } .avia-image-container.av-wqo6mk-4ad572ed0c7881bc47be4aaf4a2b11eb .av-image-caption-overlay-center{ color:#ffffff; }

The jump in FCF is driven by continued falling growth capex, which peaked in 2018. Pipeline companies are reinvesting less in the business, leaving more for buybacks, deleveraging and distribution increases. Pipeline companies are still investing in growth though, spending on average 6% of their market caps on growth capex.  A sustainable cash flow yield assuming no new projects approaches 20%.

The second bullish item lies in the gulf between perceptions of bond and equity investors in the same company. Enterprise Products Partners (EPD) has 30 year bonds outstanding that yield 3%, less than a third of the distribution yield on their common units (see 4th chart in Stocks Are Still A Better Bet Than Bonds). Energy Transfer issued 10 year debt early last year, which trades above par following a sharp dip in March. Meanwhile, its common units have sunk to less than half the price at which they traded when the debt was issued (see The Divergent Views About Energy Transfer). While the dour view of equity markets towards the energy sector has driven prices down to where payouts yield 10% or more, long term bond investors see little to concern them. Conventional wisdom holds that bond investors are usually right, because they do more detailed analysis. But that is little comfort for today’s pipeline investors.

Berkshire Hathaway’s $10BN purchase of Dominion Energy’s natural gas pipeline network last month was welcomed by some investors as confirmation of the inherent value in the sector. The natural gas outlook offers more clarity than for crude oil. Covid dramatically altered travel. Gasoline consumption in the U.S. has recovered to within 10% of year-ago levels, but it’s widely believed that office work will never be the same. Increased remote working, less use of public transport, and migration to the suburbs complicate long term forecasts.

By contrast, since natural gas has minimal use in transportation, it is shielded from this uncertainty. Domestic consumption is down slightly from a year ago, but exports are rising and growing demand from developing countries is forecast in the years ahead. Moreover, continued phasing out of coal plants and increased use of renewables are likely to require more natural gas, both here and abroad.

Although California aims to rely on solar and wind for almost all their electricity, recent power outages and high prices make this a strategy few will care to follow. It’s unlikely intermittent renewables can maintain their growth without further reliance on always-there natural gas power plants.

For the twelve months ending in June, natural gas generated 1.6 Terawatt Hours (TW) of electricity. This was an increase of 124 Gigawatt Hours (GWh), or 8%, compared with the same period a year ago. To put this in perspective, total solar power generation over the past year was 81 GWh. On a percentage basis, renewables show high growth, but in absolute numbers natural gas growth dominates. Solar and wind growth combined was 58 GWh, less than half the growth in natural gas. As we switch off coal burning power plants, they are more often replaced with natural gas.

Meanwhile, Berkshire Hathaway has quietly become the sixth biggest operator of natural gas pipelines in America. Buffett presumably sees many years of predictable cashflows from these assets, offered at a cheap price. The smart money is here.

We are invested in all the components of the American Energy Independence Index via the ETF that seeks to track its performance


Why Exxon Mobil Investors Might Like Biden

To be an investor in the energy sector nowadays requires a view on the politics of climate change. Exxon Mobil’s (XOM) investor day slides go straight there in the Overview, noting the continued demand growth expected of non-OECD countries and its impact on emissions. The debate over global warming can be summed up thus:  OECD countries seek reduced emissions, while developing countries want higher living standards. The world’s energy-related CO2 output will move on the interplay between these conflicting goals.

.avia-image-container.av-10ge520-09051bf43b4fb6b6be1ec49de697ccc5 img.avia_image{ box-shadow:none; } .avia-image-container.av-10ge520-09051bf43b4fb6b6be1ec49de697ccc5 .av-image-caption-overlay-center{ color:#ffffff; }

It’s as if the company is warily watching the climate extremists who believe they shouldn’t exist, while investing heavily to meet the demand growth they anticipate. The industry has sharply cut near term growth capex because of Covid. XOM plans a 30% reduction, which they nonetheless described as mostly deferrals, not cancellations. Although they lowered their long term growth capex guidance, they still expect to spend $25-28BN per year (prior guidance was $30-35BN). They see their future in oil and gas.

.avia-image-container.av-re8vvc-5b3d367bfbc2192d0decfd02062bcca2 img.avia_image{ box-shadow:none; } .avia-image-container.av-re8vvc-5b3d367bfbc2192d0decfd02062bcca2 .av-image-caption-overlay-center{ color:#ffffff; }

Over the past five years, Cash Flow From Operating Activities (CFO) has averaged $29.6BN. XOM is roughly sinking every dollar they generate back into the ground. They still regard themselves as a growth company.

The presidential election is as vital to energy companies as to any sector. Trump’s 2016 victory was hailed by energy executives, who eagerly anticipated deregulation and pro-fossil fuel policies. The last four years have been a bust, as exuberant spending led to overproduction that Covid brutally exposed.

XOM has lost more than half its value since the 2016 presidential election. The company is expected to post a loss this year – the glut of oil and gas that has long weighed on prices has been exacerbated by the pandemic. But the potential for public policy to shift away from fossil fuels has further depressed its cash flow multiple – typically, multiples peak at market lows because the denominator is very low. But XOM’s price to cash flow multiple is at the low end of the past decade’s range.

The presidential cycle is too short to drive XOM’s capital allocation decisions. Nonetheless, they must contemplate the impact of a Biden victory. Future returns are likely to turn on the interplay between green policies that constrain fossil fuel output and the reduced supply that today’s curtailed spending will cause. Although XOM has trimmed its own long term capex guidance, the only way this level makes sense is if they expect industry-wide reductions to be greater.

Democrat policies that seek to lower fossil fuel consumption tend to focus on curtailing supply – it’s easier to control the few hundred companies involved in oil and gas production than to change the behavior of hundreds of millions of people.

XOM isn’t allocating capital based on the election – but it’s also safe to assume that a Biden victory won’t cause those plans to be altered much either. Since Democrat policies will constrain fossil fuel supply, it’s likely that energy prices will rise. A carbon tax would add further upward pressure. Energy prices are low in America, with plenty of room to rise without causing much outcry.

Higher prices support a green agenda, because they make renewables more competitive. Perversely, this could also usher in a period of improved profitability for the energy sector. XOM’s long term capex plans imply that governments and reduced industry capex will be more successful in constraining supply than demand, leaving higher prices as the main catalyst for changed consumer behavior.

On XOM’s 2Q investor call, SVP Neil Chapman noted that around 70% of its investor base is retail. So it’s not surprising that a quick tour of Seeking Alpha’s website reveals dozens of recent XOM articles targeting the self-directed investor. Many of these offer views on the likelihood of a dividend cut – with its shares yielding over 9%, there are many skeptics. It’s clearly at risk. At just under $15BN, the annual dividend is unlikely to be covered by free cash flow until at least 2023, according to a model from JPMorgan. Like MLPs during the exuberance of the Shale Revolution, XOM is investing in the future and borrowing to pay its dividend.

The most likely way for XOM to sustain its dividend is through higher crude oil prices. Their investors may not appreciate this, but a President Biden could be their path to better returns.

We are invested in all the components of the American Energy Independence Index via the ETF that seeks to track its performance.


The Divergent Views About Energy Transfer

The contrast between the pricing of debt and equity issued by pipeline companies is probably the topic that most engages clients in our discussions. In a recent piece on the equity risk premium (see Stocks Are Still A Better Bet Than Bonds) we used the example of Enterprise Products Partners (EPD). Because EPD’s common units yield 3X its long term debt, an investor with the flexibility to move from one asset class to another could achieve a bond-like return by investing a small portion of her capital in the equity.

In short, it seems implausible for the market to be so enthusiastic about a company’s long term debt while at the same time pricing its equity as if prospects are dire. Nonetheless, this fairly describes the current state of the public markets for midstream energy infrastructure securities.

Bond yields are low everywhere, partly the result of inflexible investment mandates by a significant portion of the global investor base. We have touched on this issue before (see Blinded By The Bonds and Real Returns On Bonds Are Gone). The persistence of negative real yields on sovereign debt, and indeed negative nominal yields, such as German ten year government bonds at -0.50%, can hardly reflect a widespread fear of deflation. Fiscal discipline is no contest for fighting the pandemic, and the Federal Reserve has even modified its inflation targeting to allow an overshoot of 2%. The only logical conclusion is that a great many institutional investors own bonds not because they want to – but because they have to.

This situation has been years in the making. Rates fell to previously inconceivable levels during the 2009 financial crisis, and have remained there ever since.

The comparison of Energy Transfer (ET) debt and equity over the past eighteen months offers a striking example of investors’ divergent views.

.avia-image-container.av-1472e2q-88007ba64546b27a8c6e5bccda98df65 img.avia_image{ box-shadow:none; } .avia-image-container.av-1472e2q-88007ba64546b27a8c6e5bccda98df65 .av-image-caption-overlay-center{ color:#ffffff; }

ET issued new ten year bonds in early January 2019, with a yield of 5.25%. The chart above shows the path followed by this debt and ET’s common units from that issue date. The two securities tracked one another for a few months before the bonds began to modestly outperform.

During the pandemic, debt and equity both fell sharply. The bonds fell less, reflecting their senior position in the capital structure. But the most striking feature of the chart is that the bonds have almost completely recovered and trade well above par, while the equity remains 50% lower than January 2019.

ET has a poor reputation for corporate governance, something we have noted (see Will Energy Transfer Act with Integrity?). Kelcy Warren’s bare-knuckle approach to business has made many enemies. But the company didn’t suddenly adopt its culture.

Legal challenges with the Dakota Access Pipeline (DAPL) are a potential headwind, but DAPL is around 3.5% of ET’s EBITDA so even a complete shutdown shouldn’t seriously impact the company (see Pipeline Opponents Help Free Cash Flow).

If the company’s prospects are as poor as implied by the weakness in its equity price, its debt has no business trading with a 4% yield. Conversely, if its balance sheet is as solid as this yield implies, the equity is mispriced.

.avia-image-container.av-pfil6q-4784de2d5e34bde5f10c2cdc0adf808c img.avia_image{ box-shadow:none; } .avia-image-container.av-pfil6q-4784de2d5e34bde5f10c2cdc0adf808c .av-image-caption-overlay-center{ color:#ffffff; }

Just as bond investors seem to buy yield-less government bonds without regard to value, equity investors in this sector seem to sell with equal disregard for the outlook. MLP funds have labored under outflows virtually all year. In conversations with investors, the biggest source of frustration is that prices don’t reflect fundamentals, and are often under pressure. The consequent fund outflows are, for now, drawing more selling. Nobody worries about pipeline stocks being overpriced (a preposterous notion). They do ask when the stocks will go up.

The answer is, when the current cohort of frustrated sellers is done. It could be any day.

We are invested in all the components of the American Energy Independence Index via the ETF that seeks to track its performance.


Investors Like Less Spending

Growth isn’t always good. The Shale Revolution led to enormous growth in U.S. oil and gas output, but abundance pressured prices and, for investors in U.S. exploration and production, it’s been a bust. Midstream energy infrastructure joined in the race for growth projects – but not every investment was accretive. Some, like Plains All American (PAGP), have seen their stock price lose 90% of its value since 2014. It’s the result of serial bad capital allocation decisions. The drop in Permian crude output caused by Covid will leave PAGP with excess pipeline capacity in the region.

.avia-image-container.av-ixpnwq-24bf1dfe5906ee7d29ffb86df2fb4269 img.avia_image{ box-shadow:none; } .avia-image-container.av-ixpnwq-24bf1dfe5906ee7d29ffb86df2fb4269 .av-image-caption-overlay-center{ color:#ffffff; }

Energy investors have become so wary of growth capital expenditures that they now cheer when a company reduces future spending. Enterprise Products Partners (EPD) has managed their business better than most over the past few years. Their investment in new infrastructure plus acquisitions peaked in 2014, and had already resumed its downward trend last year before the pandemic caused an industry-wide reassessment.

EPD last week canceled their planned Midland to Echo 4 (M2E4) pipeline carrying crude from the Permian to storage facilities on the Gulf of Mexico. Although much of the 450,000 barrels per day of capacity was already committed, EPD was able to get its customers to agree to extend the term of their agreements while reducing near term volume commitments. The crude oil originally intended for M2E4 will now move on other parts of EPD’s pipeline network.

Excess pipeline capacity out of west Texas is the most visible consequence of Covid on U.S. oil output. EPD’s move helps them but doesn’t solve the problem for other pipeline operators. “The Permian will still be significantly overbuilt” warned Ethan Bellamy, managing director of midstream strategy at East Daley Capital Advisors.

On Wednesday morning when the news was announced, EPD’s stock opened strongly and outperformed the American Energy Independence Index (AEITR) by 2% on the day. EPD estimates its growth capex will be $800MM lower over the next couple of years as a result, continuing the trend of recent years.

Lower growth spending means more free cash flow. CEO Jim Teague commented that, “The capital savings from the cancellation of M2E4 will accelerate Enterprise toward being discretionary free cash flow positive, which would give us the flexibility to reduce debt and return additional capital to our partners, including through buybacks.”

This is welcome news, and represents the new normal in the pipeline business.

We expect free cash flow for the industry to more than double this year. From our calls with investors, there’s substantial interest in today’s attractive yields, especially following 2Q earnings. EPD stands out with a distribution yield 3X their 30 year debt. As the industry continues to generate more cash, equity buyers will start to appreciate the long term stability of the best run businesses, as bond buyers already do.

We are invested in all the components of the American Energy Independence Index via the ETF that seeks to track its performance. We are also invested in PAGP and EPD via the SMAs and mutual fund we manage.


For MLPs, Index Is Everything

Long-time MLP investors need little reminding that the sector is out of favor. The Alerian MLP ETF (AMLP), with its tax-inefficient structure (see MLP Funds Made for Uncle Sam) has been shedding clients for years (see AMLP’s Shrinking Investor Base). Its focus on MLPs while they dwindle in number means it omits most of the biggest pipeline companies, as they’re corporations. AMLP’s distributions are down by a third (see Why Are MLP Payouts So Confusing?).

.avia-image-container.av-46p5fr-bd451ac27cd9d6d4154bba17f957a40d img.avia_image{ box-shadow:none; } .avia-image-container.av-46p5fr-bd451ac27cd9d6d4154bba17f957a40d .av-image-caption-overlay-center{ color:#ffffff; }

AMLP is designed to provide passive exposure to the Alerian MLP Infrastructure Index (AMZIX). It turns out that pipeline companies haven’t done nearly as badly as this index. The focus on MLPs has always excluded corporations – for many years, when MLPs were controlled by a General Partner (GP), Incentive Distribution Rights (IDR) allowed generous payments from the limited partners in AMZIX to the GP’s. Because AMZIX excluded corporations, it left out many of the GPs who were receiving IDRs payments. Although this model has largely disappeared, the exclusion of most GPs meant that AMZIX included the inferior side of the GP-LP equation. And there remain a handful of MLPs that still labor under the burden of making IDR payments to their GP — all unfortunately included in AMZIX. These include MLPs Cheniere Energy Partners (CQP, controlled by Cheinere Energy Corp, LNG) and TC Pipelines (TCP, controlled by TC Energy, TRP). Avoiding MLPs that owe IDR payments to a parent would have helped AMZIX perform better.

The GP-LP relationship has always looked more like the one between a hedge fund manager and its hedge fund. Hedge fund managers and MLP GPs both fared much better than investors in MLPs and hedge fund (see MLPs and Hedge Funds Are More Alike Than You Think).

.avia-image-container.av-39cvk7-b590303b14f604ae7bf1ffb936b6d2c6 img.avia_image{ box-shadow:none; } .avia-image-container.av-39cvk7-b590303b14f604ae7bf1ffb936b6d2c6 .av-image-caption-overlay-center{ color:#ffffff; }

Canadian pipeline companies are among the best run in North America. In recent years they have been acquiring MLPs, rolling them up into the corporate parent. For example, Enbridge acquired U.S. pipeline company Spectra Energy, which included Spectra Energy Partners, its MLP, in 2016. Transcanada (TRP) bought Columbia Pipeline Group the same year, and later rolled up their MLP. All these acquisitions led to the assets leaving AMZIX, because they were no longer housed in MLPs. Excluded from AMZIX but still significant was when Pembina (PBA) bought Veresen in 2017 and also acquired Kinder Morgan Canada after it has sold its Trans Mountain Express pipeline expansion to the Canadian Federal government.

In early 2018, the Federal Energy Regulatory Commission (FERC) surprised investors with a tax ruling that prevented MLPs from including investors’ imputed tax liability in setting natural gas pipeline tariffs. Although FERC later walked back this hasty ruling, the damage was done and natural gas pipelines are largely housed in corporations, where FERC’s tax ruling has no effect.

The general shift from MLPs to corporations as the desired corporate form, so as to access a broader set of investors, has taken place throughout this time. The result is that AMZIX doesn’t reflect the North American pipeline industry (see MLPs No Longer Represent Pipelines). It has the last three big pipeline companies that maintain their MLP status, and a bunch of small gathering and processing names that are more risky. It also has an overweight to crude oil and refined products pipelines, with a corresponding underweight to natural gas pipelines.

AMZIX has wound up with a form of adverse selection – seemingly always on the wrong side of the trade. Holding MLPs that paid IDRs to GPs, rather than GPs themselves; gradually becoming more concentrated as MLPs were rolled up into corporations; and drifting away from natural gas pipelines, leaving them with commensurately more crude oil risk at a time when transportation demand faces a lot of uncertainty.

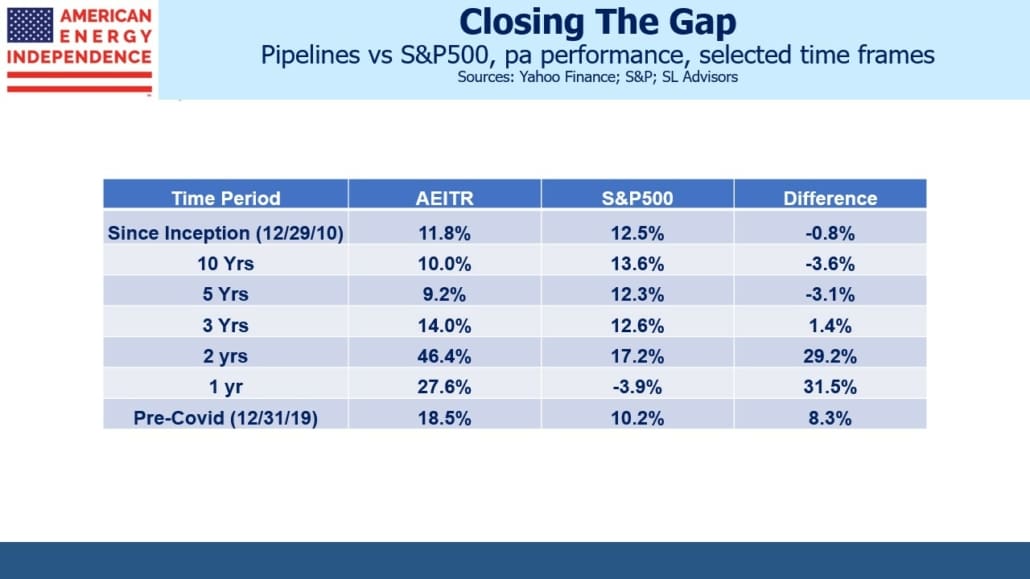
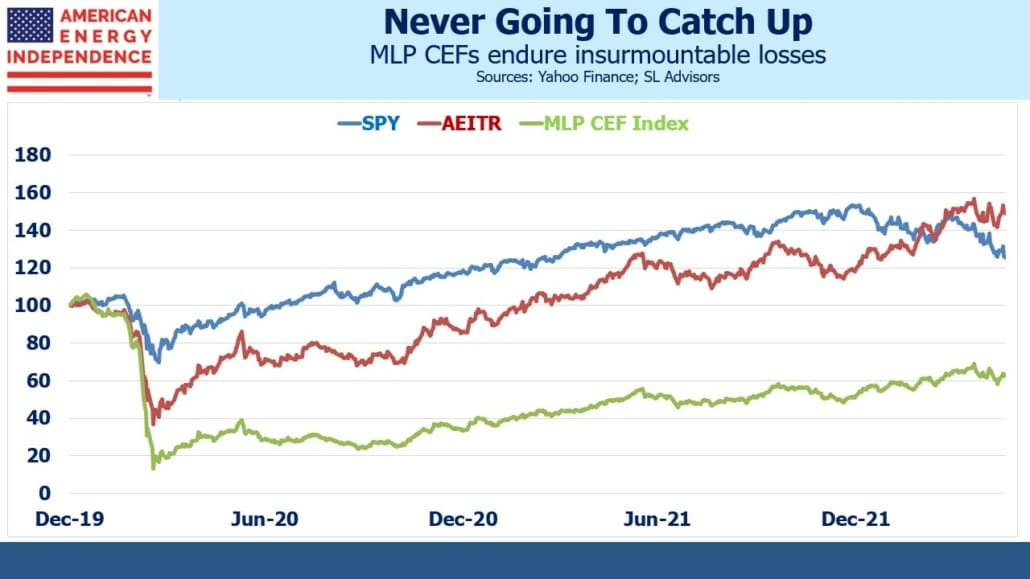
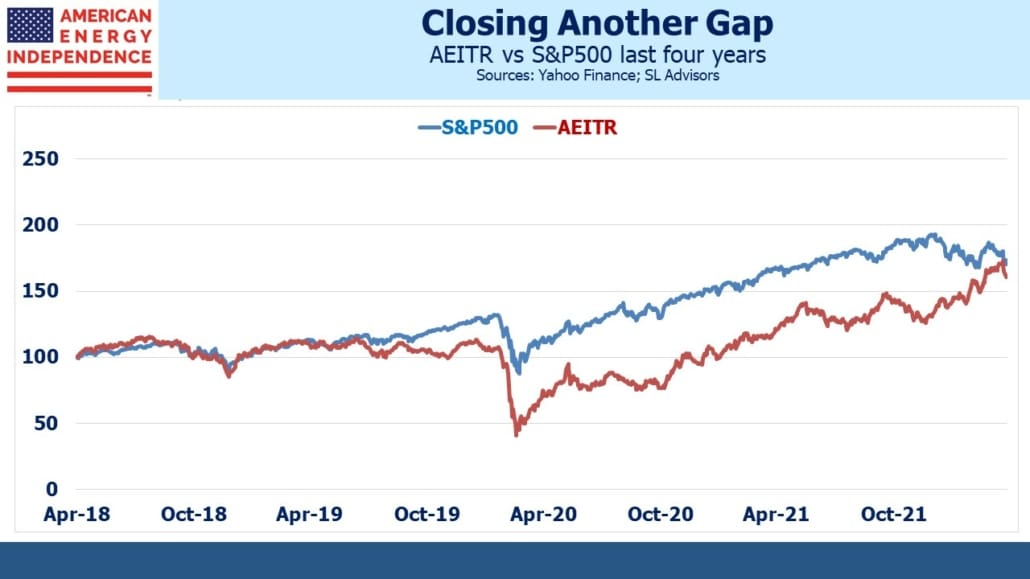
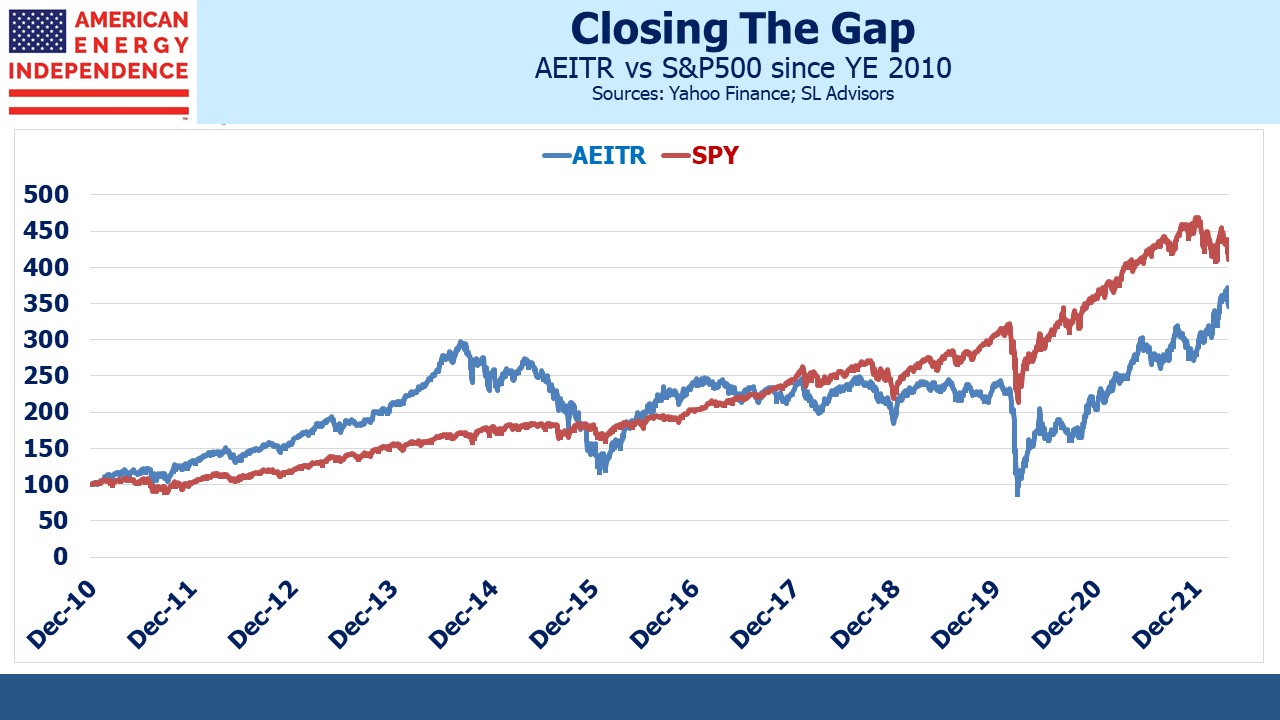
The American Energy Independence Index (AEITR) was always designed to reflect the better side of the historic GP-LP relationship, and to be broadly representative of the North American pipeline industry. MLPs, as defined by AMZIX and its associated investment product AMLP, have had a miserable decade. But the broad North American pipeline industry as defined by AEITR has done substantially better over multiple timeframes, because of the construction advantages noted above. For almost the past decade it’s performed 14% p.a. better

When an investor complains about lousy MLP performance, they’re right, but they’re also revealing that they’ve had too much exposure to the wrong index.

We are invested in all the components of the American Energy Independence Index via the ETF that seeks to track its performance.


Stocks Are Still A Better Bet Than Bonds

In late April, a month after the low, we noted how stocks were cheap (see The Stock Market’s Heartless Optimism). The Equity Risk Premium (ERP, the difference between the earnings yield on the S&P500 and ten year treasury yields) is a useful barometer of relative value between the two major asset classes.

At the lows in March, the ERP on 2020 S&P50 earnings reached 5.0, and was 6.5 for 2021.

Now that the market has made a new all-time high, capping the briefest bear market in history, it’s no longer cheap although still attractive by historical standards. The 2020 ERP is 3.4 and 2021’s is 4.1.

.avia-image-container.av-qwmg8w-d6e0c26e7df7d41975ae6402022df818 img.avia_image{ box-shadow:none; } .avia-image-container.av-qwmg8w-d6e0c26e7df7d41975ae6402022df818 .av-image-caption-overlay-center{ color:#ffffff; }

The rally has mostly been characterized by multiple expansion. No big stock epitomizes this more than Apple (AAPL), which has almost tripled in value since the beginning of last year. It used to trade at a low double digit earnings multiple – it’s now at 30X 2021 Bloomberg consensus earnings. At $2TN in market cap, AAPL is over 7% of the S&P500.

.avia-image-container.av-tdt6o0-ff33ec7ad0e826818cc349eb51babd69 img.avia_image{ box-shadow:none; } .avia-image-container.av-tdt6o0-ff33ec7ad0e826818cc349eb51babd69 .av-image-caption-overlay-center{ color:#ffffff; }

As 2021 earnings forecasts were revised down through the worst of the pandemic, they still never dipped below last year’s. In other words, even at the depths of Covid despair, the earnings story remained that this was a one year hit that would see profits quickly rebound to prior levels.

.avia-image-container.av-1cl5qbk-b3664e4f7fe61ffec1f13affb203ee91 img.avia_image{ box-shadow:none; } .avia-image-container.av-1cl5qbk-b3664e4f7fe61ffec1f13affb203ee91 .av-image-caption-overlay-center{ color:#ffffff; }

Earnings forecasts for the following year are typically most optimistic in January. As time passes they are usually revised downward, probably as cautious management guidance gets reflected in analyst estimates. This makes it easier to subsequently beat expectations. But in recent weeks, 2021 earnings forecasts have been revised up modestly. The improved profits outlook has more than offset cautious guidance.

Given the impact on our lives and the relentless media reports of death, the stock market has provided an almost offensively optimistic perspective (see Is Being Bullish Socially Acceptable?).

The ERP shows stocks to be cheap because interest rates remain so low. Stocks are cheap relative to bonds. In the past we’ve illustrated this by calculating how much money invested in stocks would deliver the same ending value as $100 put into ten year treasury securities. The dividend yield on the S&P500 is around 1.8%, 1.2% above the ten year. Dividends grow while treasury coupon payments do not, and dividends are also taxed at a lower rate – at least, for now. The result is that it takes a lot less than $100 invested in stocks to match a ten year bond, assuming stocks don’t wind up lower in a decade.

The contrast is especially stark when applied to pipeline stocks. Enterprise Products Partners (EPD) maintained its payout through the 2014-16 energy downturn and, so far, through the Covid pandemic. Its dividend provides a 9.7% yield, a level that might suggest a high degree of investor concern about their prospects. However, bond investors see little to worry them. EPD recently issued ten year notes that currently yield 1.9%. A 30 year bond issued at the same time yields 3.3%.

.avia-image-container.av-px2vfk-0b2cf82ade62b8fc89de09b892ff88ee img.avia_image{ box-shadow:none; } .avia-image-container.av-px2vfk-0b2cf82ade62b8fc89de09b892ff88ee .av-image-caption-overlay-center{ color:#ffffff; }

Using the assumptions in the table, an investor about to commit $100 to EPD’s ten year debt could instead put just $8 into EPD common shares with the rest in cash (i.e. treasury bills), and achieve the same return. Even in a highly improbably EPD bankruptcy, a loss on the bonds of greater than 8% would still leave the equity as the less risky choice.

This math reflects the tyranny of low rates, and has been driving investors into stocks for years. Inflexible investment mandates that require holding bonds without regard to return are keeping rates low. The stocks in the American Energy Independence Index, of which EPD is a component, yield 8.8%. For those with sufficient flexibility, the stocks of these issuers are far more compelling than their bonds.

We are invested in EPD and all the components of the American Energy Independence Index via the ETF that seeks to track its performance.


California Dreamin’ of Reliable Power

Californians have recently been enduring rotating blackouts – short term loss of power due to excessive demand. When the lights go out and the a/c units no longer hum, it’s always political. Oddly, both sides can agree that climate change is to blame. Liberals attribute the extended high temperatures in southern California to the gradual manmade warming that is afflicting the planet. Conservatives see a reliance on unreliable renewables as the cause – underlying the power supply shortfall was the loss of 100MW of output from a wind farm.

.avia-image-container.av-lf0ojw-24fbb566e88ec97375efd70519469aef img.avia_image{ box-shadow:none; } .avia-image-container.av-lf0ojw-24fbb566e88ec97375efd70519469aef .av-image-caption-overlay-center{ color:#ffffff; }

Perhaps global warming is making it less windy. Environmental extremists will argue that fighting climate change is ever more urgent, while pragmatists will note that using more intermittent renewables is leaving consumers vulnerable to shortages.

What’s happening in California is important to all Americans, because it’s a preview of what an energy policy run by environmental extremists could look like if inflicted across the entire country.

For the past decade, California has been steadily pushing renewables’ share of power generation. For much of that time natural gas was easily the biggest source of electricity, since coal use stopped completely in 2015.

.avia-image-container.av-12qbdrg-f589d109be6eafa2436b03b1120e1dd7 img.avia_image{ box-shadow:none; } .avia-image-container.av-12qbdrg-f589d109be6eafa2436b03b1120e1dd7 .av-image-caption-overlay-center{ color:#ffffff; }

But environmental extremists have been single-minded in their desire to run everything with solar panels and windmills. Although the state has not banned natural gas, it does allow cities and counties within the state to do so. Diablo Canyon, California’s last remaining nuclear power plant, will close its two reactors in 2024-25.

In 2018, California passed a law mandating 50% of its electricity to be from renewable sources by 2025, 60% by 2030 and 100% by 2045. There are no plans to build new nuclear capacity, so it looks like sun and wind will be the major source of power.

.avia-image-container.av-q7odzg-8535ccf075a16b97bba151a6d65d26fe img.avia_image{ box-shadow:none; } .avia-image-container.av-q7odzg-8535ccf075a16b97bba151a6d65d26fe .av-image-caption-overlay-center{ color:#ffffff; }

America has been reducing its CO2 emissions, but oddly California has been lagging the rest of the country, with a slight worsening since 2011. This fact must sit uncomfortably with those thoughtful advocates of California as a leader in renewables. The problem, as anyone trying to drive around Los Angeles knows, is that transportation still relies heavily on fossil fuels. A couple of years ago when I was visiting clients with a salesperson for a couple of days, traffic estimates were critical to our meeting schedule. In fact, every meeting seemed to open with a brief chat about the 405. Automobiles and traffic jams generate a lot of California’s emissions.

.avia-image-container.av-wvyxqk-184860cb706312c3830d76a6cf8c0b80 img.avia_image{ box-shadow:none; } .avia-image-container.av-wvyxqk-184860cb706312c3830d76a6cf8c0b80 .av-image-caption-overlay-center{ color:#ffffff; }

California’s renewables effort has focused on electricity, but that’s less than 14% of total energy consumption. This is why the popular image of green California isn’t reflected in reduced emissions.

The average retail price of electricity in California is 16.58 cents, versus 10.53 cents for the country as a whole. Unreliable power that costs 57% more than the average, along with a slower rate of emissions reduction, are not the hallmarks of a successful policy to combat climate change. This is where the drivers of Joe Biden’s energy policy are hoping to take us. The Biden-Sanders Unity Task Force has recommended, “…eliminating carbon pollution from power plants by 2035”. This is a decade ahead of California – because it’s going so well there.

California’s power blackouts are in part because the wind has inconveniently not been blowing when needed. This is why natural gas is such a good compliment to intermittent renewables – it’s always available. Many other U.S. states have embraced this, including Nextera (NEE), loved by environmentalists and investing in natural gas pipelines.

Energy density is another challenge that will lead to NIMBY problems.

An article in the Financial Times (see Green power needs to be dense power) compared the 950 acres required for a UK solar farm to produce 350 megawatts of power with the 80 acres to house a nuclear project with 3,200MW of output. Not only is this 9X the power output on under 9% of the land, but the solar plant is only expected to operate at 11% capacity, versus 90% for the nuclear. The power output per acre is 1,000 times lower for this solar installation compared with nuclear, a significant problem in densely populated Britain.

Any solar installation in the UK is a green extremist triumph in willful denial of the climate – but at least they’re still building nuclear plants, because they do want to keep the lights on.

California’s blackouts show what happens when climate extremists run energy policy. The silver lining for investors is that such policies lead to, and desire, high energy prices – both as a constraint on demand and also because it makes renewables less uncompetitive. Returns on energy investments tend to follow energy prices. Green policies that constrain supply need not be bad for the sector.

We are invested in all the components of the American Energy Independence Index via the ETF that seeks to track its performance.


Natural Gas Is November’s Winner

Citibank published some interesting research recently, making the case for higher natural gas prices in the months ahead. Oil production in the U.S. has fallen sharply as a result of Covid. Gasoline demand has recovered from its low point in April, but remains about 9% below normal.

Natural gas demand has shown much less impact, because it’s not used in transportation. The chart shows that it’s running the same as a year ago, although last week power consumption dipped. Power outages from Tropical Storm Isaias may have been partly to blame.

.avia-image-container.av-w3mpbn-7c60c6998790c7e3f6004e25d05e8136 img.avia_image{ box-shadow:none; } .avia-image-container.av-w3mpbn-7c60c6998790c7e3f6004e25d05e8136 .av-image-caption-overlay-center{ color:#ffffff; }

Citi’s forecast of higher natural gas relies on two factors: the drop in oil production has also reduced output of associated gas, which was most common in the Permian in west Texas. Oil prices drive the economics of drilling in that region. The resulting gas production was pressuring prices as well as causing more flaring (watch Stop Flaring).

.avia-image-container.av-5ptvyr-0a00d4c6c44b5bd4a4700cb88e6c1575 img.avia_image{ box-shadow:none; } .avia-image-container.av-5ptvyr-0a00d4c6c44b5bd4a4700cb88e6c1575 .av-image-caption-overlay-center{ color:#ffffff; }

The second factor relies on a Biden administration, which is looking the more likely outcome based on recent opinion polls. The thinking is that a Federal initiative to lower CO2 emissions will start with accelerating the phase-out of coal-burning power plants. This trend has been under way for several years, and represents the easiest steps an incoming President Biden could take to fulfill campaign pledges on clean energy.

.avia-image-container.av-25pekz-cdac82b96b0854470f7b03d2efa03216 img.avia_image{ box-shadow:none; } .avia-image-container.av-25pekz-cdac82b96b0854470f7b03d2efa03216 .av-image-caption-overlay-center{ color:#ffffff; }

Deferred natural gas futures pushed higher in recent weeks, reflecting higher prices a year out at the same time as opinion polls continue to show Biden in front.

Natural gas power plants typically release half the CO2 emissions of coal for equivalent energy production, and are also free of particulate matter and other pollution such as nitrogen oxides, sulfur dioxide, mercury and other hazardous substances that the local population inhales.

The Biden Plan for Climate Change targets “net-zero emissions no later than 2050.” However, the Biden-Sanders Unity Task Force says, “Democrats commit to eliminating carbon pollution from power plants by 2035.” A Biden administration would be under pressure from extreme liberals to adopt the more aggressive target, which Citi believes is likely.

.avia-image-container.av-1cpv1yr-882f6e5e62c8fc28b36b24253763476e img.avia_image{ box-shadow:none; } .avia-image-container.av-1cpv1yr-882f6e5e62c8fc28b36b24253763476e .av-image-caption-overlay-center{ color:#ffffff; }

Citi Research calculates that retiring the nation’s coal plants at a uniform rate would take approximately 10 Gigawatts (GW) of power offline annually. Assuming these plants are running at 48% capacity, as was the case last year, the country would need to add 4.8 GW of new natural gas power every year, requiring about 1 Billion Cubic Feet per Day (BCF/D).

Foreign demand is also increasing — both China and India have long term plans to use more natural gas. Nord Stream 2, which is being built to supply more Russian gas to Europe, continues to draw U.S. sanctions which may yet impede its ultimate completion.

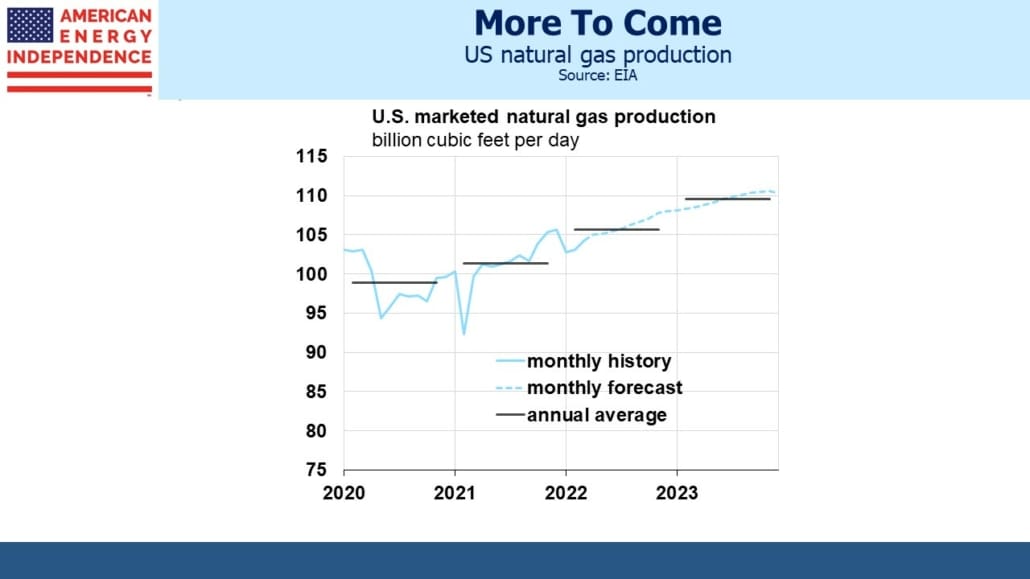
Last year, the U.S. produced 92 BCF/D of natural gas, consuming 85 BCF/D domestically with the difference made up by exports (5BCF/D) and withdrawals from storage (1.4 BCF/D). Decommissioning coal plants could increase domestic demand by 1% or so annually.

So far, cheap natural gas has motivated the switch away from coal. Citi expects higher prices to reduce the economic advantage, but also believes this will stimulate increased production by 2022.

Although Trump’s election victory was welcomed by energy executives, their enthusiasm for a Republican administration freed their animal spirits in recent years, and investors have borne the cost. A pro-fossil fuel administration has been an excuse for many upstream and a few midstream companies to dump financial discipline and allocate capital with overly optimistic assumptions.

It may seem perverse, but a Biden victory could be good for pipeline investors, because it would impose a more cautious  assessment of new projects. An industry held responsible for climate change by extremists in the president’s party would more likely be parsimonious in spending its cash.

New greenfield pipeline projects are already a non-starter because of relentless legal challenges, which many investors have welcomed (see Environmental Activists Raise Values on Existing Pipelines). Solar and wind projects are just as vulnerable to the same delaying tactics using the court system. New England is famously opposed to new pipelines (see An Expensive, Greenish Energy Strategy). But in 2017 an offshore wind project also fell victim to interminable delays, from property owners defending their ocean view (see After 16 Years, Hopes for Cape Cod Wind Farm Float Away).

Russell Gold recounted in Superpower: One Man’s Quest to Transform American Energy the challenges that defeated Michael Skelly in building high voltage transmission lines to send electricity from windy, unpopulated regions to cities.

.avia-image-container.av-schb03-71da6089eb13bf9317a4a90cda7bcb29 img.avia_image{ box-shadow:none; } .avia-image-container.av-schb03-71da6089eb13bf9317a4a90cda7bcb29 .av-image-caption-overlay-center{ color:#ffffff; }

New natural gas power plants retain a substantial cost advantage over renewables, even after many years of subsidies. It’s likely that a sharp increase in solar and wind farms, along with the associated power lines, will collide with the same NIMBY opposition through court challenges. Energy infrastructure that is already installed, such as natural gas pipelines, has an advantage.

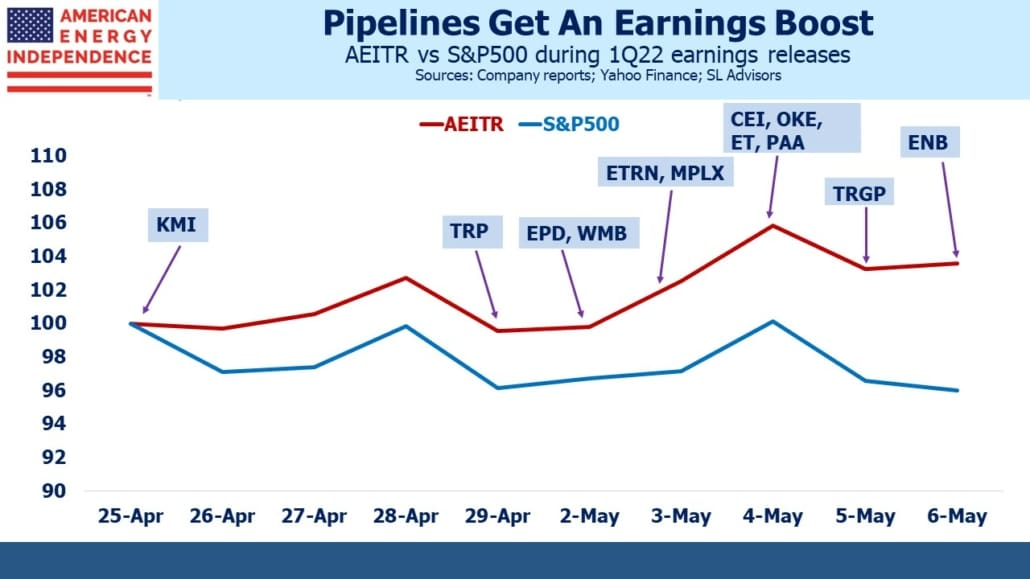
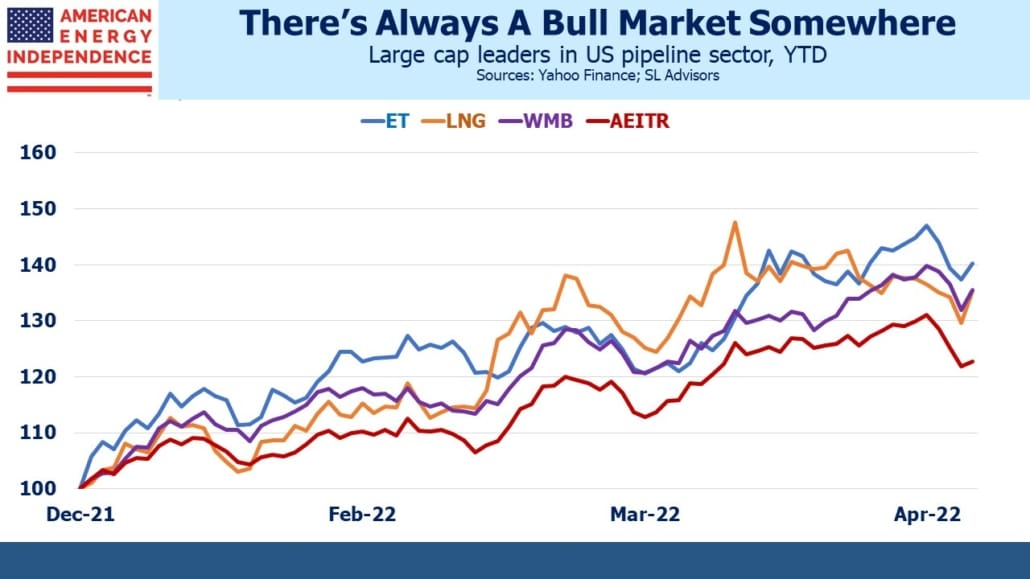
Much can change over the 79 days until the election, but pipeline stocks have been outperforming the S&P500 since earnings were kicked off by Kinder Morgan last month (see Pipeline Earnings Provide A Boost). Dividend yields of 8-9% are drawing buyers who are looking beyond the opinion polls.

There’s no reason for equity investors in midstream energy infrastructure to be scared of a Biden presidency (listen to our recent podcast, Joe Biden and Energy). Bond investors see little of concern — Enterprise Products Partners (EPD) for example recently issued 30 year debt at 3.2%, while their equity offers a dividend yield over 9%. Compared with the past four years, equity returns are likely to be much better.

We are invested in the names mentioned above and all the components of the American Energy Independence Index via the ETF that seeks to track its performance.