Blinded By The Bonds

.avia-image-container.av-o5hoxd-b5439a9a04335976beced74869fc41a7 img.avia_image{ box-shadow:none; } .avia-image-container.av-o5hoxd-b5439a9a04335976beced74869fc41a7 .av-image-caption-overlay-center{ color:#ffffff; }

German 30 year bunds yield 0.6%. Investors are inured to insultingly low yields, but somehow this still shocks. The ECB defines price stability as inflation “…below, but close to, 2% over the medium term.” Assuming it averages 1.5%, investors are accepting a negative real return virtually in perpetuity.

French energy company Total (TOT) issued perpetual bonds at 1.75%, to buyers who are apparently satisfied with never earning a real return on a corporate credit.

Germany’s ten year yields are -0.05%. Could their 30 year bonds one day join them in negative territory? Japan’s ten year yield is -0.08%. U.S. ten year treasury yields of 2.4% are profligate by global standards.

There is some logic to accepting negative returns over the short term. You can only stuff so much currency under the mattress. But the point of investing is to preserve purchasing power. Somehow, bond investors have become trapped by inflexible thinking into self-destructive actions on a vast scale.

Asset allocations that rely on a split between equities and fixed income persist in maintaining some bond exposure even while loss of purchasing power is guaranteed. Clearly, tens of billions of dollars in assets has accepted this. The stewards of this capital retain a rigid adherence to portfolio diversification. Since falling yields have supported positive returns on bonds through capital appreciation, maintaining bond exposure hasn’t caused visible losses, for now.

Perhaps there’s a principal-agent problem here. The certain knowledge that an investment will lose money should cause an investor to change her selection. Self-evidently, if the purpose of saving is to consume tomorrow, when you know your purchasing power will be lower, perhaps you should consume more today and not save as much. If your career is buying bonds for clients, you’re unlikely to promote radical thinking.

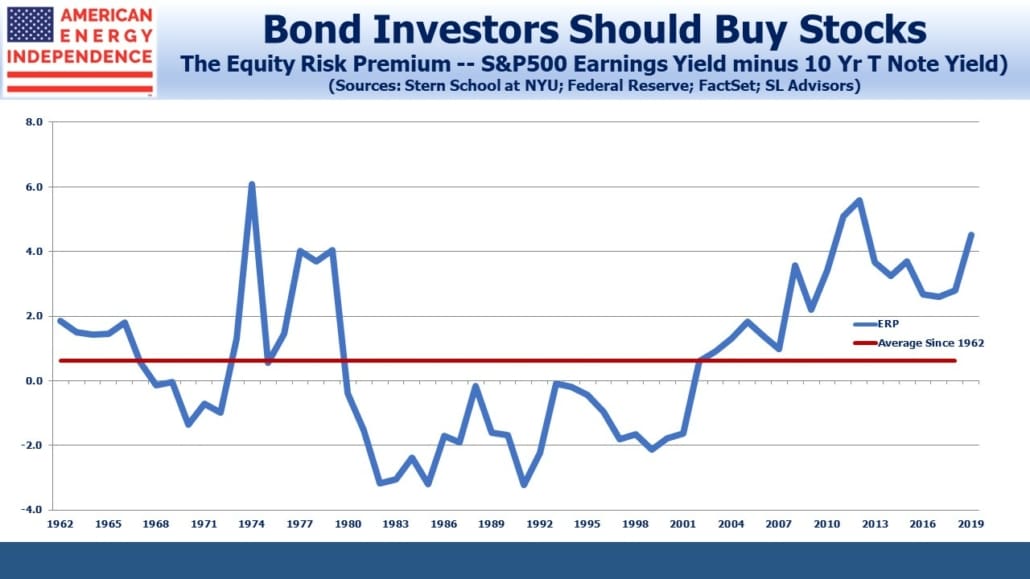
The Equity Risk Premium favors stocks over bonds. This is true even though S&P500 2019 consensus earnings forecasts are being revised down. The current $168 forecast is down $10 since October, and puts the market’s P/E at around 17. But bond yields have also fallen, which has maintained equities’ relative attraction.

.avia-image-container.av-mp9z69-af0504a6afe016d05b8d37efcf220ca1 img.avia_image{ box-shadow:none; } .avia-image-container.av-mp9z69-af0504a6afe016d05b8d37efcf220ca1 .av-image-caption-overlay-center{ color:#ffffff; }

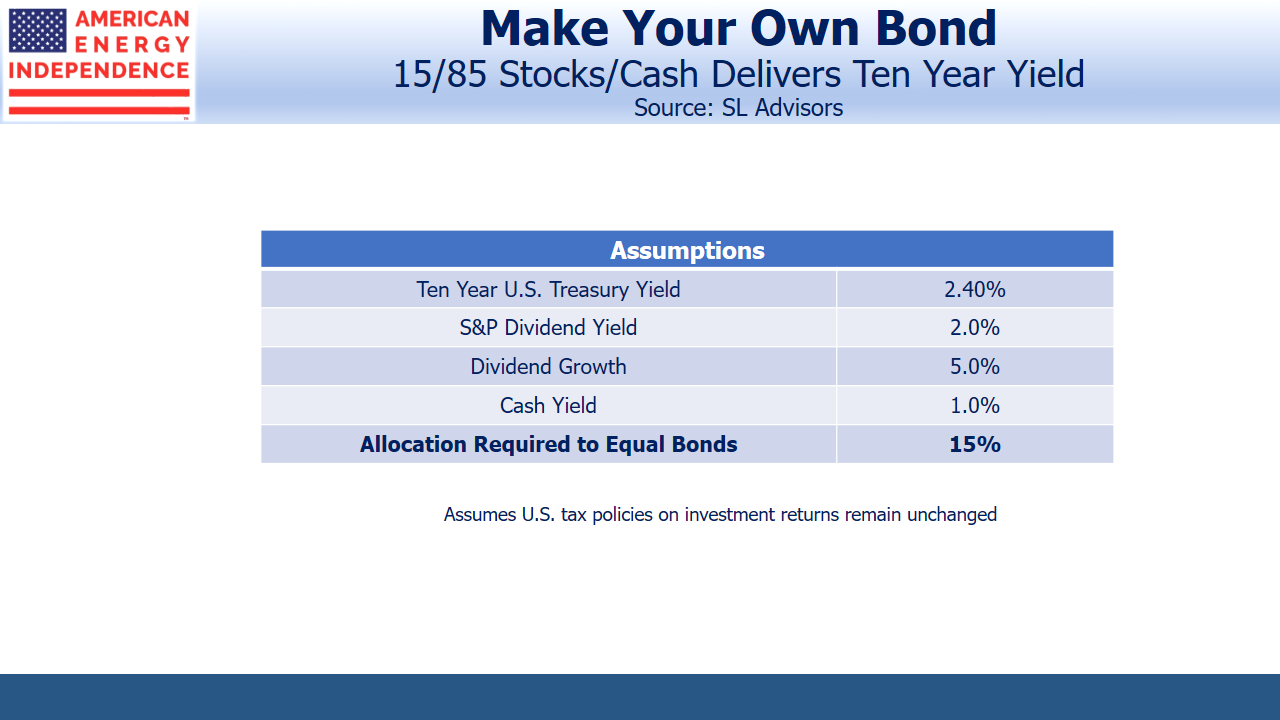
We’ve often illustrated the wide spread between the earnings yield on the S&P500 and bond yields by showing how little money invested in stocks could generate the same return as $100 in ten year treasury securities. Today, only $15 in the S&P500 would match the return on $100 invested in ten year treasuries at 2.4%, assuming (1) 5% dividend growth (which is the long-term historical average), (2) an unchanged S&P500 yield in ten years, (3) unchanged tax policies, and (4) that the other $85 is invested in a money market fund at an average yield of 1%.

.avia-image-container.av-1837qoh-0708daf1d9dd8c62f1457d13a9abc222 img.avia_image{ box-shadow:none; } .avia-image-container.av-1837qoh-0708daf1d9dd8c62f1457d13a9abc222 .av-image-caption-overlay-center{ color:#ffffff; }

Make your Own Bond Cash and Equity

A German investor fleeing the tyranny of low domestic rates for the U.S. would have to hedge the currency risk, which thanks to the magic of interest rate parity would precisely eliminate the yield advantage. But German stocks yield 3%, a substantial advantage over ten year Bunds.

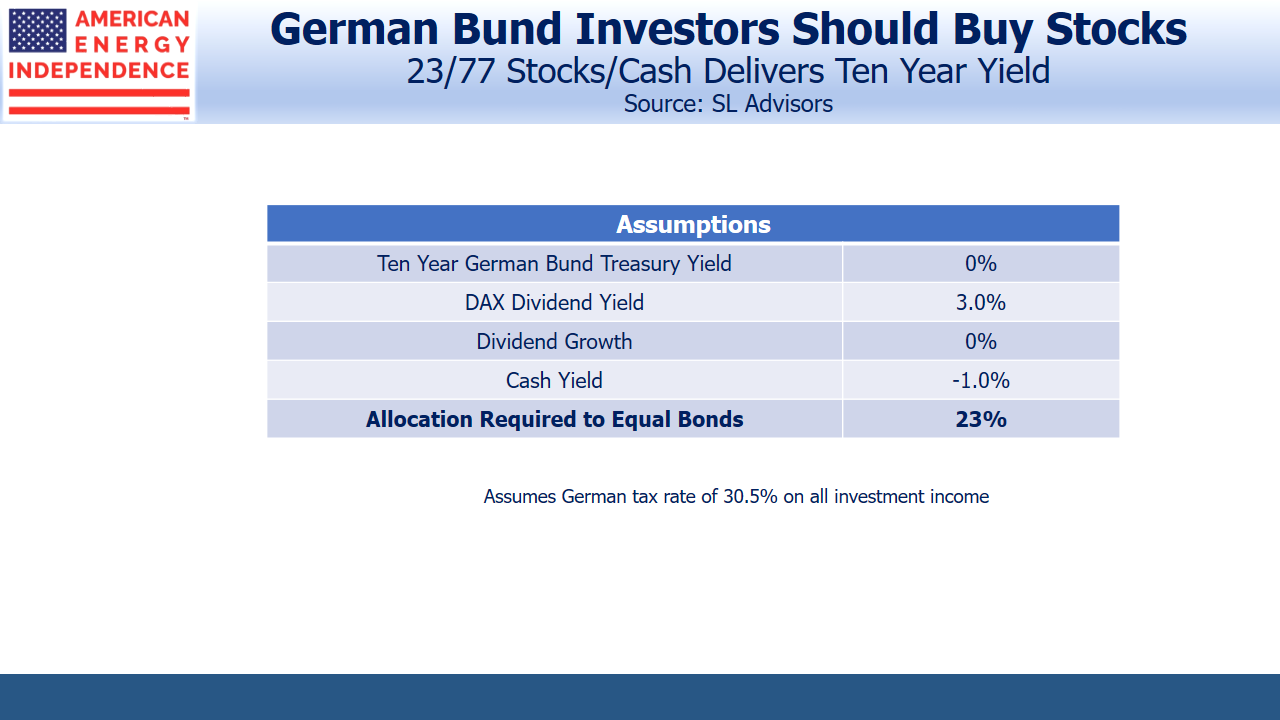
Bund yields are negative because short term securities are even more negative. Two year German bunds yield  -0.63%. To some degree, investors in long term bunds are fleeing even worse short term yields. The example above using equities and cash to achieve the return on ten year bunds still works though. Assuming cash rates of -1.0% for ten years, a 23/77 split between German stocks and cash would achieve the ten year Bund return of approximately 0%. This assumes no dividend growth, which is a highly conservative assumption and would suggest the DAX finish the decade where it started. Just 2% dividend growth improves equity returns and lowers the split to 14/86.

.avia-image-container.av-p0zitt-6c8fd5fa9c044f892f19f6f3c034f1e0 img.avia_image{ box-shadow:none; } .avia-image-container.av-p0zitt-6c8fd5fa9c044f892f19f6f3c034f1e0 .av-image-caption-overlay-center{ color:#ffffff; }

German Bund Investors

Returning to Total and their perpetual bonds – energy has been a miserable sector and is cheap, as regular readers know. Energy infrastructure offers dividend yields of 6% or more, with distributable cash flow yields above 10%. The buyers of Total’s 1.75% perpetual bonds prefer this to the 5.2% dividend yield on its stock. There’s too much money in bonds struggling to find an adequate return.

Although central banks have been substantial participants in global bond markets since the 2008 financial crisis, plenty of commercial buyers are also investing at current yields. They’re exhibiting a remarkable lack of intellectual flexibility. When returns are certain to leave you poorer, it’s time for some fundamental questions about the purpose of investing. Bond investors will probably have to endure a couple of years of steep losses before making that assessment. By then, the folly of investing in debt at today’s yields will be completely obvious and too late to correct.

SL Advisors is the sub-advisor to the Catalyst MLP & Infrastructure Fund.  To learn more about the Fund,  please click here.

SL Advisors is also the advisor to an ETF (USAIETF.com).


The Quiet Investors in Energy

The S&P Energy sector has delivered the worst returns of eleven sectors for four of the past five years. Reflecting investor disdain, energy is now around 6% of the S&P500, down by half in the past decade. Realizing the full potential of the Shale Revolution has demanded a lot of capital – over $1TN by one estimate. Management teams’ desire to grow has increasingly conflicted with investors’ insistence on greater cash returns. In midstream infrastructure this has been especially acute, with the traditional income-seeking MLP investor enduring multiple distribution cuts to support growth projects.

On Twitter, an anonymous, well informed energy investor created a humorous NCAA-type bracket to identify the most capital-destructive management team among publicly traded energy stocks. Each pairing is resolved through online votes, with the ultimate winner earning a most ignominious title. One comment asked if there was another sector with as wide a gap between management self-perceptions and those of investors.

Yet there’s a class of investor that continues to find energy attractive – private equity.

A recent presentation by S. Wil VanLoh Jr. of Quantum Energy Partners offered a useful perspective.

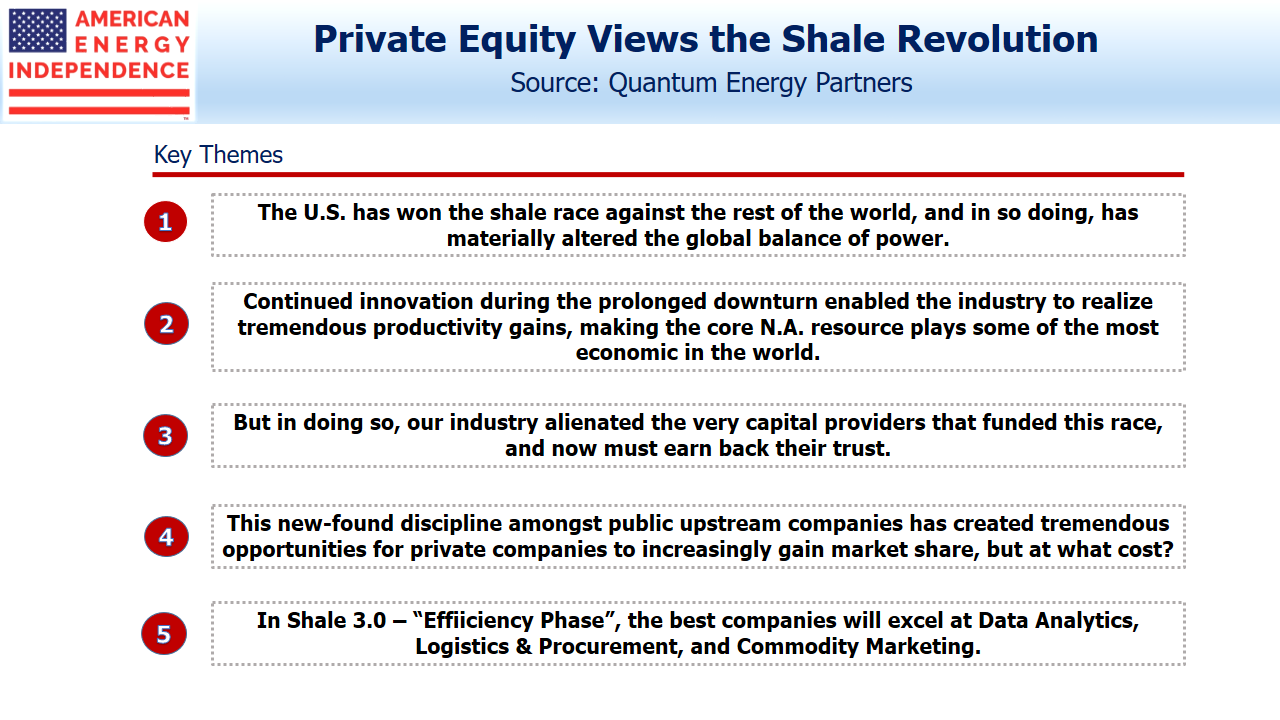
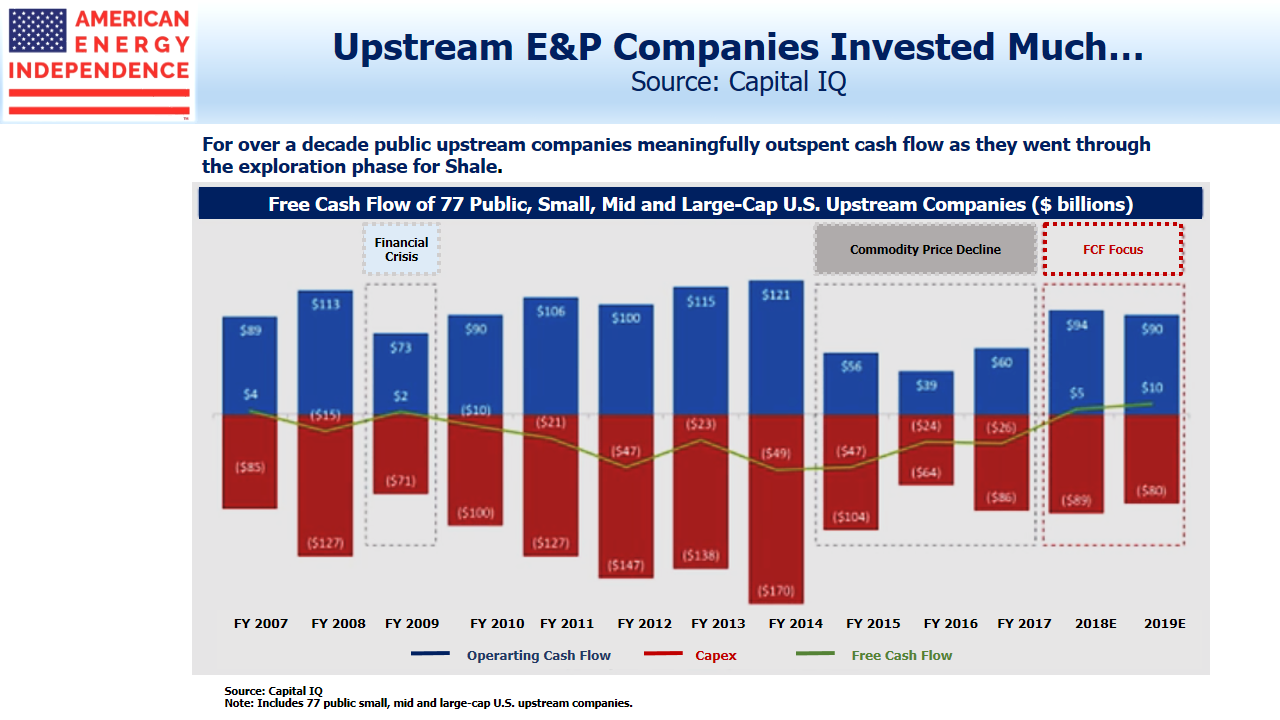
Public equity investors are repelled by the energy sector’s persistently low free cash flow, with profits too frequently plowed back into new production. By contrast, private equity (PE) funds with their locked up capital are drawn by the internal rates of return, which they find attractive. Their ability to outspend cashflow for several years as projects are developed can’t be matched by their public counterparts, whose investors are sensitive to quarterly earnings. Although this hasn’t led to any significant public companies being taken private, it has led to PE becoming a steadily bigger player in shale. They recognize that the U.S. has already won the shale race against the rest of the world.

.avia-image-container.av-ixtv0x-d1caf6905f9e92f053a1ed1ae1e6abba img.avia_image{ box-shadow:none; } .avia-image-container.av-ixtv0x-d1caf6905f9e92f053a1ed1ae1e6abba .av-image-caption-overlay-center{ color:#ffffff; }

Private Equity Views the Shale Revolution

Growing market share and increased geopolitical flexibility must surely lead to good investment returns. But around $1TN in capital has not all been well spent, and any sector recovery depends on management teams regaining the trust that has been lost.

.avia-image-container.av-2fkvc5t-c2e12f7ccd2301094a564501caf2ae45 img.avia_image{ box-shadow:none; } .avia-image-container.av-2fkvc5t-c2e12f7ccd2301094a564501caf2ae45 .av-image-caption-overlay-center{ color:#ffffff; }

Private Equity Views the Shale Revolution

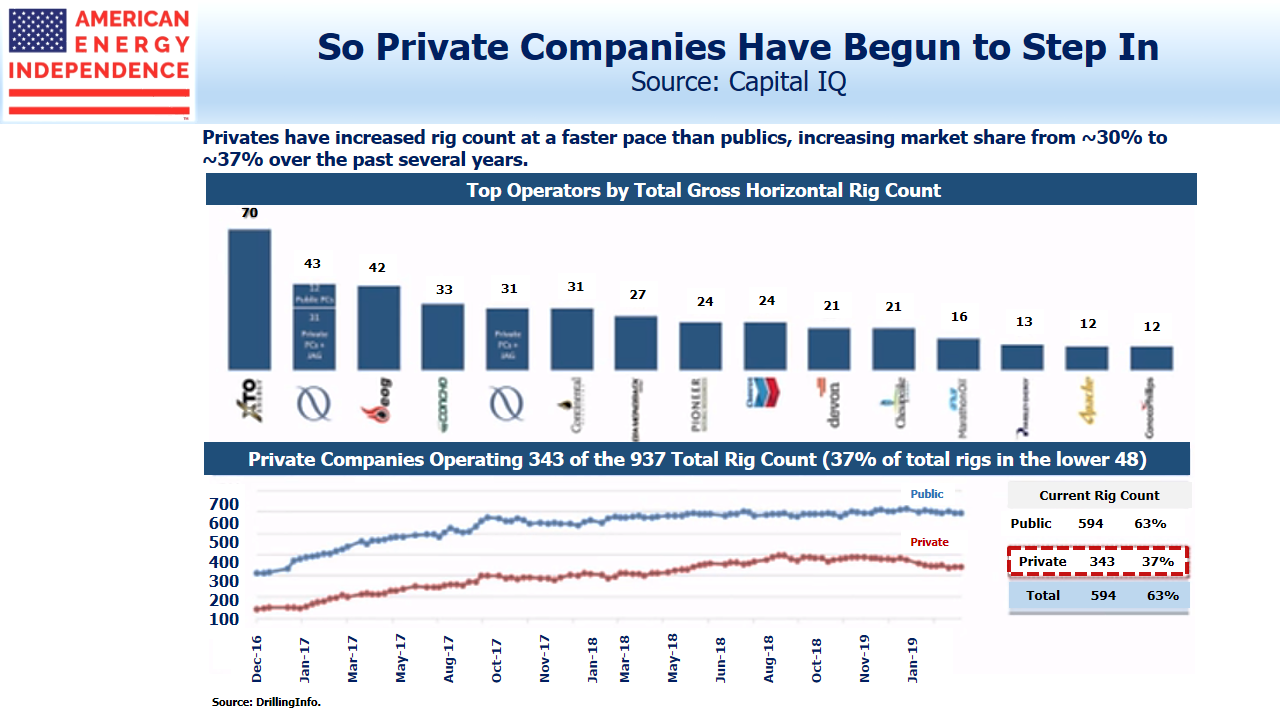
The industry’s operating efficiencies are well known. Capex per well has been declining while output has soared. Pad drilling has brought scale and corresponding efficiencies, with rig productivity up 6X in the last five years. Since 2010, acquisition and development of shale resources by PE has grown from 10% to over half the total. PE rig count is estimated at 37%, up from 20% six years ago.

.avia-image-container.av-7f3b0x-83bc3f107e84c67f138645c46c74ded3 img.avia_image{ box-shadow:none; } .avia-image-container.av-7f3b0x-83bc3f107e84c67f138645c46c74ded3 .av-image-caption-overlay-center{ color:#ffffff; }

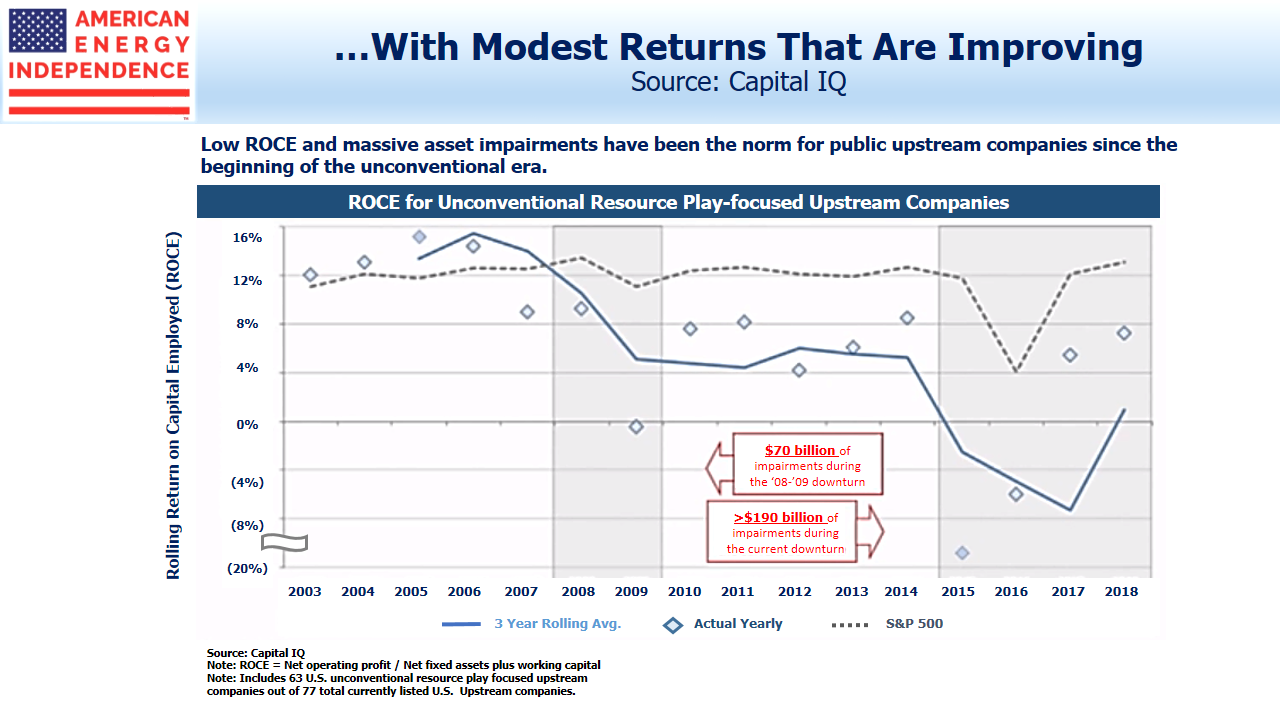
ROCE for Upstream E&P Companies

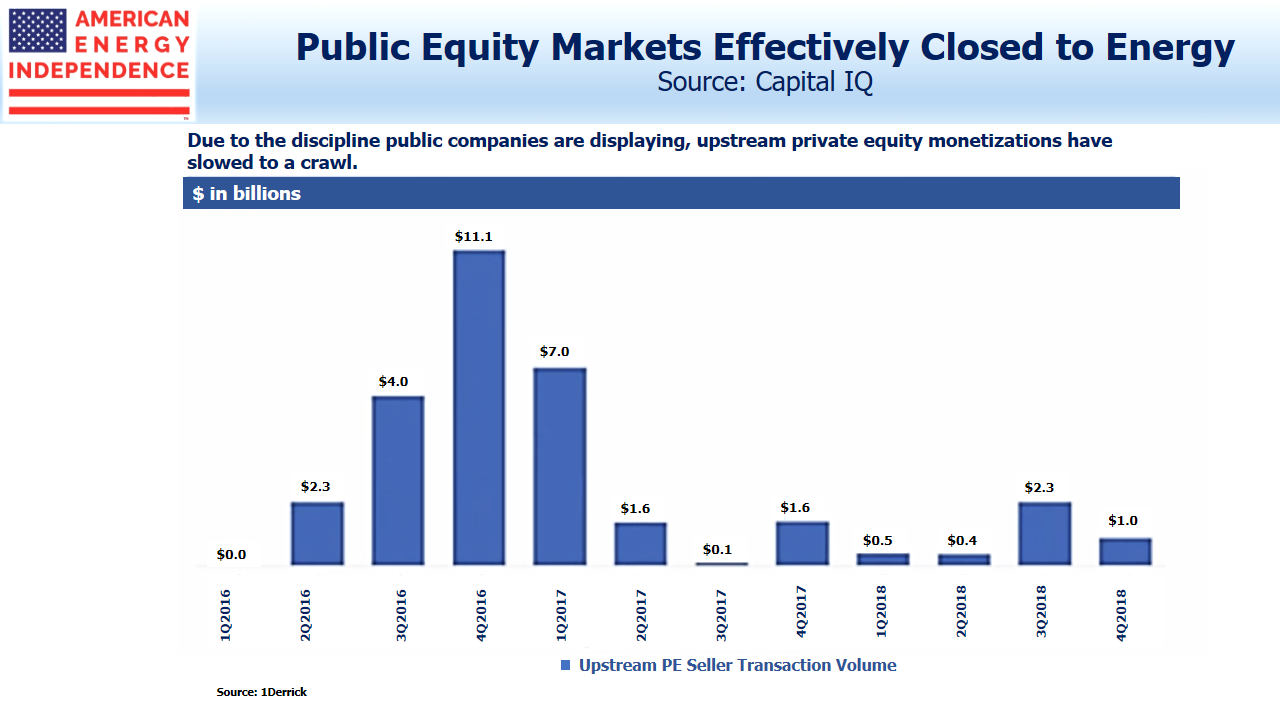
Nonetheless, the shrinking of the public equity investor appetite for energy has impacted PE, because it’s constrained their ability to exit via a sale of assets to a publicly traded company, or via an IPO. There were no MLP IPOs last year, illustrating that the public equity markets are closed to energy companies. So PE holding periods have gone from 2-4 years to 4-7.

.avia-image-container.av-1jkrfg1-533aa5556c22516192ea39932a848c65 img.avia_image{ box-shadow:none; } .avia-image-container.av-1jkrfg1-533aa5556c22516192ea39932a848c65 .av-image-caption-overlay-center{ color:#ffffff; }

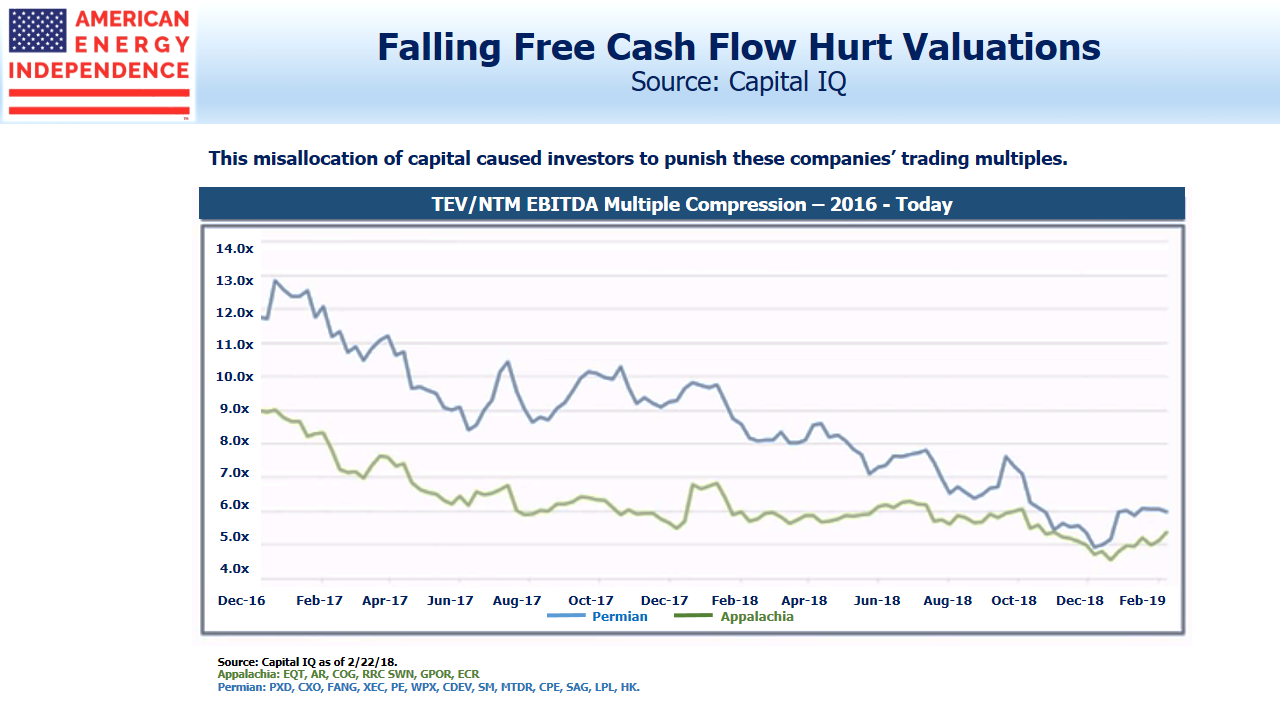
Falling Free Cash Flow Hurts Valuations

Meanwhile, public companies are responding to calls for greater cash flow discipline by moderating growth capex and redirecting more cash back to investors through dividend hikes and buybacks. There are also signs that capex plans now adjust more quickly to altered circumstances than in the past. Several upstream companies lowered their planned spending during 4Q18 as oil slumped.

On the midstream side, Magellan Midstream (MMP) recently have shelved an expansion project because of insufficient shipper demand. Several projects are planned to increase capacity for the largest crude tankers, which require deepwater ports offshore. Perhaps concerned about overcapacity, Kinder Morgan pulled out of a JV with Enbridge to develop a deep water crude oil export facility, although the project is still expected to proceed.

.avia-image-container.av-1a2wbw1-1acff8eaa47bd5a5ed5ff546a03ab2d5 img.avia_image{ box-shadow:none; } .avia-image-container.av-1a2wbw1-1acff8eaa47bd5a5ed5ff546a03ab2d5 .av-image-caption-overlay-center{ color:#ffffff; }

A consequence of this new capital discipline is that public companies’ criteria for buying assets from PE owners include that they be FCF-positive, so as to maintain promised cash returns to stockholders. A positive NPV is no longer enough, which is forcing PE investors to develop their assets more fully than expected, taking up more time and capital.

.avia-image-container.av-qqugk1-5daa86b4470e4eb22d9f31fed7f61fa2 img.avia_image{ box-shadow:none; } .avia-image-container.av-qqugk1-5daa86b4470e4eb22d9f31fed7f61fa2 .av-image-caption-overlay-center{ color:#ffffff; }

Infrastructure funds, which often include midstream energy infrastructure in their mandate, raised a record $88BN in 2018, up from $75BN in 2017.  PE investors have been active in the pipeline sector. Blackstone invested almost $5BN in two deals with Targa Resources (TRGP) and Tallgrass (TGE). Funds managed by Carlyle, Stonepeak and Arclight have also committed capital.

Although the 2014-16 MLP price collapse continues to haunt investors, there is a chronic shortage of assets that can generate stable cashflows over two decades or more. The recent drop in U.S. ten year yields to 2.4% is one example. Ten year German Bund yields are negative again, and French oil giant Total issued perpetual bonds at 1.75%. PE investors buying infrastructure understand this better than public markets, and a publicly owned pipeline with a distributable cash flow yield above 10% looks like a mispriced asset. It’s why we think the sector has substantial room to appreciate.

SL Advisors is the sub-advisor to the Catalyst MLP & Infrastructure Fund.  To learn more about the Fund,  please click here.

SL Advisors is also the advisor to an ETF (USAIETF.com).


Bond Market Corrects Fed

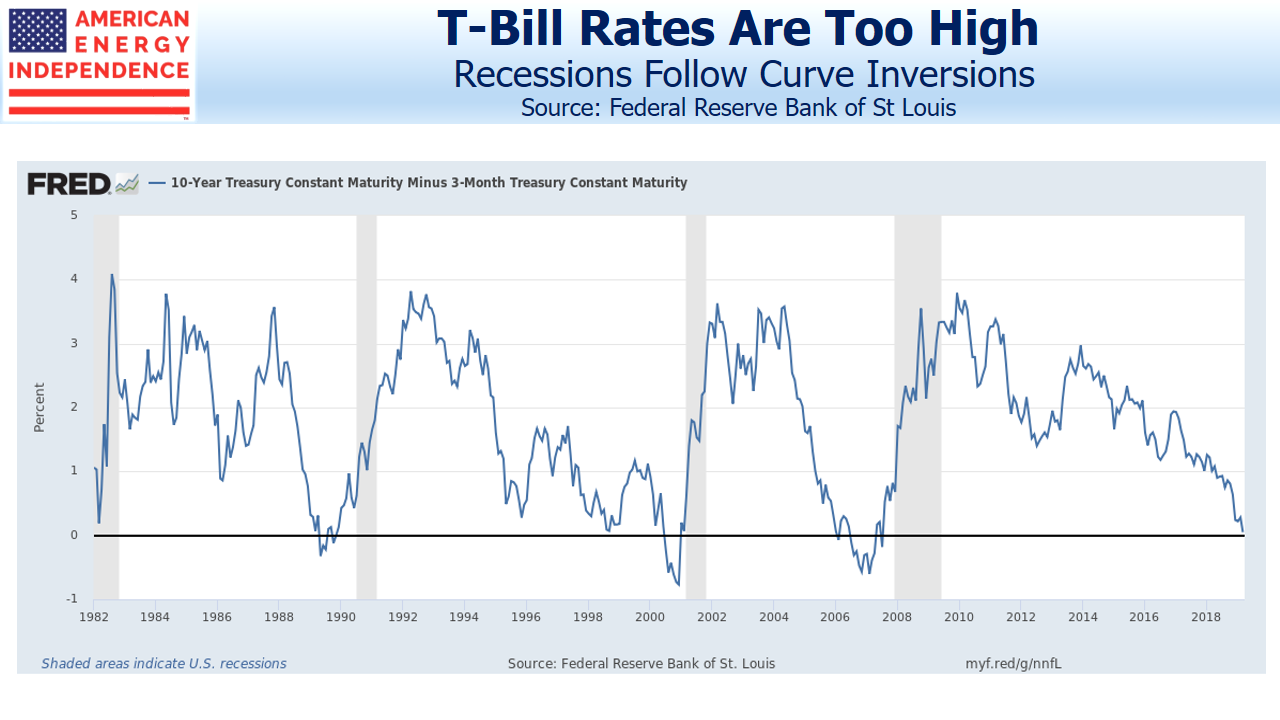
Last week stocks shuddered as ten year yields dipped below treasury bills, reminding investors that yield curve inversions eerily precede recessions. A Cleveland Fed model using the yield curve gives a 30% probability of a recession within a year, up from 24% in December. Nonetheless, the S&P500 is within 5% of its all-time high, reflecting only modest concern.

.avia-image-container.av-va9y3c-f50ce11b946fb27b38ba3ccfdcd643e9 img.avia_image{ box-shadow:none; } .avia-image-container.av-va9y3c-f50ce11b946fb27b38ba3ccfdcd643e9 .av-image-caption-overlay-center{ color:#ffffff; }

Recessions Follow Curve Inversions

A reliable point of agreement with any 15+ year market veteran is surprise at consistently low long term interest rates. We’ve all spent our entire careers fretting over the Federal deficit and the possibility that it could drive borrowing costs higher. Now it looks as if the peak in ten year yields for this cycle of 3.2% is lower than the prevailing yield prior to the 2008 recession.

Explanations include foreign central bank buying, even while the Fed unwinds its quantitative easing by allowing its balance sheet to shrink. And U.S. yields of 2.4% remain rich by comparison with other G-7 nations. Germany’s recently turned negative, along with $10TN of government debt globally.

There’s been a fundamental shift in the demand for long term bonds. Foreign buyers hold $6 TN of treasuries, around 39% of what’s publicly held. Japan and China each hold over $1 TN. Even though foreign central banks are regarded as price-insensitive buyers of bonds, that still leaves a lot of commercially driven holders who have accepted today’s low yields by choice.

Historically, the long term real return on ten year notes is 2%. The Fed’s inflation target has never wavered from 2%, and there’s been little reason for investors to anticipate anything less. 2% inflation plus a 2% historic real return implies 4% as neutral, a level never broached in the past decade.

Since the ten year treasury yield reflects the market’s forecast of short term rates over the next decade, the conclusion is that the Fed’s equilibrium short term rate is lower than in the past.

The FOMC has turned out to be very poor at predicting the near term path of short term rates, even though they control them (see Bond Market Looks Past Fed). Short term treasury yields have consistently been below the “blue dots” in the FOMC projection materials. Forecasting the Fed’s moves by looking at the yield curve has been more reliable than listening to the Fed.

The central tendency of the Fed Funds rate (i.e. long term neutral rate) in the latest FOMC projection materials is 2.5-3.0%. Their target for next year is 2.9-3.4%. These are both too high and likely to be wrong again. Rather than the inverted yield curve forecasting a recession, it’s more likely that the market is correcting FOMC forecasts farther out along the curve. Maybe the FOMC should give up forecasting altogether, and simply set the Fed Funds rate at 0.25% below the ten year, allowing the market to determine the appropriate level of rates.

The curve inversion isn’t forecasting a recession, it simply means the FOMC has set the Fed Funds rate too high. The more it inverts, the more wrong they are. The best response is to alter the yield curve’s forecast, by lowering short term rates. That’s their likely next move, although for now they’re on hold.

The flat yield curve is good news for energy infrastructure. We’re often asked how we think the sector will perform in an environment of higher rates. While we typically note the inflation-plus pricing built into many pipeline contracts, falling long term yields can only make MLPs and energy infrastructure corporations’ dividend yields even more attractive. There’s one less thing to worry about.

SL Advisors is the sub-advisor to the Catalyst MLP & Infrastructure Fund.  To learn more about the Fund, please click here.

SL Advisors is also the advisor to an ETF (USAIETF.com)


A Slogan Not Science

JPMorgan’s recent Eye on the Market: Energy Outlook 2019 is the best analysis we’ve seen of the Green New Deal (GND). Author Mike Cembalest, whom I know from when I worked there, as always takes a balanced approach supported by insightful research.

Cembalest breaks down the challenge aided by figures and charts to pick the GND apart. Suppose for example, by 2030 the U.S. achieved:

  • Primary energy use back to 1988 levels
  • 11X more solar generation
  • 5X more wind
  • 90% decline in coal use
  • 40-50% of passenger cars being electric (today 1-2%)

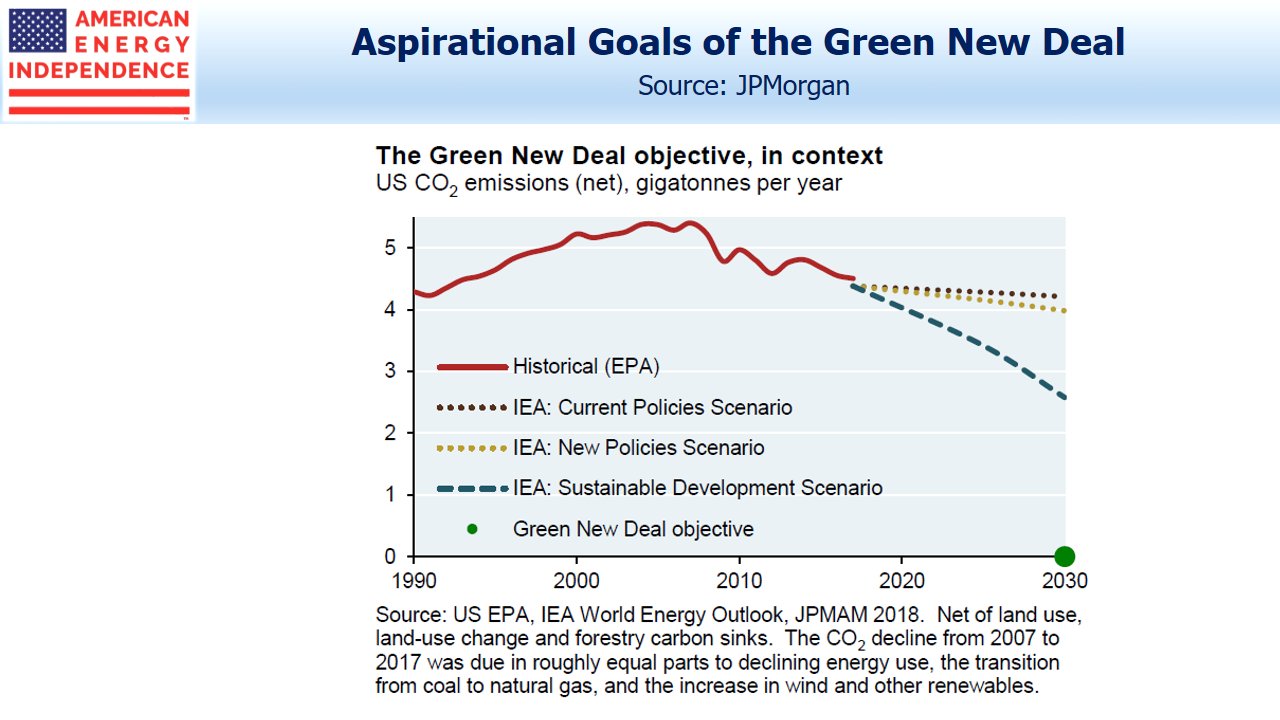
These and related objectives would represent a “Herculean effort” that is unfathomable over the next decade. Even with the necessary political and public support, this would be a path to a 40% drop in CO2 emissions by 2040, versus the GND’s goal of 100% by 2030. If anything, the GND’s unattainability should drive support for significant spending on flood remediation projects, as Cembalest suggests.

.avia-image-container.av-2193irn-b80e6eb1d57e66172f0c1eb5ddda76e8 img.avia_image{ box-shadow:none; } .avia-image-container.av-2193irn-b80e6eb1d57e66172f0c1eb5ddda76e8 .av-image-caption-overlay-center{ color:#ffffff; }

Aspirational Goals of the Green New Deal

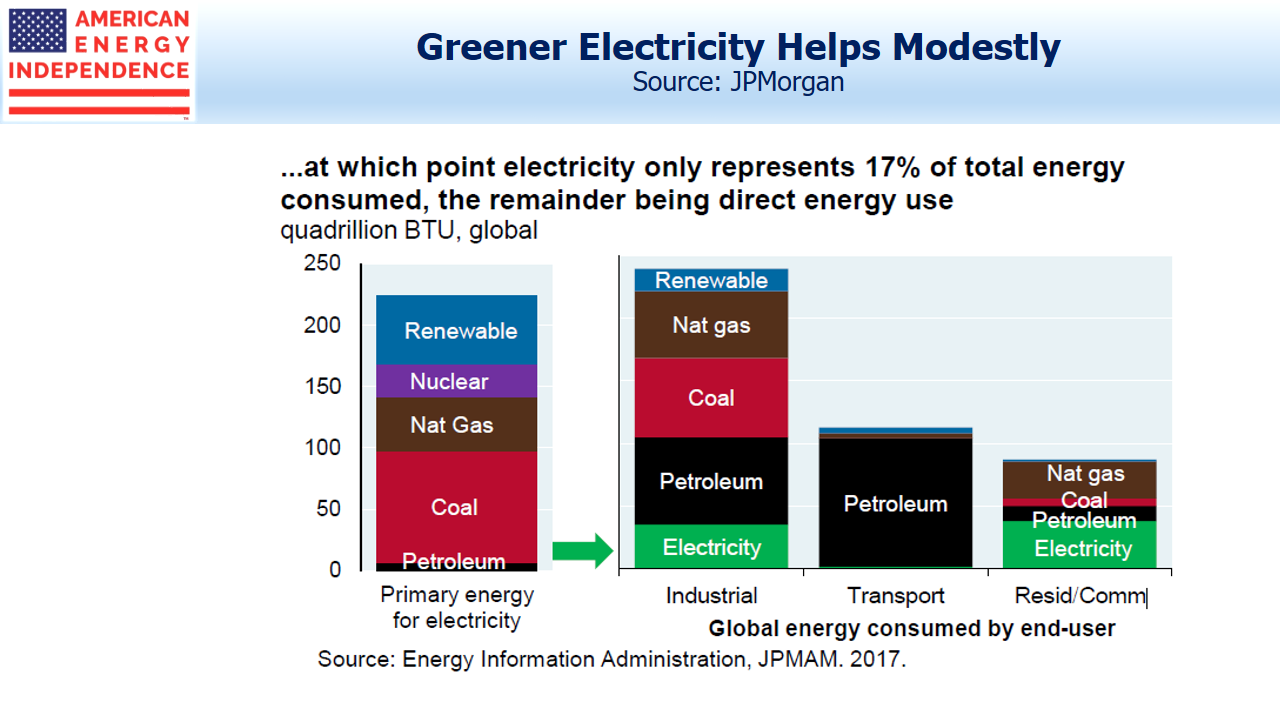
The conversion of electricity generation to solar and wind receives lots of attention. But electricity represents only 17% of primary energy use. A sobering related statistic is that 2/3rds of the primary energy used to generate electricity (coal, natural gas, renewables etc.) gets lost through thermal conversion, power plant consumption and transmission.

.avia-image-container.av-1icxxab-ae8940f0b707b35ffa86e745650e51ad img.avia_image{ box-shadow:none; } .avia-image-container.av-1icxxab-ae8940f0b707b35ffa86e745650e51ad .av-image-caption-overlay-center{ color:#ffffff; }

Greener Electricity Helps Modestly

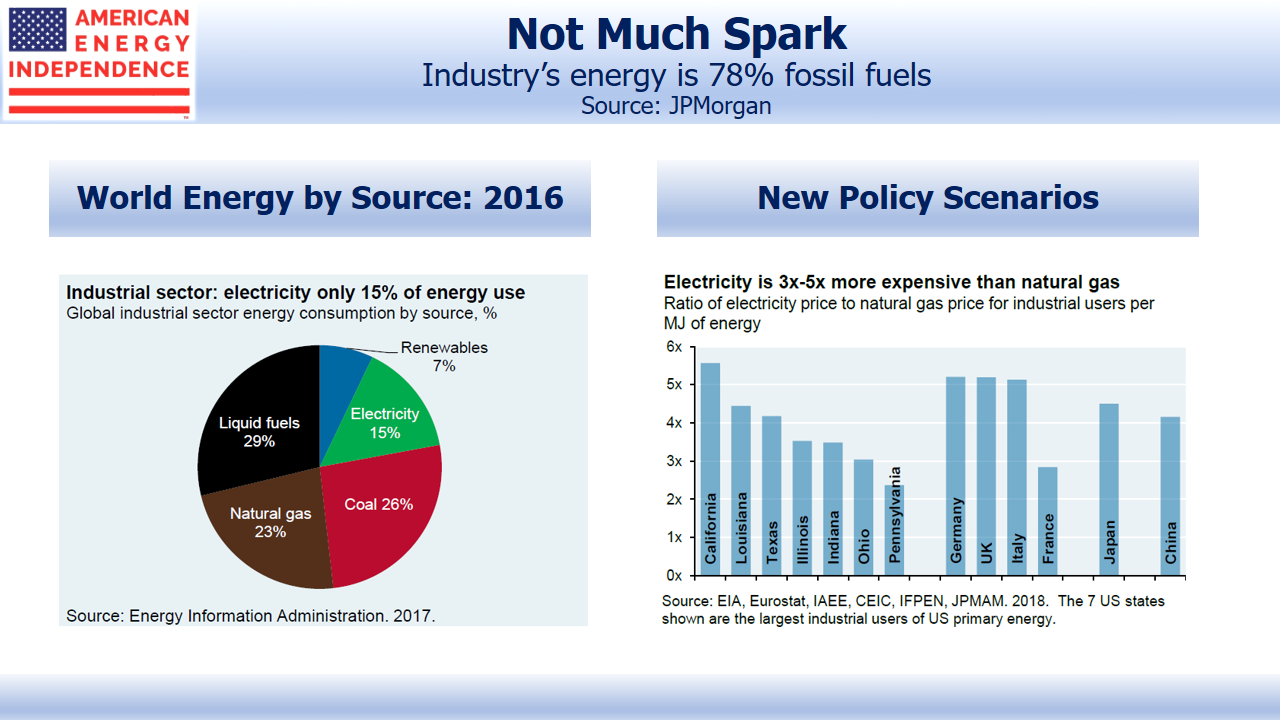
The three big end user sectors of energy are industry, transport and residential/commercial buildings. Industry is more than half – production of cement, steel, ammonia and plastics are the “four pillars of modern society.” Many industrial processes require high heat and temperature, and while electricity can theoretically replace natural gas, it’s 3-5X more expensive. Moreover, that’s based on today’s electricity, which is itself 2/3rds derived from fossil fuels. A 100% renewable electricity supply would be even less competitive.

.avia-image-container.av-16odbk3-81ee34201b29318b65d95ff1faf233b4 img.avia_image{ box-shadow:none; } .avia-image-container.av-16odbk3-81ee34201b29318b65d95ff1faf233b4 .av-image-caption-overlay-center{ color:#ffffff; }

Fossil Fuels Are Industry's Main Energy Source

Lowering greenhouse gases globally can’t happen without China’s active participation. They produced more than half of the world’s cement in 2017, half the steel, and a third of the ammonia, all substantially used domestically. 85% of ammonia is used in fertilizer, without which the world could only feed half its current population. 40-70% of ammonia used in fertilizer is lost due to leaching or erosion. Its production causes 1% of global Greenhouse Gases (GHGs).

The world currently generates around 34 gigatonnes of CO2 annually (a gigatonne is a billion tonnes). The International Energy Agency (IEA) expects global GHGs to increase by a third over the next two decades with unchanged policies. Rising living standards in emerging economies, led by China and India, will swamp greater energy efficiencies in the developed world. Use of plastics (produced with methane, naphtha and ethane) is forecast to rise by 150% over the next thirty years.

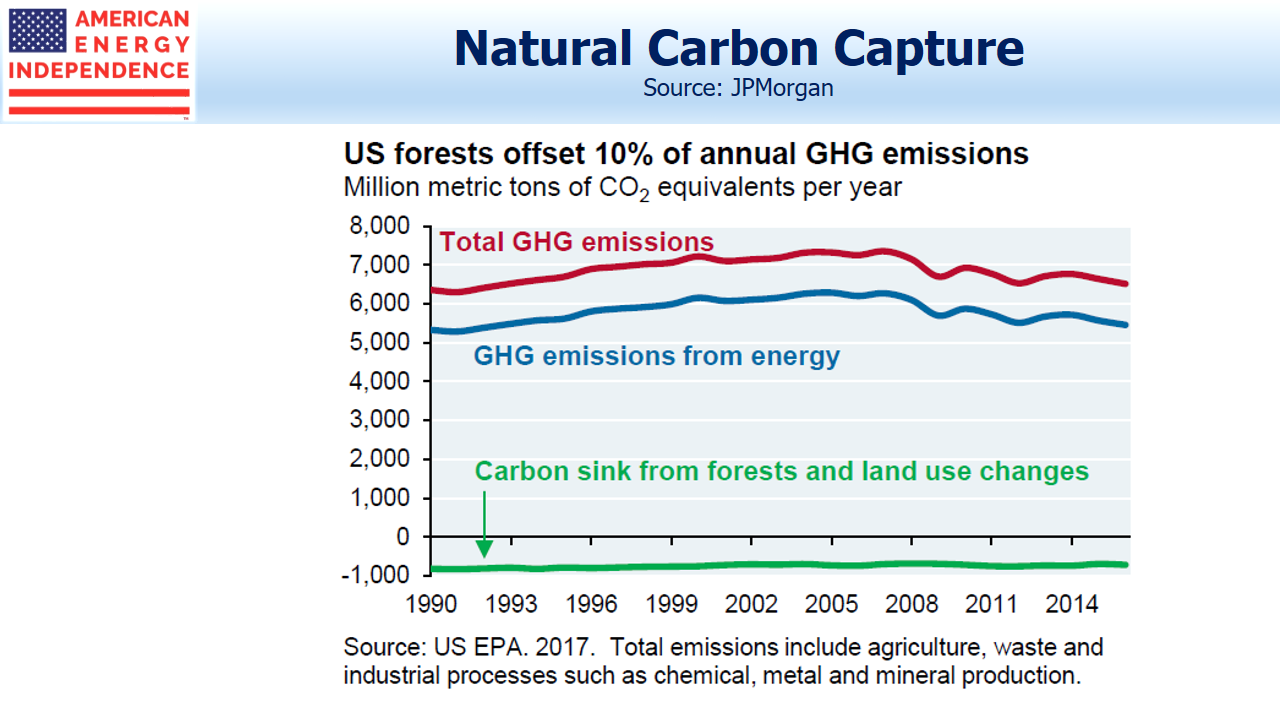
The GND promotes planting more trees. U.S. forestland of 750 million acres captures 10% of emissions. A 2017 study found that replanting trees on 20 million acres of cleared land could offset almost 1% of U.S. GHGs. This would be challenging; current U.S. Forest Service efforts are 120 thousand acres, around 0.5%.

.avia-image-container.av-v932v7-c27b94cb00ad76ef1cb4561e92cd9287 img.avia_image{ box-shadow:none; } .avia-image-container.av-v932v7-c27b94cb00ad76ef1cb4561e92cd9287 .av-image-caption-overlay-center{ color:#ffffff; }

Natural Carbon Capture_U.S. Forests

Germany’s “Energiewende” has impressively lifted their renewable share of electricity generation to 38%. However, emission reductions are disappointing. Phasing out of nuclear power, and renewables intermittency (it’s not always sunny and windy) have increased use of coal. Further use of wind requires substantial investment in transmission infrastructure to link the windy north with population centers in the south.

The report is full of fascinating facts like these. Vaclav Smil is JPMorgan’s technical advisor. Smil is the author of 40 books, such as Energy and Civilization: A History. He’s a highly regarded thinker and his writings on energy development and use are absorbing. Smil, who is Bill Gates’ favorite author, describes the GND as “…not a useful foundation for a serious policy discussion.”

Energy Outlook 2019 ranks among Mike Cembalest’s best pieces of work. It’s highly readable.

SL Advisors is the sub-advisor to the Catalyst MLP & Infrastructure Fund.  To learn more about the Fund, please click here.

SL Advisors is also the advisor to an ETF (USAIETF.com)


Webinar: The Shale Revolution: Where’s All This Production Going?

.flex_column.av-jjrmf7ps-c67a8c8c03a15c49af60226d5c45e3c8{ border-radius:4px 4px 4px 4px; padding:10px 10px 10px 20px; background:url(https://sl-advisors.com/wp-content/uploads/2018/07/HOME-BGBANNER-hero.jpg) 0% 0% no-repeat scroll ; }

AMERICA IS IN THE MIDST OF AN ENERGY REVOLUTION.

By capitalizing on American technology, ingenuity, and frontier spirit, the Shale Revolution—driven by horizontal drilling and fracking—is turning the world’s energy markets upside down.


#top #wrap_all .avia-button.av-4wqy6e-4c08ee8d8c803daa5c808a3a051a78a4{ margin-bottom:20px; margin-right:10px; margin-left:10px; } ETF #top #wrap_all .avia-button.av-bfwfb-1e3addcf37f1ad9c5f4de238b8677652{ margin-bottom:20px; margin-right:10px; margin-left:10px; } Mutual Fund

#top .hr.hr-invisible.av-jjkejdzy-45d69def6fcd4634d81723d4107c2a5c{ height:50px; }

Webinar: The Shale Revolution: Where’s All This Production Going?

.avia-video.av-jlcbu1ku-f118a8296bbc3dc97e81be19efdd03c2{ background-image:url(https://sl-advisors.com/wp-content/uploads/2019/03/Webinar-thumbnail.png); }


Deja Vu All Over Again for Pipelines?

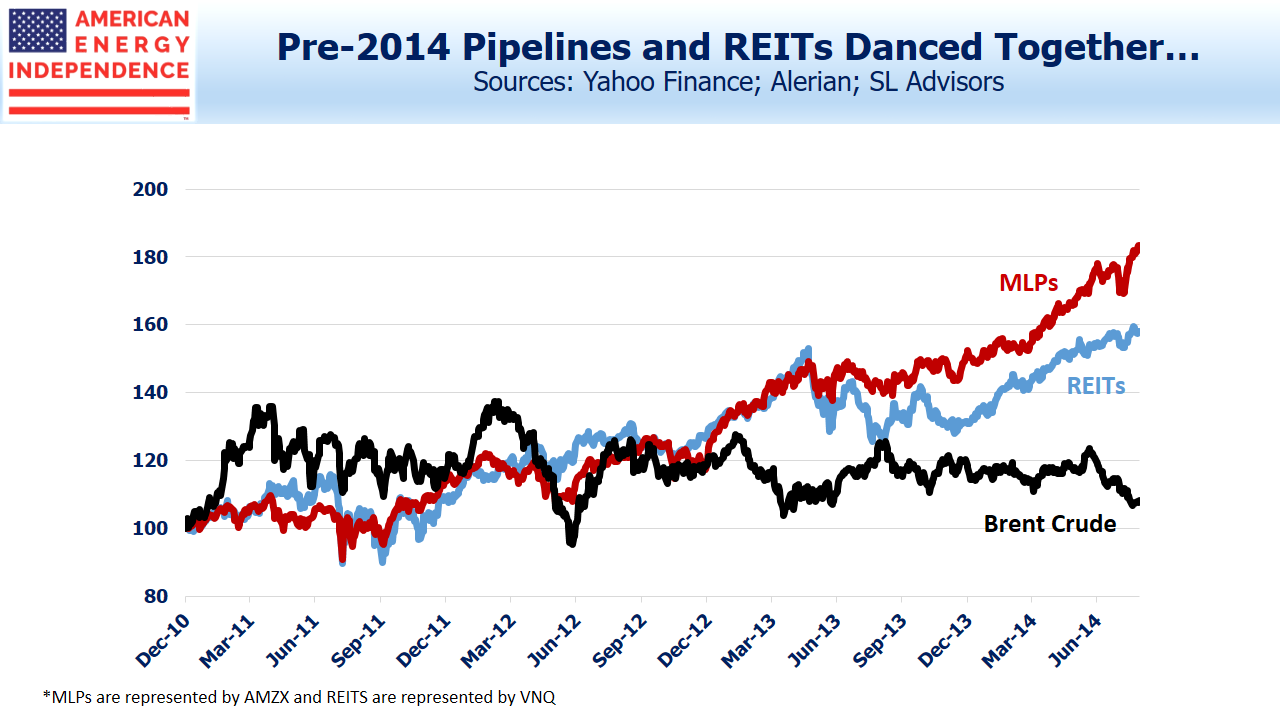
Years ago, before the Shale Revolution became the phenomenon it is, comparisons were often made between MLPs and REITs. Both offered attractive yields from real assets, and income-seeking investors were drawn to them.

As a result, their performance tracked each other pretty closely. Investors focused on the relative value of one versus another generally kept them in line. This was the period when pipelines earned their reputation as “toll-models”, driven by volumes with little relationship to crude oil.

.avia-image-container.av-4i4l0m-ba478f218119ba13dd988ae8793a26be img.avia_image{ box-shadow:none; } .avia-image-container.av-4i4l0m-ba478f218119ba13dd988ae8793a26be .av-image-caption-overlay-center{ color:#ffffff; }

REITS and Pipelines Move Together

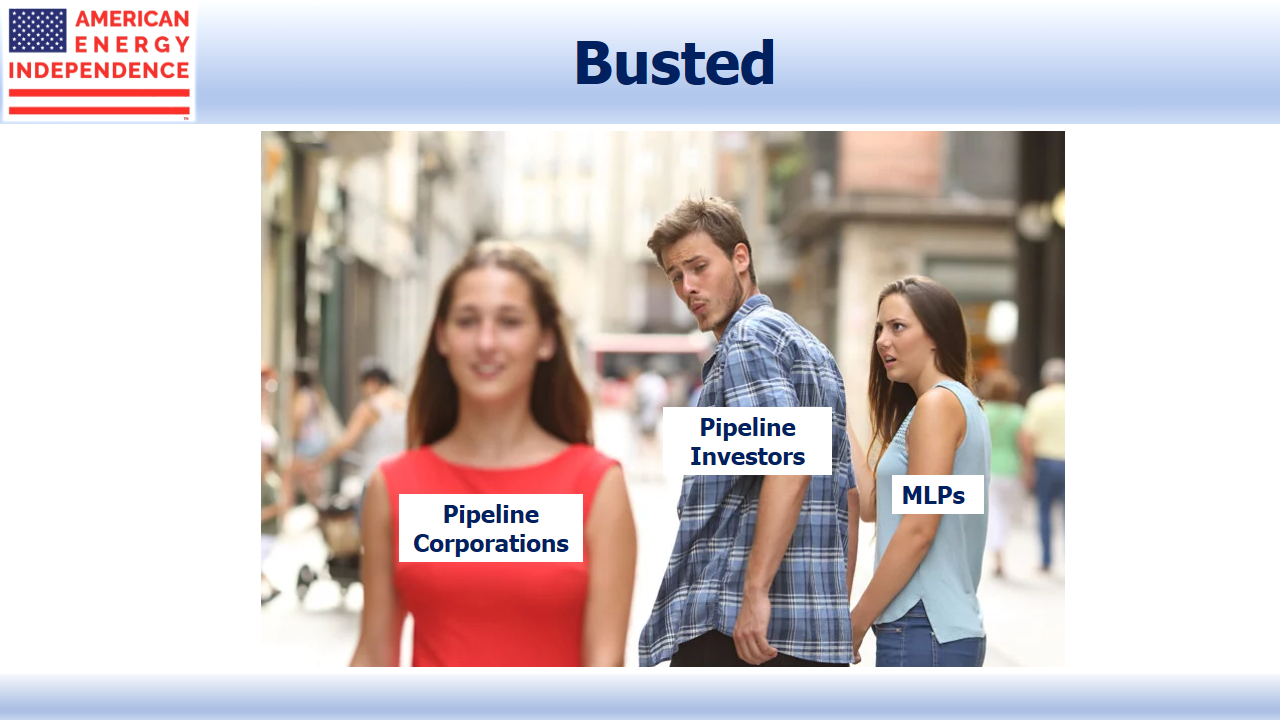
Long-time investors in energy infrastructure fondly remember those days and many retain mixed feelings about America’s resurgence in oil and gas production. MLPs embraced growth projects, and payouts to investors soon suffered.

It’s worth recalling the pre-2014 era, because pipeline stocks are resuming dividend growth once again. The growing realization has already led to a strong start to 2019, with the sector up almost 20%. Comparisons with REITs or utilities made little sense for investors seeking income when MLP income was uncertain. The 36% drop in payouts from the Alerian MLP ETF (AMLP) reflect a big betrayal, but not a collapse in the business. Nonetheless, as we’ve often found when talking to investors, distribution cuts for any reason tend to drive them away.

Enterprise Products (EPD) CEO Jim Teague reflected the mood when he recently said, “So many of these guys cut their distributions. I wouldn’t buy their stock either.” Reliable payouts matter.

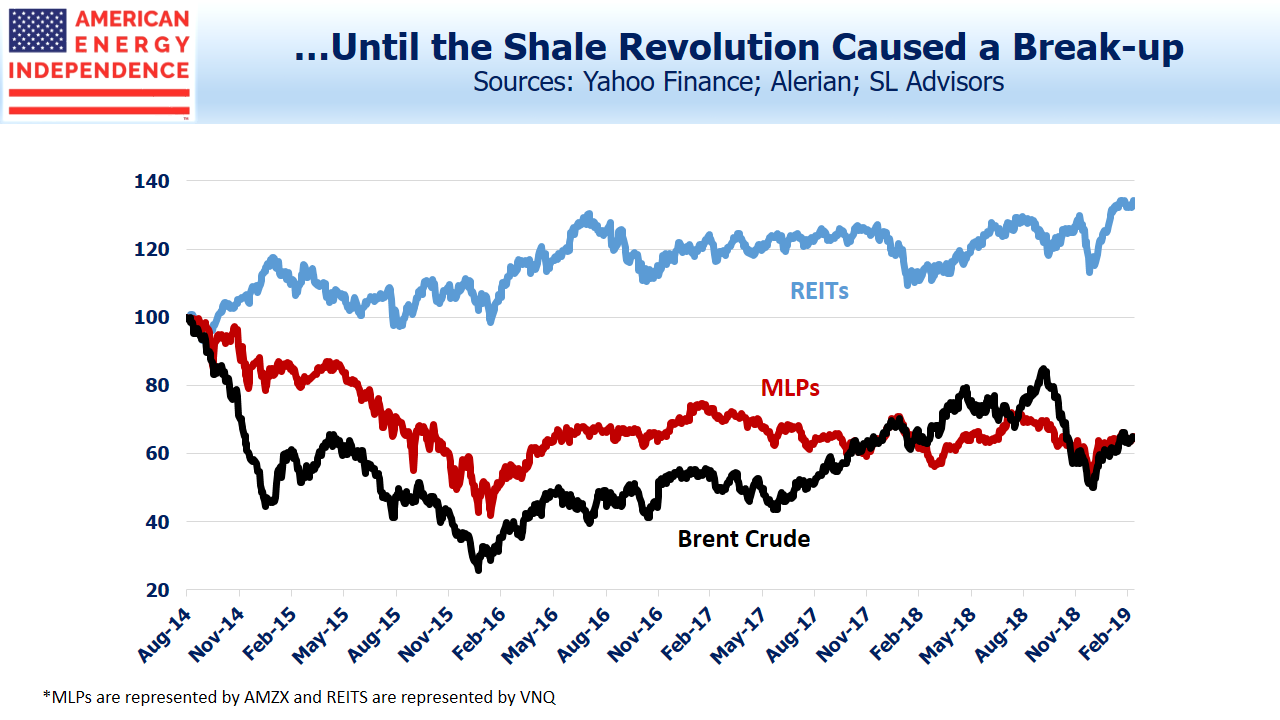
Since 2014 MLPs and REITs have maintained a loose relationship, and although the economic link between crude oil and pipeline company profits is generally weak, at times they have been manacled together. Some investors will ruefully add that the link is strongest when crude oil is falling.

.avia-image-container.av-kxr0ue-3db5d85d37d3965f8fc9ff355dda54d0 img.avia_image{ box-shadow:none; } .avia-image-container.av-kxr0ue-3db5d85d37d3965f8fc9ff355dda54d0 .av-image-caption-overlay-center{ color:#ffffff; }

REITS and Pipelines Part Ways

Rising pipeline distributions reflect an acknowledgment of investors’ requirement for greater capital discipline with predictable payouts. Growth capex for the industry was $55BN last year and looks likely to be lower this year, freeing up cash. Several big projects are nearing completion, which will further support cashflows.

Internally funded growth is the new normal. The older, wealthy Americans who are the main direct investors in MLPs have demonstrated resoundingly that they don’t want to finance growth. It’s why there were no MLP IPOs last year. Leverage is down to 4X Debt:EBITDA.

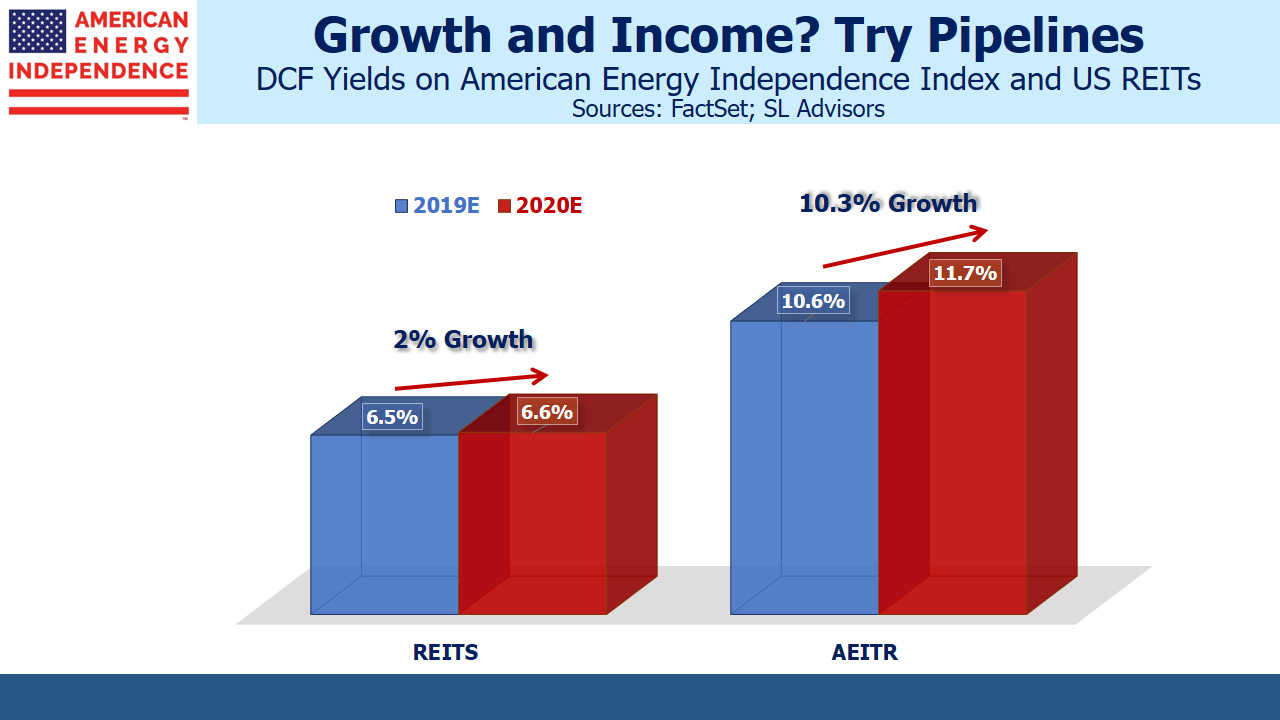
Energy infrastructure stocks offer compelling value versus REITs. Distributable Cash Flow (DCF) yields of 10-11% are growing 10% annually in the broad-based American Energy Independence Index (this is 80% corporations and 20% MLPs). REITs offer yields from Funds From Operations (cash generated from existing assets before growth capex, similar to pipeline companies’ DCF) of around 6% with little growth.

.avia-image-container.av-16y6z0m-962aa9dfe5087191050483d83d7ea46b img.avia_image{ box-shadow:none; } .avia-image-container.av-16y6z0m-962aa9dfe5087191050483d83d7ea46b .av-image-caption-overlay-center{ color:#ffffff; }

DCF Yields REIT vs AEITR

Income stability should draw more REIT investors to consider pipelines, which will restore the close relationship the two sectors shared for many years. This in turn will further weaken the link to crude oil.

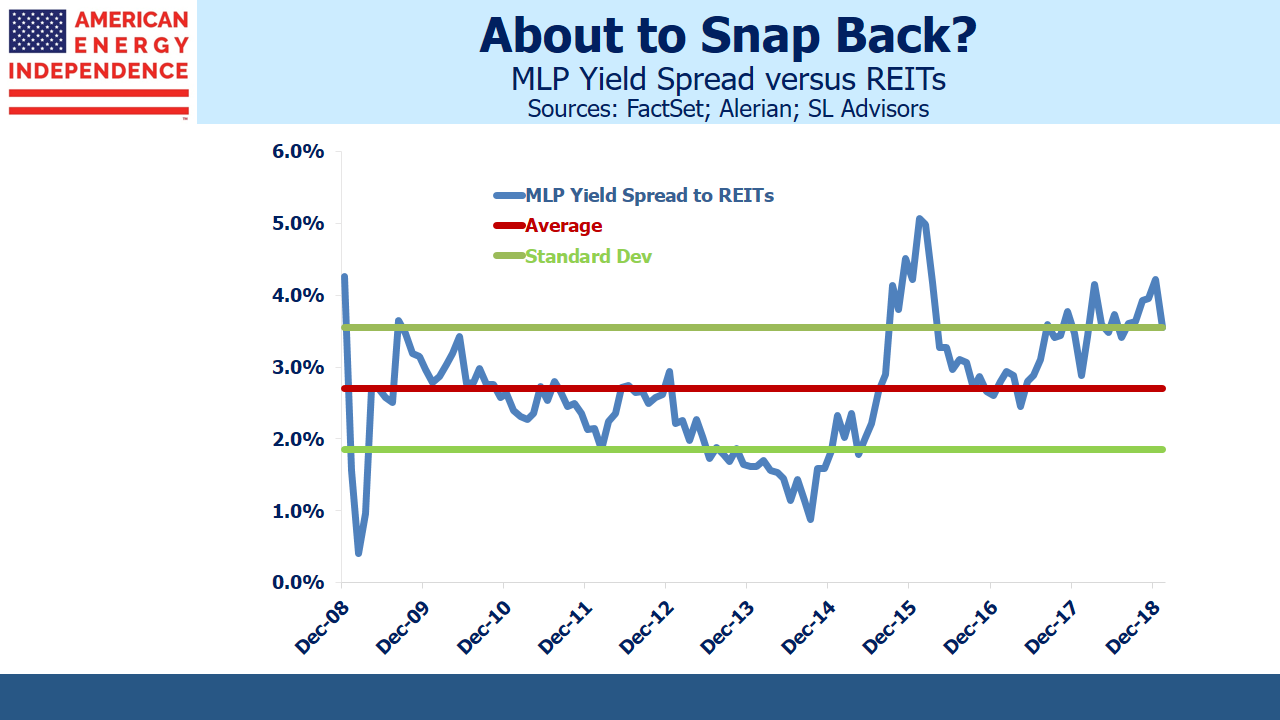
.avia-image-container.av-r6v0o6-1c571994b0aa40fde3d506281c83cf3a img.avia_image{ box-shadow:none; } .avia-image-container.av-r6v0o6-1c571994b0aa40fde3d506281c83cf3a .av-image-caption-overlay-center{ color:#ffffff; }

MLP Yield Spread vs. REITS

The energy sector’s collapse in 2014-16 caused MLPs to fall more than they did during the 2008-9 financial crisis. Memories of that episode remain fresh, but many signs suggest that the stability of earlier years is returning.

Join us on Thursday, March 21st at 1pm EST for a webinar. We’ll review the prospects for continuing growth in US oil and gas production. To register please click here.

We are invested in EPD and short AMLP.

SL Advisors is the sub-advisor to the Catalyst MLP & Infrastructure Fund.  To learn more about the Fund, please click here.

SL Advisors is also the advisor to an ETF (USAIETF.com)


Energy Infrastructure is Results-Based ESG

Investing based on environmental, social and governance principles (ESG) is intended to make the world a better place. It’s a loosely-used term, and definitions vary widely. Seeking companies with good governance seems so obvious that it scarcely belongs in ESG. But environmental and social principles carry the suggestion that investment return shouldn’t be the only criteria. If ESG policies were as reliably profitable as, say, intelligent capital allocation, there would be no need for their own category. Yet some argue that selecting investments based on ESG criteria delivers better results, which is a tautological argument.

ESG funds are gaining assets, thereby drawing the attention of executives. It can be amusing to watch the hoops companies jump through to claim they’re ESG-worthy. Most attention is focused on the environmental aspect, given the ongoing debate about climate change. The aspirational Green New Deal (see The Bovine Green Dream) sets such impossible objectives that even its Uber-using author AOC allows that, “Living in the world as it is isn’t an argument against working towards a better future.” (see The Green New Deal’s Denial of Science).

.avia-image-container.av-vjolei-8c8d5c1cea91ec4823f772cc1f14f236 img.avia_image{ box-shadow:none; } .avia-image-container.av-vjolei-8c8d5c1cea91ec4823f772cc1f14f236 .av-image-caption-overlay-center{ color:#ffffff; }

America Runs on Fossil Fuels

Most companies are sensibly aiming a little lower. Apple claims that their company is “globally powered by 100% renewable energy.” Such claims involve sleight of hand – since they can’t control how the electricity they use is generated, they purchase renewable credits to get their energy sums to foot. In any case, their employees mostly don’t walk or cycle to work, and iphones are made of plastic which comes from petroleum products, or (increasingly in the U.S.) ethane.

Tesla has pulled off a marketing coup by associating its electric vehicles with clean energy. Two thirds of U.S. electricity is produced from fossil fuels. Some states, such as Wyoming, rely 100% on coal because it’s locally abundant. Is a Tesla buyer in the Cowboy state helping? Does Tesla merit support from environmental activists?

Moreover, countless consumer electronics use cobalt in their batteries, the mining of which should put any ESG claim to shame.

The climate change debate is littered with good intentions and burdened with bad ideas that mostly won’t get done. Although most Americans believe humans are warming the planet, two thirds wouldn’t even pay $10 per month to combat it, a statistic that should give GND supporters with their unlimited spending goals something to consider.

Results are what count. America has achieved a 14% reduction in CO2 emissions from 2005 levels, largely through the substitution of natural gas for coal in electricity generation. America’s energy business, powered by the Shale Revolution, has achieved this, against widespread wrongheaded opposition from environmental activists. Other countries that rely more heavily on renewables, such as Germany, have moved backwards because their intermittency has increased reliance on coal. Germany’s decommissioning of its nuclear energy plants hasn’t helped.

If results matter more than intentions, America’s pipeline companies have probably contributed more to reduced emissions than any other sector. Moreover, if you supply an ESG-rated company with its energy, shouldn’t that by definition qualify the supplier to join the ESG category?

Virgin Atlantic Airlines has a sustainability program (Change is in the Air). If an airline thinks it’s an ESG member, the pipeline that delivers its jet-fuel must surely belong.

America’s energy infrastructure is boosting natural gas production, so much so that we’re increasingly exporting it. As a consequence, coal use is being constrained around the world from what it would otherwise be. This sector is leading successful efforts to fight global warming. Its ESG credentials are as strong as any.

SL Advisors is the sub-advisor to the Catalyst MLP & Infrastructure Fund.  To learn more about the Fund, please click here.

SL Advisors is also the advisor to an ETF (USAIETF.com)


Pipelines’ New Look

.avia-image-container.av-t5ali9-6cce321e9b8a0ee5b95da8d2659f62d0 img.avia_image{ box-shadow:none; } .avia-image-container.av-t5ali9-6cce321e9b8a0ee5b95da8d2659f62d0 .av-image-caption-overlay-center{ color:#ffffff; }

The point of a public equity listing is to be able to access public markets for financing, to use the stock as a currency for acquisitions, and to provide liquidity for investors. A company’s cost of equity moves inversely with its stock price, just like bond yields and prices. Access to cheap equity is vital for companies that have growth projects, including most energy infrastructure companies. MLPs continue to face a comparatively high cost of equity.

It’s one of the reasons why we believe over the past few years many of the biggest MLPs have “simplified”, which has often meant they’ve abandoned the MLP structure to become a regular corporation (a “c-corp”). An important objective behind each of these restructurings has been to lower their cost of equity. Kinder Morgan (KMI) led this move in 2014, when their desire for external capital to fund their backlog of growth projects collided with the interests of their income-seeking holders. Investors in Kinder Morgan Partners (KMP) weren’t much interested in plowing their distributions back into secondary offerings, so KMP’s yield rose to levels that made equity issuance uneconomic (see 2018 Lessons From The Pipeline Sector).

KMI decided to combine with KMP, creating unexpected tax bills for holders and leading (eventually) to two distribution cuts. The goal was to access a broader set of investors. Fewer than 10% of the money allocated to U.S. equities can invest in MLPs. Taxes and K-1s generally limit buyers to U.S. high net worth individuals. KMI wanted to reach U.S. pension funds, global sovereign wealth funds, and other significant buyers. They had outgrown the old, rich Americans, who used to own their stock. If you ever talk to a former KMP investor, you’ll learn how much bitterness this caused (see Kinder Morgan: Still Paying for Broken Promises).

Other MLPs followed, and today midstream energy infrastructure is more corporations than MLPs. The list includes Enbridge (ENB), Oneok (OKE), Pembina (PBA), Targa Resources (TRGP), Semgroup (SEMG), Transcanada (TRP) and Williams (WMB). None of these are in an MLP index.

In late 2017 we created the investable American Energy Independence Index (AEITR). It’s a market-cap weighted index of North American energy infrastructure companies. It includes some MLPs, because the structure still works for those not in need of external equity. But MLPs are kept at 20%, reflecting their diminished role.

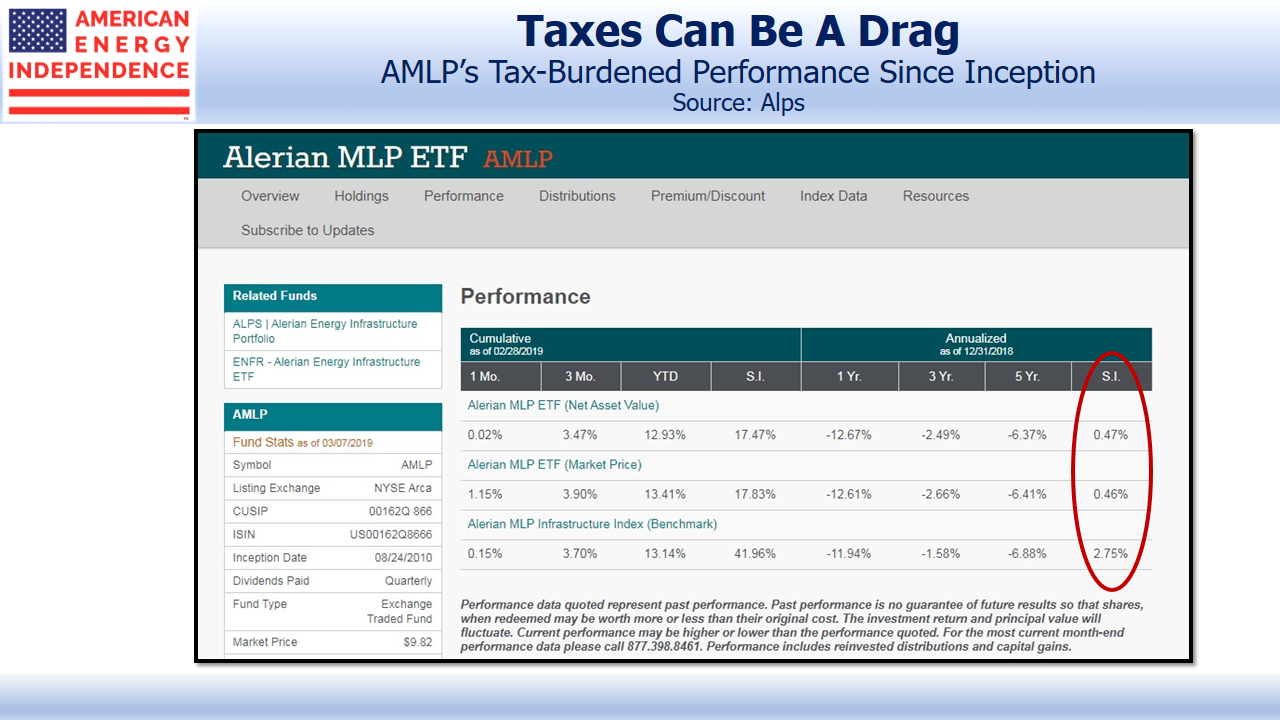
The AEITR’s limit on MLPs also means that funds linked to it aren’t subject to corporate tax. A flawed tax structure has been a substantial drag on performance for MLP-dedicated funds. For example, the Alerian MLP ETF (AMLP) has a since inception return of 0.47% p.a., compared with its index of 2.75%. It’s delivered less than a fifth of its index since 2010, in part because of a structure that requires it to pay corporate tax. Nobody would create such a fund today.

See MLP Funds Made for Uncle Sam for more detail.

.avia-image-container.av-1p853lt-3e6d6657cf0db9a4c2ad78f173316b81 img.avia_image{ box-shadow:none; } .avia-image-container.av-1p853lt-3e6d6657cf0db9a4c2ad78f173316b81 .av-image-caption-overlay-center{ color:#ffffff; }

AMLP's Tax Burdened Performance

The Alerian MLP indices are becoming outdated, because they represent what the pipeline business used to be, before MLPs started converting to corporations. An MLP-only approach to energy infrastructure misses most of the sector. MLPs aren’t going away, they’re just becoming less important.

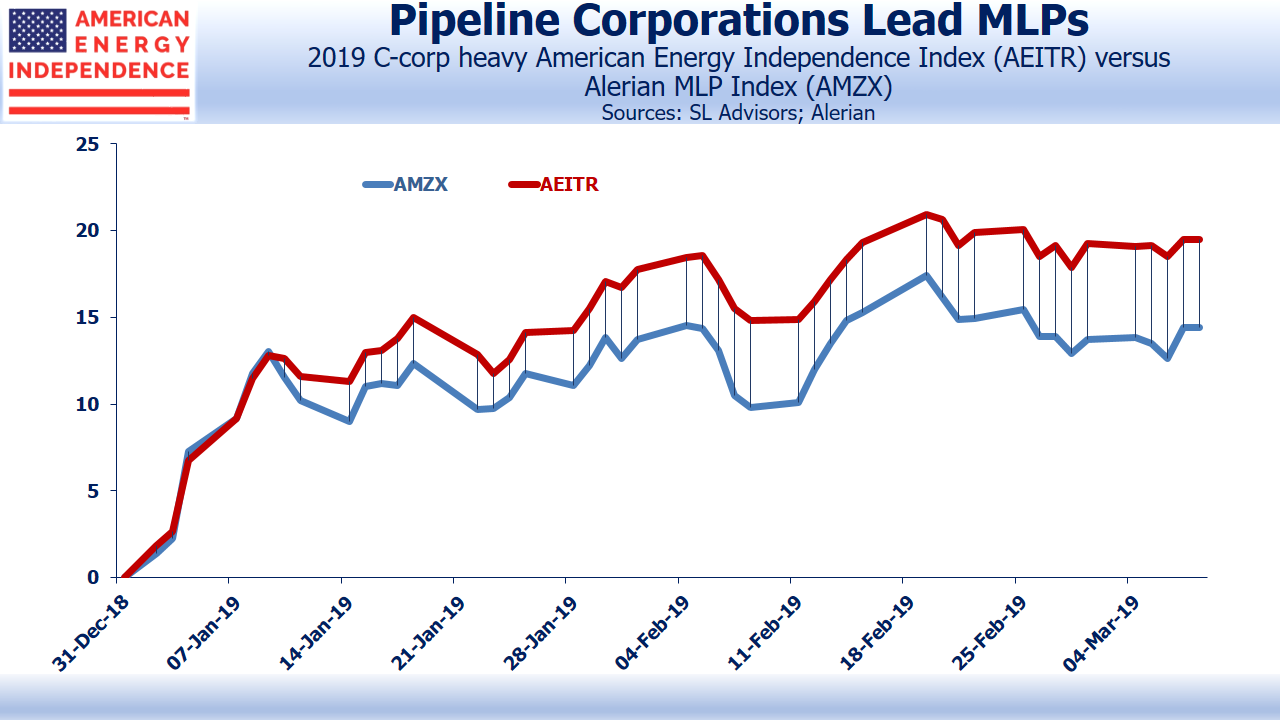
For the former MLPs who converted so as to lower their cost of capital, stock performance shows that these were good decisions. The AEITR’s 80% allocation to corporations makes it more representative than the Alerian MLP Index (AMZX). Performance differences between the two are driven by how corporations are doing relative to MLPs. This year, AEITR is 5% ahead.

.avia-image-container.av-17rb2gx-7ca24e55de06f6f7af6ee858047b0d86 img.avia_image{ box-shadow:none; } .avia-image-container.av-17rb2gx-7ca24e55de06f6f7af6ee858047b0d86 .av-image-caption-overlay-center{ color:#ffffff; }

Pipeline Corporations Outperform MLPs

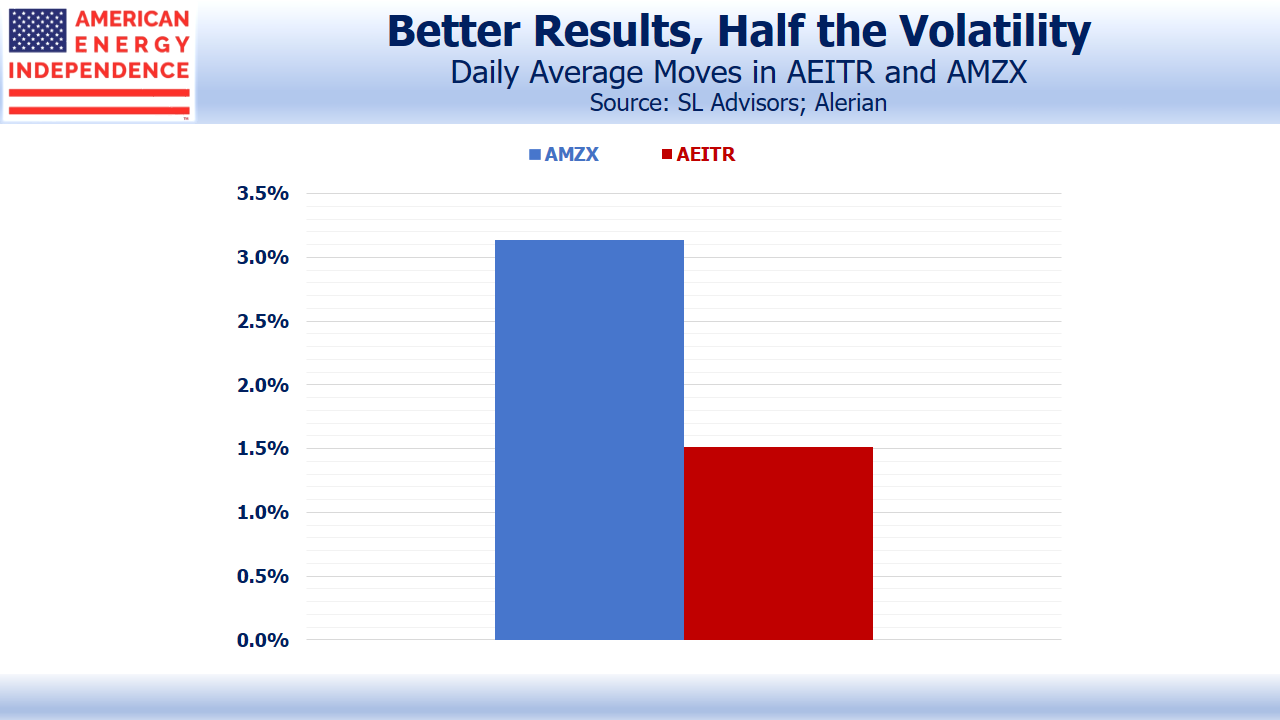
What’s also encouraging is that it’s coming with lower volatility. Since AEITR’s creation in October 2017, it has had average daily moves of 1.5%, half that of AMZX. This makes sense, because the corporations that make up 80% of AEITR have a wider pool of investors. It’s precisely why MLPs have been converting. A more diverse set of buyers means a deeper market, which lowers the risk for investors and thereby lowers the cost of capital for those companies.

.avia-image-container.av-mh26wx-e3a5672ec2e63faac5e9df4eff610507 img.avia_image{ box-shadow:none; } .avia-image-container.av-mh26wx-e3a5672ec2e63faac5e9df4eff610507 .av-image-caption-overlay-center{ color:#ffffff; }

Corporations Are Less Risky vs MLPs

So far, we haven’t heard of a company that regrets its decision to drop the MLP structure in a simplification, and those that remain get questions on every earnings call about their possible plans to simplify. There are some well run, attractive MLPs, including Enterprise Products Partners (EPD), Magellan Midstream Partners (MMP), Energy Transfer LP (ET), Western Gas Partners (WES), and Crestwood Equity Partners (CEQP). But the evidence is mounting that the adoption of a corporate structure and the global investor base that comes with it is beneficial.

We are invested in ENB, EPD, ET, KMI, MMP, OKE, PBA, SEMG, TRGP, TRP, WMB.

We are short AMLP.

SL Advisors is the sub-advisor to the Catalyst MLP & Infrastructure Fund.  To learn more about the Fund, please click here.

SL Advisors is also the advisor to an ETF (USAIETF.com)


The Green New Deal’s Denial of Science

Environmental activists who are against all fossil fuels often accuse their opponents of being “climate deniers”. They claim a scientific basis for their often extreme views, asserting that rejecting their solutions for climate change is to reject science.

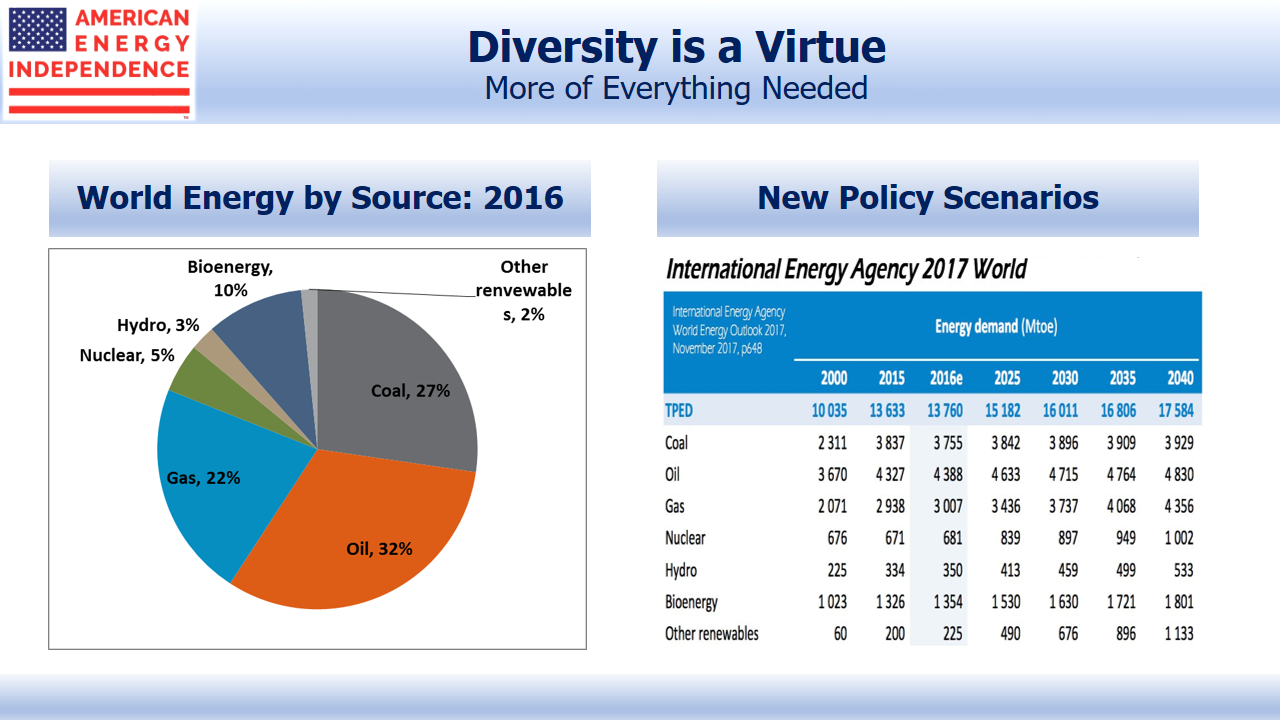
In fact, the Green New Deal (GND) and its supporters use science selectively to support their objectives and reject science where it suits them. The GND has been widely criticized for its extreme and implausible call for the elimination of fossil fuels (the House resolution calls for, “eliminating pollution and greenhouse gas emissions as much as technologically feasible” (italics added). Note there’s no mention of economic feasibility or any consideration of cost/benefit tradeoffs. It seeks, within a decade, “meeting 100 percent of the power demand in the United States through clean, renewable, and zero-emission energy sources” which isn’t technologically feasible today, and certainly is economically implausible.

.avia-image-container.av-1r0z7da-4b387d65e6cfca5f2827746e960fceaf img.avia_image{ box-shadow:none; } .avia-image-container.av-1r0z7da-4b387d65e6cfca5f2827746e960fceaf .av-image-caption-overlay-center{ color:#ffffff; }

World Energy by Source

The GND also threw in a socialist economic agenda, including a Federal job guarantee. Its critics seem far more numerous than its supporters, and include us (see The Bovine Green Dream).

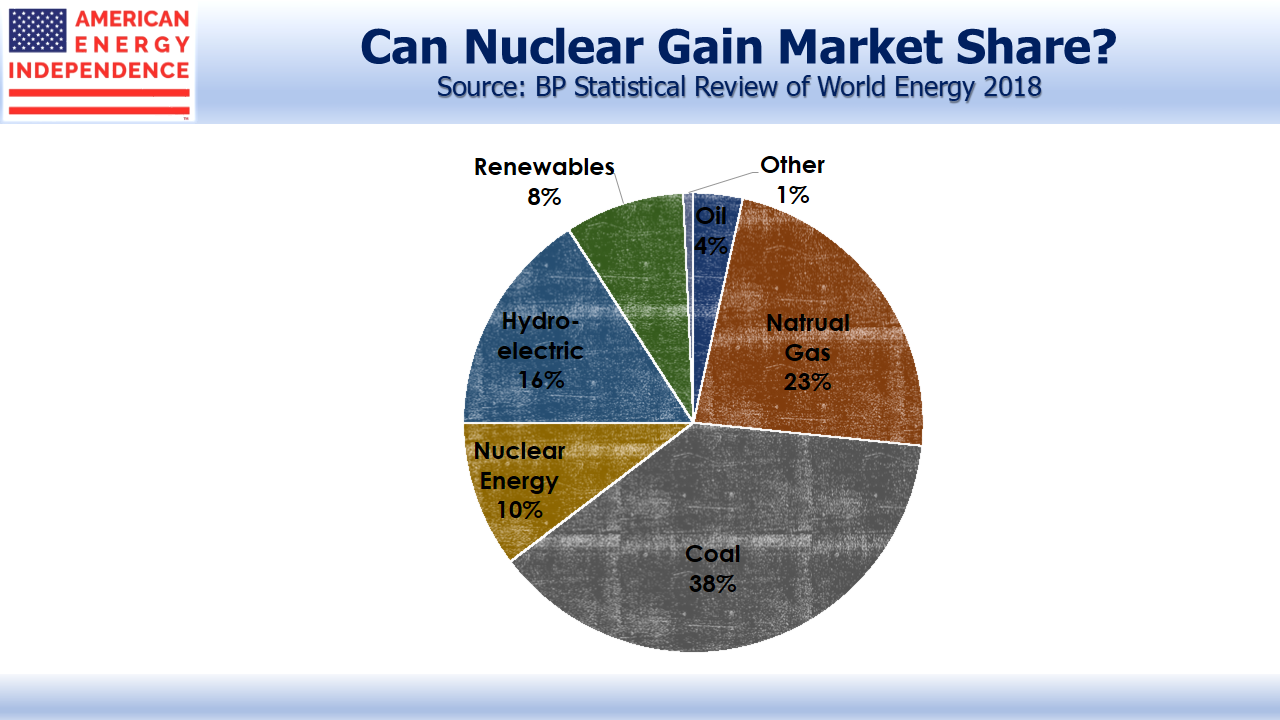
Any serious effort to limit Greenhouse Gases (GHGs) must incorporate nuclear energy. The GND House resolution is silent on the topic. The infamous FAQ document that was released and then disowned by Bronx Congresswoman Alexandra Ocasio Cortez (AOC) called for decommissioning nuclear power.

.avia-image-container.av-1cp7e0e-f57b2a1c888acc5e68c3604df67cf321 img.avia_image{ box-shadow:none; } .avia-image-container.av-1cp7e0e-f57b2a1c888acc5e68c3604df67cf321 .av-image-caption-overlay-center{ color:#ffffff; }

Nuclear's Share of the Energy Market

The scientific evidence supporting greater use of nuclear energy is strong. The world has built a powerful safety record. Accidents at Three Mile Island (1979), Chernobyl (1986) and Fukushima (2011) promote widespread public fear of nuclear reactors. But per Kilowatt Hour (kWh) of energy produced, the European Union and the Paul Scherrer Institute, the largest Swiss national research institute, found that nuclear power is safer than coal, oil, gas and even (by a slight margin) wind as a cause of deaths.

Coal power stations, for example, expose the public to nuclear radiation because coal ash typically contains uranium. The journal Science noted that living near coal-fired power stations exposed people to higher radiation doses than experienced living near nuclear power plants.

Because a nuclear accident carries such potential for devastation, the industry has developed a culture of redundant safety and continual improvement. Knowledge is widely shared within the industry globally, and the record bears this out.

A nuclear incident provokes images of Hiroshima, with enormous loss of human life and widespread radioactive contamination. But nuclear physicists argue, with plenty of evidence, that the process by which nuclear energy is harnessed doesn’t involve this risk. Apparently, during the Cold War neither Russia nor the U.S. targeted the other’s nuclear power plants because the likely damage would be modest.

The main risk with a nuclear accident is the release of radiation. Any death is tragic, but all energy production carries risks and a dispassionate analysis must consider the benefits and risks of any fuel source in combination.

Those who claim to care about climate change but reject increased use of nuclear power are rejecting science. Mike Shellenberger, who writes thoughtfully about such issues, has said, “The problem with nuclear is that it doesn’t demand the radical re-making of society, like renewables do, and it doesn’t require grand fantasies of humankind harmonizing with nature.”

Radioactivity occurs naturally all over the world. Embracing sunlight and wind as more natural than uranium is a belief system but isn’t a scientific solution to meeting the world’s need for power.

The GND has probably set back serious efforts to address climate change, because its wild extremism shows its supporters to be more interested in demagoguery than solutions. It may fire up a minority, but it betrays little interest in debate.

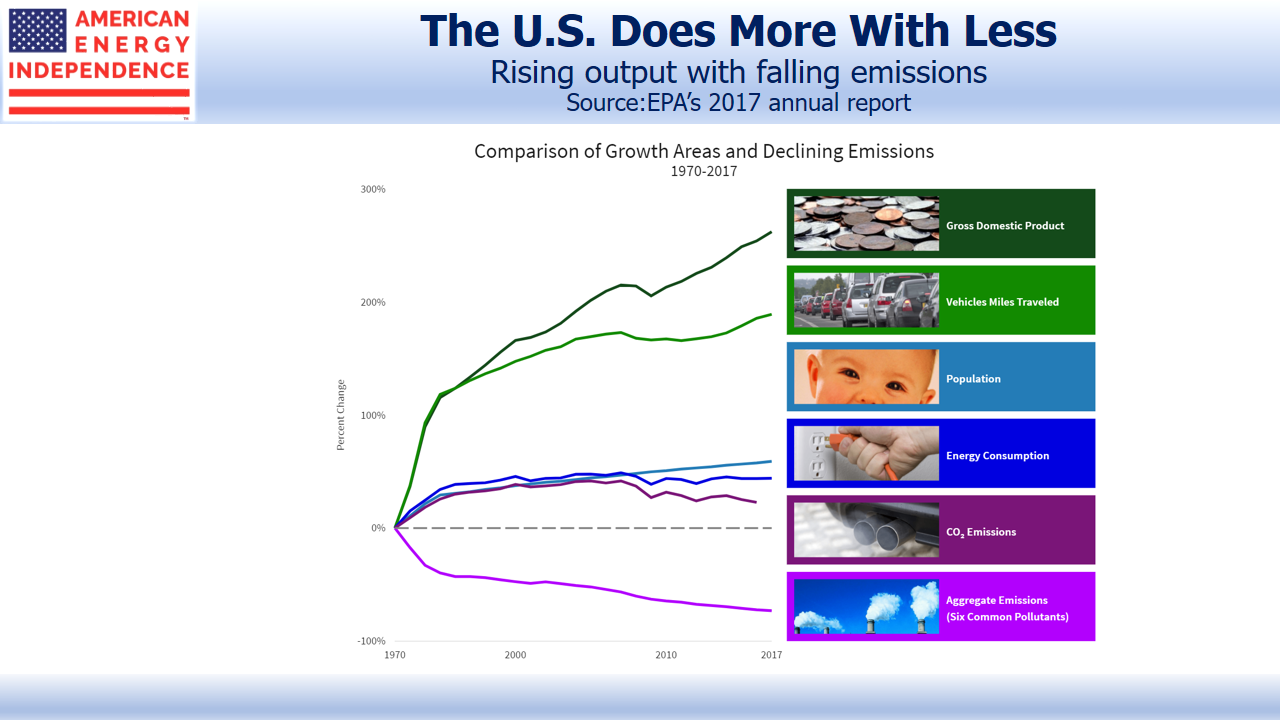
The Sierra Club, which also opposes nuclear energy, continues to work against any fossil fuels. Over the last decade, the U.S. has achieved a greater reduction in CO2 emissions than any other country (see Guess Who’s Most Effective at Combating Global Warming) because of power plants switching from coal to natural gas.

.avia-image-container.av-q9vlpq-a5da68b9ee98393348011dfed3d6cfd9 img.avia_image{ box-shadow:none; } .avia-image-container.av-q9vlpq-a5da68b9ee98393348011dfed3d6cfd9 .av-image-caption-overlay-center{ color:#ffffff; }

Growth and Declining Emissions

AOC’s hypocrisy is on full display, as she shuns the New York subway and defends her frequent Uber use: “Living in the world as it is isn’t an argument against working towards a better future.” The GND’s main author lives Animal Farm egalitarianism (“some…are more equal than others”).

At SL Advisors, we are helping finance America’s use of cleaner fossil fuels like natural gas in favor of coal, which we avoid. We are doing our bit to lower GHGs and make a better planet. We’re doing more than the Sierra Club, AOC or the GND supporters, because we’re focused on solutions that are effective today. The debate about climate change would benefit from more scientific rigor.

SL Advisors is the sub-advisor to the Catalyst MLP & Infrastructure Fund.  To learn more about the Fund, please click here.

SL Advisors is also the advisor to an ETF (USAIETF.com)


Here Comes The Sun: The Bright Future of Oil and Gas

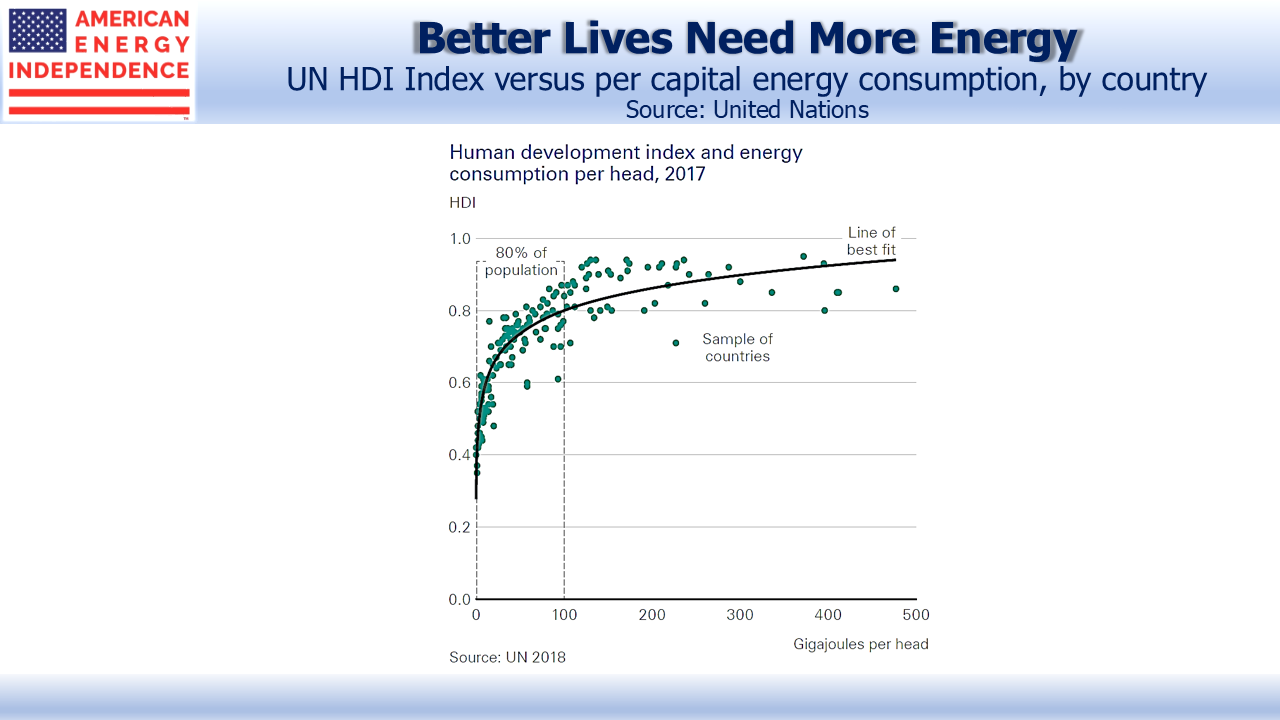
The United Nations Human Development Index (HDI) combines life expectancy, education and income to provide a more complete picture of well-being than simply considering GDP per capita. If one chart can illustrate the global challenge of combatting climate change, it might be the scatterplot below.

.avia-image-container.av-2hj073m-a1125948850206f9cb0599fc1ccb092b img.avia_image{ box-shadow:none; } .avia-image-container.av-2hj073m-a1125948850206f9cb0599fc1ccb092b .av-image-caption-overlay-center{ color:#ffffff; }

United Nations Human Development Index

HDI is inextricably linked to energy consumption. 100 Gigajoules (GJ) per head is approximately where improvements in HDI begin to flatten out. 80% of the world’s population lives below this level, and presumably aspires to it. Much of the developing world is in this category. The UN recently recommended the adoption of policies to limit global warming. The Green New Deal went further, with highly impractical solutions (see The Green Bovine Dream).

The world wants more energy and reduced emissions. The 2019 BP Energy Outlook acknowledges these conflicting goals. Its base case (called Evolving Transition) predicts that by 2040 two thirds of the world’s population will still be under the 100 GJ threshold, while CO2 emissions will have grown. This compromise will satisfy few, and it’s their central forecast.

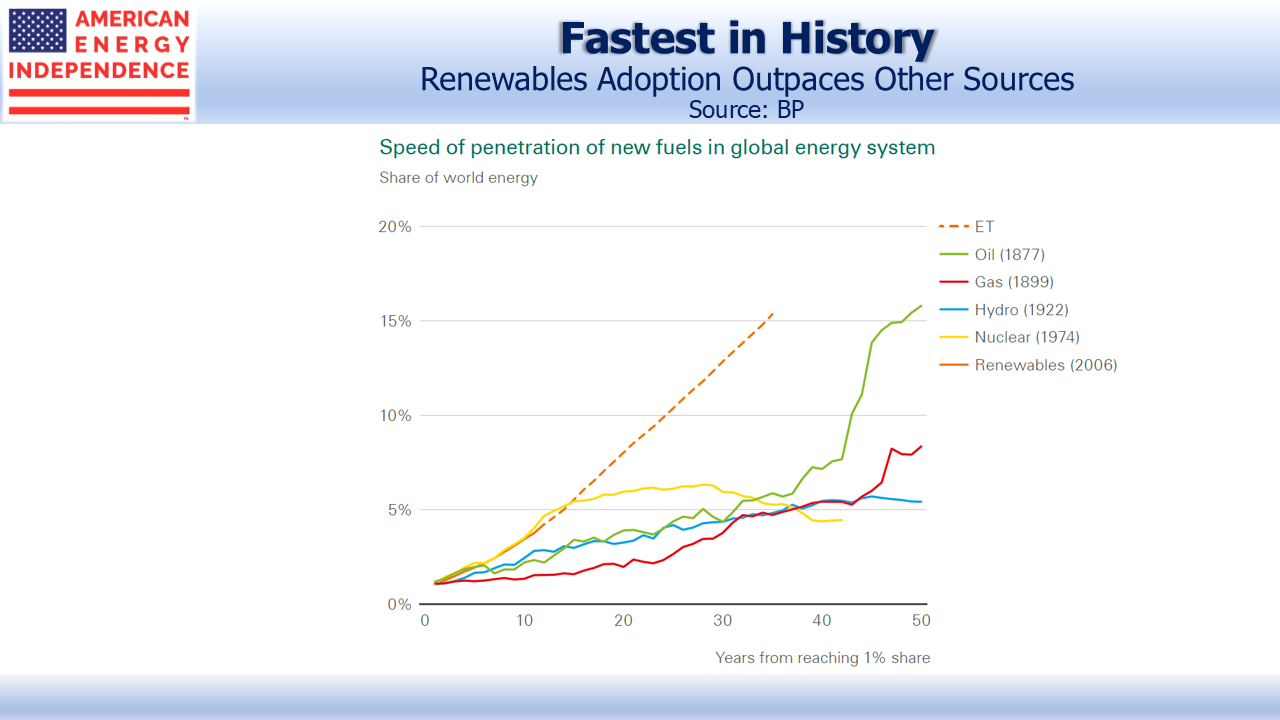
The world relies on fossil fuels for 80% of its energy. Critics will claim BP sees their continued dominance because their entire business locates, extracts, processes and sells them. But BP’s outlook forecasts a 20 year penetration rate for renewables of 15%, around triple that experienced historically by oil, gas, hydroelectric or nuclear power as their use ramped up.

.avia-image-container.av-7g80ya-ce27c1067d9e20161f7009babfbdebe5 img.avia_image{ box-shadow:none; } .avia-image-container.av-7g80ya-ce27c1067d9e20161f7009babfbdebe5 .av-image-caption-overlay-center{ color:#ffffff; }

Renewables Outpaces Other Energy Sources

BP’s report includes many interesting conclusions out to 2040:

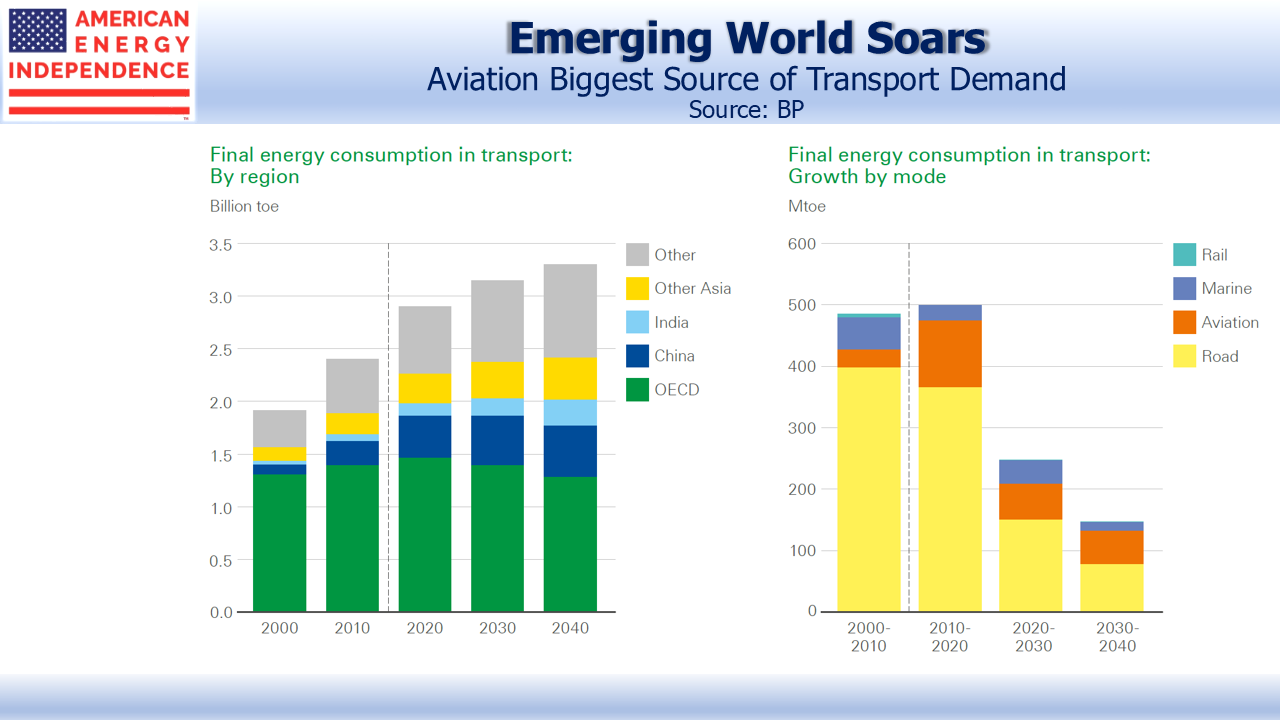
  • Global energy consumption for road use will fall
  • Aviation energy use will rise
  • Developing world energy use will rise sharply, led by China and India
  • Electric vehicles will represent 15% of the global fleet and 24% of vehicle/kms driven
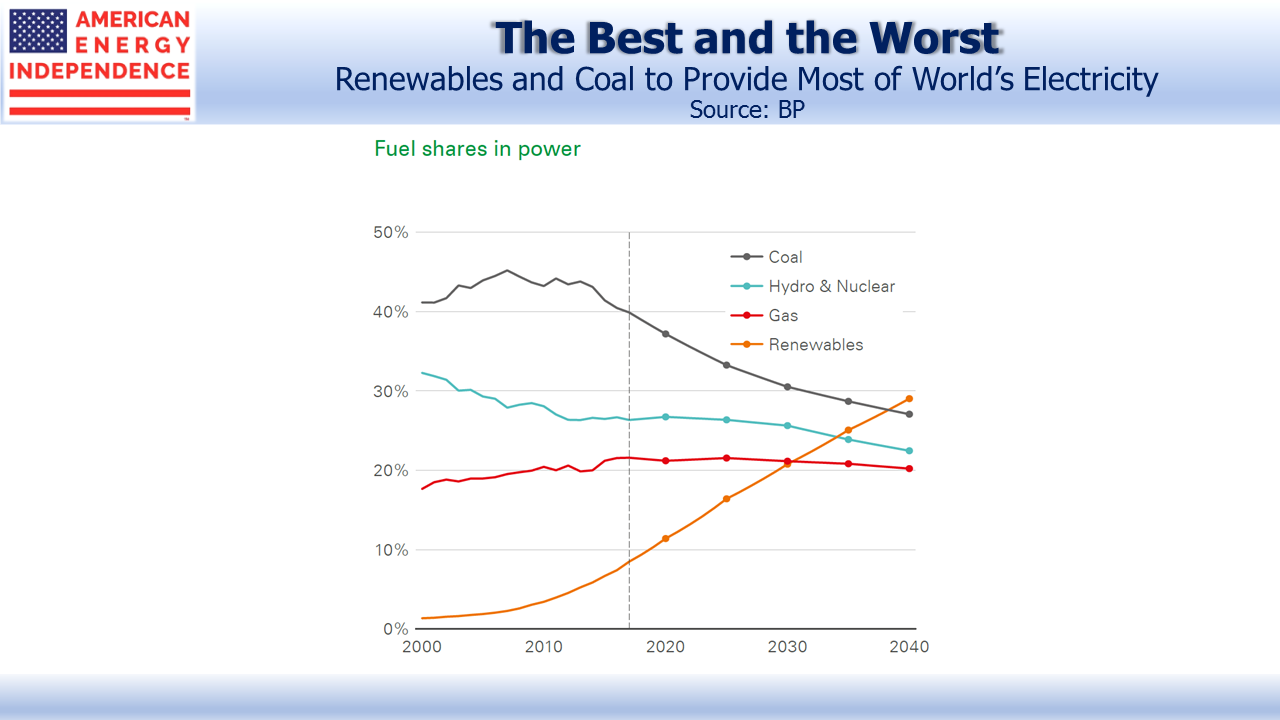
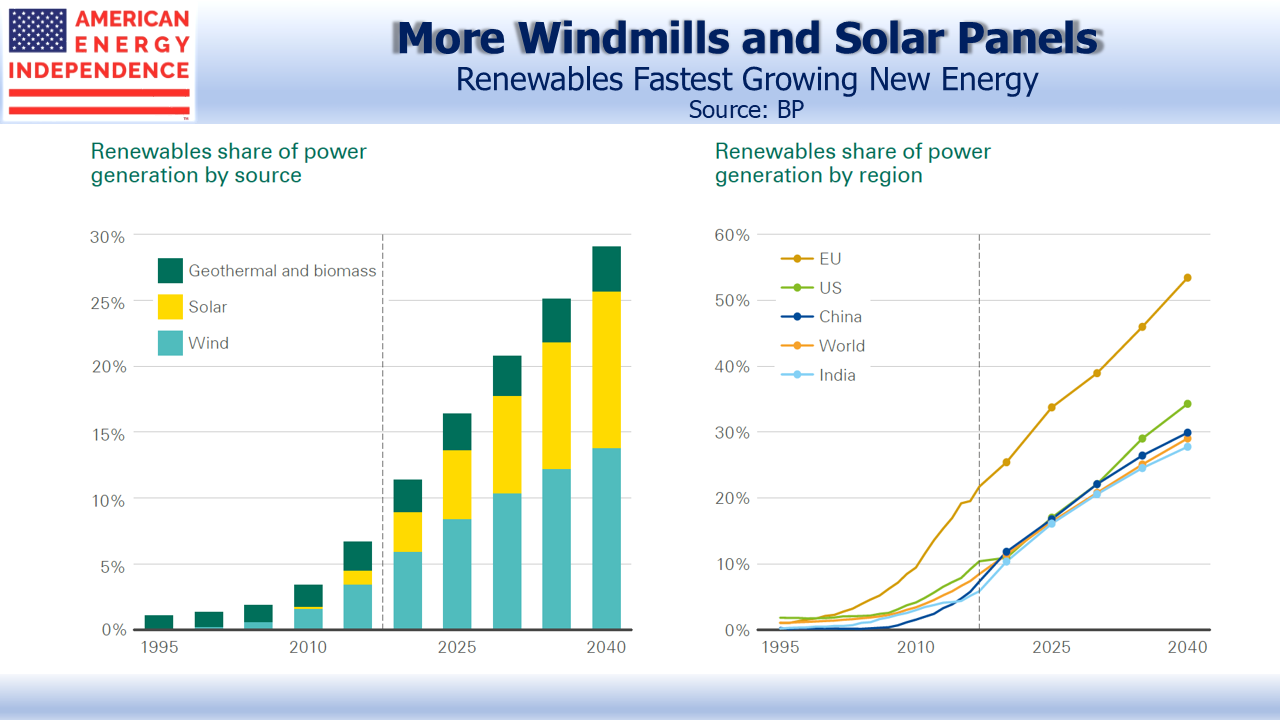
  • Renewables will be the biggest source of electricity generation
  • Coal will be #2, above 25%, because of continued increasing energy demand
  • 53% of EU power supply will be from renewables

.avia-image-container.av-ro4l5e-f77085764c3ca49373b80a1bb187e56b img.avia_image{ box-shadow:none; } .avia-image-container.av-ro4l5e-f77085764c3ca49373b80a1bb187e56b .av-image-caption-overlay-center{ color:#ffffff; }

The report considers other scenarios, including public policies that accelerate the move away from fossil fuels. If this led to a sharp drop in crude demand, the report speculates that low-cost oil producers might react by ramping up production to avoid having stranded assets. It’s thought-provoking — sell now or miss your opportunity. Such a price collapse would stimulate demand, slowing the energy transition.

.avia-image-container.av-1698wpe-2f812d1cccc18a97201459a231e0263c img.avia_image{ box-shadow:none; } .avia-image-container.av-1698wpe-2f812d1cccc18a97201459a231e0263c .av-image-caption-overlay-center{ color:#ffffff; }

Renewables Fastest Growing Energy Source

Returning to the base case, renewables will gain market share in developing countries faster than in the OECD. It may surprise to consider rising energy demand lifting renewables penetration. But energy use is capital-intensive.

Today’s gasoline-burning automobiles last over ten years; power plants can run for 30 or more, and energy inefficient buildings can have many decades of useful life. It’s hard for a new solar farm to compete on economics with an existing natural gas burning power plant.

OECD energy consumption looks to be flat, as population growth is offset by efficiencies. This means renewable infrastructure is replacing something older, and wholesale decommissioning of assets with years of useful life left is an extreme, unlikely solution. By contrast, growing energy demand in emerging economies allows renewables to gain market share. Rising living standards in developing countries will reduce bus use in favor of private cars, hence the jump in vehicle/kms and, most likely, epic traffic jams.

.avia-image-container.av-n0phua-5be0b1618c326547deab318a03f30402 img.avia_image{ box-shadow:none; } .avia-image-container.av-n0phua-5be0b1618c326547deab318a03f30402 .av-image-caption-overlay-center{ color:#ffffff; }

Aviation Biggest Source of Transport Demand

Overall, the report’s central forecast for a substantial increase in renewables and in electric vehicles should be welcomed by those environmental activists who acknowledge the enormous challenge in such an energy transformation. BP’s conclusions are broadly echoed by other long range forecasts, including those from the U.S. Energy Information Administration, the International Energy Agency, Exxon Mobil, IHS Markit and CNPC Economics & Technology Research Institute. This is not a radical outlook.

Nonetheless, natural gas demand is expected to grow at 1.7% annually. Crude oil demand growth of 0.3% reflects rising non-combusted demand, such as for plastics and lubricants offsetting less from private vehicles. Aviation demand will grow.

The U.S. is supremely well positioned for these long term trends. Production costs are falling, and the short-cycle nature of shale (see The Short Cycle Advantage of Shale) continues to attract capital at a time when 20 year investments in oil and gas projects are exceptionally hard to assess.

U.S. midstream energy infrastructure will remain vital to meeting the world’s growing demand for oil, gas and natural gas liquids, even while the multi-decade transition to non-fossil fuels is underway. The sector remains attractively valued after a strong couple of months, with distributable cash flow yields above 10%, substantially higher than REITs’ equivalent funds from operations yields of around 6%. From our vantage point, rising dividends are drawing in new investors.

SL Advisors is the sub-advisor to the Catalyst MLP & Infrastructure Fund.  To learn more about the Fund, please click here.

SL Advisors is also the advisor to an ETF (USAIETF.com)