EnLink Aims for Positive Free Cash Flow

It’s a sign of the market’s evolving view of pipeline stocks that EnLink Midstream’s (ENLC) distribution cut was followed by a modest bounce in the stock. A cut had been widely expected, and during the conference call with analysts some questioned whether the 34% reduction was big enough.  MLP investors are no longer solely focused on distribution yield as a measure of value.

ENLC is technically an LLC rather than a partnership. It has elected to be taxed as a corporation so as to broaden its investor base by issuing 1099s rather than K-1s. But its owner base remains dominated by MLP funds, perhaps because the weaker governance of an LLC dissuades many institutions who might otherwise consider the stock.

.avia-image-container.av-kuf1us-7881111460a95549e1ac54e87e1b6c3e img.avia_image{ box-shadow:none; } .avia-image-container.av-kuf1us-7881111460a95549e1ac54e87e1b6c3e .av-image-caption-overlay-center{ color:#ffffff; }

One unanswered question remains the influence of Global Infrastructure Partners (GIP) in setting strategy. GIP has taken a beating since investing $3.125BN in July 2018 (see Leverage Wipes Out Investor’s Bet on Enlink). GIP took on $1BN in debt and the subsequent collapse in ENLC’s stock has virtually wiped out the equity. The deteriorating fundamentals of Enlink’s business since GIP’s investment highlight that private equity often brings little to the table besides cash (and additional leverage). Uncertainty about GIP’s intentions remains a negative, and ENLC has offered little information. CEO Barry Davis simply said they exchange information with GIP on what each is seeing in the marketplace, which means either he doesn’t know much useful about GIP’s plans or what he does know isn’t positive. Preserving enough cashflow to GIP from the reduced dividend to service their debt was regarded by most as a factor.

.avia-image-container.av-2hwrc4-cb0a8b7dee3e3c6d588aa709d271cdd2 img.avia_image{ box-shadow:none; } .avia-image-container.av-2hwrc4-cb0a8b7dee3e3c6d588aa709d271cdd2 .av-image-caption-overlay-center{ color:#ffffff; }

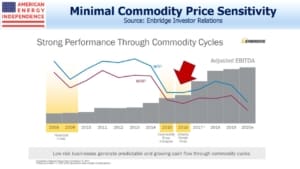
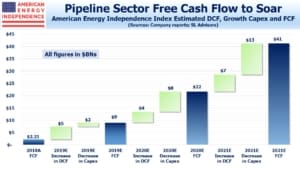
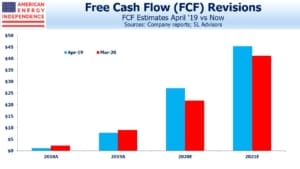
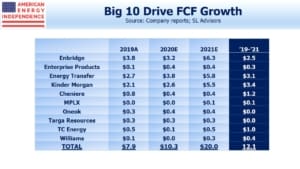
Investors were mildly cheered by the discussion of Free Cash Flow (FCF) and the fact that it’ll be positive in 2020. Midstream energy infrastructure stocks have been rewarded for generating FCF. We estimate that almost half the industry’s 2019 FCF came from two big Canadian companies, TC Energy (TRP) and Enbridge (ENB). Both were star performers last year, returning 58% and 39% respectively including dividends. In The Coming Pipeline Cash Gusher last year we highlighted the industry’s growing FCF. Following 4Q earnings in the next few weeks we’ll update those projections, but they’re likely to be largely on track.

Even after the cut, ENLC now yields 13%, roughly 2X the yield on the American Energy Independence Index. This new dividend is presumably secure, not least because it must align with GIP’s debt servicing needs. Questions remain about long term performance in its assets located in Oklahoma and North Texas. Devon Energy (DVN), once ENLC’s owner and significant customer, triggered the weaker performance by divesting from plays in those regions. ENLC is still struggling to convince investors that their long term future is secure, and as with many pipeline companies the Permian in west Texas looks more attractive.

More clarity around GIP would be helpful. ENLC isn’t the traditional toll model with secure volume-backed contracts extending out many years. Customer drilling activity remains a critical factor in driving their performance. But for now they seem to be operating from the front foot. The dividend is also fully classified as a non-taxed return of capital, an appealing feature for those taxable investors who care about such things. It’s likely to remain that way for at least another three years due to a depreciation shield offsetting taxable income. RW Baird estimates 2021 FCF of $115MM, which on its current market cap of $2.85BN is a 4% FCF yield. However, that’s after the 13% distribution, so represents a high total FCF yield to equity holders. FCF is a recent discovery for many energy companies, and the fact that ENLC can show some ought to provide some support for the stock.

We are invested in ENB, ENLC and TRP


Clean Fossil Fuels May Be Coming

Tokyo enjoys on average 1,800 sunny hours a year, less than half of sun-drenched Arizona. It’s also subject to extreme weather, such as typhoons. Arizona may be a candidate for solar power, but if Japan’s capital relied on the sun for its electricity, it would require battery back-up to provide the 25 Gigawatts (GW) its residents use for each day that bad weather, including typhoons, blocked its power source.

That’s 600 GWh per 24 hours. By 2021, Southern California Edison is planning a single system capable of running 100 MW for four hours. Tokyo would need 1,500 of them for 24 hours of back-up, sitting mostly idle until called into action by an extreme weather event.

This thought experiment is used in an interview with Bill Gates, where he illustrates the challenges facing renewables in meeting the world’s energy needs. Elon Musk is planning bigger batteries, but the economics of storing vast amounts of power to compensate for cloudy days remains daunting.

This is why combating climate change requires innovation on so many fronts. Given the enormous fixed investment and substantial R&D budgets of today’s biggest energy companies, developing technologies to use fossil fuels more cleanly remains a more likely solution.

.avia-image-container.av-wzlnc9-120da1c63d44bbbb7fa27ea97b22e90b img.avia_image{ box-shadow:none; } .avia-image-container.av-wzlnc9-120da1c63d44bbbb7fa27ea97b22e90b .av-image-caption-overlay-center{ color:#ffffff; }

NET Power has developed a natural gas power plant that produces electricity with no CO2 emissions. Conventional single-cycle power plants burn natural gas (or coal) to heat water which acts on a turbine to generate electricity. This produces CO2, and in the case of coal plants other noxious gases and polluting particles. Combined cycle power plants use some of the produced CO2 to power a second turbine, improving efficiency but still ultimately emitting Greenhouse Gases (GHGs).

The Allam Cycle burns methane (natural gas) with pure oxygen extracted from the air (which is roughly 80% nitrogen and 20% oxygen). The result is water, and supercritical CO2 (sCO2) which is used to power the turbine. Most of the sCO2 is then recycled in a closed system to provide further power. There are no emissions, and the CO2 is eventually captured for resale or to be permanently sequestered underground.

Its backers, who include Exelon, Occidental Petroleum and venture capital firm 8 Rivers, aim to show that the technology is commercially viable. Publicly, developments have been slow. An experimental power plant is operating in La Porte, Texas. For now its power output is only being used internally while testing continues; it’s not yet reliable enough to connect to the Texas grid, run by ERCOT. NET Power expects the technology to be deployed commercially by 2022.

In testimony before the Senate Committee on Energy and Natural Resources last year, 8 Rivers principal Adam Goff noted the business potential in China and India, where local pollution is as big a concern as GHG emissions.

NET Power has been around for some time. Goff said 8 Rivers began developing the Allam Cycle in 2009. Progress has been methodical, or ponderous, depending on your perspective. Based on public comments from Goff and others, within the next year or two we should see tangible signs confirming that NET Power has a commercially viable product.

The electricity produced is expected to be cheap, partly because of the rebate from selling CO2. Occidental, one of NET Power’s investors, pumps 50 million tons of CO2 into the ground annually to boost oil production. Although the CO2 is permanently out of the atmosphere, climate extremists are unlikely to be impressed. And it’s unclear that there’s demand for the amount of CO2 that such plants would produce if the technology was widely adopted.

.avia-image-container.av-wotpah-b0a94b82f182edce1c7fd032abb07d46 img.avia_image{ box-shadow:none; } .avia-image-container.av-wotpah-b0a94b82f182edce1c7fd032abb07d46 .av-image-caption-overlay-center{ color:#ffffff; }

The Allam Cycle is not limited to natural gas. Petroleum-based products and even coal can be combined with pure oxygen to generate electricity, although the focus has been on developing the natural gas capability. Capturing the CO2 from conventional power plants is expensive because it has to be separated out from the air as it’s emitted. NET Power’s approach captures the CO2 while it’s still in a relatively pure form, which is much cheaper.

80% of the world’s primary energy comes from fossil fuels. Although only around 20% of global energy use is for electricity, that’s still substantial and initiatives to combat climate change generally contemplate increased electrification of transportation. Electric vehicles charged by hooking up to a predominantly solar and wind grid remain the dream of many. But when you consider how well fossil fuels work, and the enormous capital invested in their continued dominance, privately-owned NET Power looks like a venture that much of the energy sector is cheering on from the sidelines.

If its backers are right, they’ll earn an enormous return as well as ensuring continued demand growth for natural gas. If emission-free power from fossil fuels becomes a reality, depending on sunny and windy days supported by a huge battery back-up will seem rather quaint.


Energy Strengthens U.S. Foreign Policy

“Let us set as our national goal, in the spirit of Apollo, with the determination of the Manhattan Project, that by the end of this decade we will have developed the potential to meet our own energy needs without depending on any foreign energy sources.”

Over 47 years ago, President Nixon set out this vision. Securing oil supplies from a region of the world that often seems hostile to the U.S. has driven foreign policy ever since.

Four years later, President Carter warned in a speech to the nation that, “We can’t substantially increase our domestic production, so we would need to import twice as much oil as we do now. Supplies will be uncertain. The cost will keep going up. Six years ago, we paid $3.7 billion for imported oil. Last year we spent $37 billion — nearly ten times as much — and this year we may spend over $45 billion.”

.avia-image-container.av-19u10vr-3d9fae36f67ff75c38bf0e61f9b03e77 img.avia_image{ box-shadow:none; } .avia-image-container.av-19u10vr-3d9fae36f67ff75c38bf0e61f9b03e77 .av-image-caption-overlay-center{ color:#ffffff; }

Last week, following Iran’s deliberate miss of U.S. forces in Iraq, President Trump said, “…our economy is stronger than ever before and America has achieved energy independence (emphasis added). These historic accomplishments changed our strategic priorities…We are now the number-one producer of oil and natural gas anywhere in the world. We are independent, and we do not need Middle East oil.”

In November, the U.S. was a net exporter of crude oil and petroleum products for the first time in decades, a development made possible by the Shale Revolution. Increased freedom of action is one of the many benefits, as Iran is finding out.

Some have noted that the figures don’t show that the U.S. is a net oil exporter, which is true (see America Is Not Yet A Net Crude Oil Exporter). Domestic production is currently 12.9 Million Barrels per Day (MMB/D), and consumption of refined products is around 20 MMB/D. The difference is made up by 5 MMB/D of Natural Gas Liquids (NGLs), of which 3 MMB/D is consumed domestically, much of it as inputs into the petrochemical industry; 1.0 MMB/D of ethanol; and 1.1 MMB/D of net refinery processing gains. Net imports of crude oil make up the difference.

Crude oil comes in hundreds of grades, and it’s often reported that U.S. refineries are better equipped to process the heavy crude that Venezuela and Canada produce, with limited capacity to handle the light crudes that come from the Permian in west Texas. So we trade with other countries to achieve the desired mix of blends.

.avia-image-container.av-le8s9j-68821a0be4d72544ef77c8faa74db5df img.avia_image{ box-shadow:none; } .avia-image-container.av-le8s9j-68821a0be4d72544ef77c8faa74db5df .av-image-caption-overlay-center{ color:#ffffff; }

Imports from Venezuela have collapsed to almost zero from 1.2 MMB/D a decade ago. Imports from the Middle East have fallen to 0.7 MMB/D, so it wouldn’t be hard to get by with no Middle East imports at all. Meanwhile, Canada’s continue to grow.

.avia-image-container.av-2egfzr-fb201fbd3cc0d0b1fe2fb5a037239b61 img.avia_image{ box-shadow:none; } .avia-image-container.av-2egfzr-fb201fbd3cc0d0b1fe2fb5a037239b61 .av-image-caption-overlay-center{ color:#ffffff; }

From an energy independence perspective, Canada’s oil imports are hardly at risk. Its oil is produced in Alberta and runs south through pipelines to refineries in the Midwest, and even all the way to the U.S. Gulf coast. Two thirds of Canadian production is the heavy blends suited to U.S. refineries, and we buy 80% of their production. Canada has little choice other than exporting to the U.S. Domestic politics has prevented the construction of additional pipeline capacity from Alberta to Pacific coast ports in British Columbia (see Canada’s Failing Energy Strategy).

So even though there’s two-way trade in crude oil to achieve the blends needed for U.S. refineries, our imports are increasingly coming from friendlier countries.

.avia-image-container.av-v5mthz-b425b40f8e60a283c8c481e2e78f68b0 img.avia_image{ box-shadow:none; } .avia-image-container.av-v5mthz-b425b40f8e60a283c8c481e2e78f68b0 .av-image-caption-overlay-center{ color:#ffffff; }

The net result is that the U.S. is not only net independent in crude based products, but our imports of the blends of crude we prefer are coming from friendly countries. It’s a truly incredible outcome, and midstream energy infrastructure is vital to this success.

For a list of the most important companies in this sector, look at the American Energy Independence Index.


It’s Iran’s Move

If one thing’s clear about recent developments in the Middle East, it’s that events defy prediction. Yet timing trades in the energy sector requires the seemingly impossible.

On Monday, we listened to a thoughtful call arranged by RW Baird with Greg Priddy, Director, Global Energy and Middle East, at Stratfor. Greg expects a measured, near term response from Iran intended to be regarded as proportional, allowing for a similar U.S. response (i.e. target a couple of Iranian missile installations), and thereby avoiding escalation. It sounds very neat, and prone to miscalculation.

Greg Priddy felt that the virtual collapse of the Iranian nuclear deal is more problematic over the long run. In its first response to the killing of General Suleimani, the government announced that, “Iran will continue its nuclear enrichment with no limitations and based on its technical needs.” As Iran approaches an offensive nuclear capability, this is likely to draw a response from Israel or the U.S. He put the timeframe as by the summer, which struck us as startlingly soon. Priddy placed the odds of a significant U.S. military attack on Iran this year at 45%.

Ratcheting up the price of crude oil may be one of the few levers Iran holds over President Trump in an election year. So far, oil traders have been surprisingly sanguine about the prospects of supply disruption. Following September’s attack on Saudi infrastructure, oil retraced its initial jump within a couple of weeks, as supply was quickly restored. Some analysts believe that the recent jump in prices won’t be sustained without an actual loss of supply. The Shale Revolution has enhanced America’s freedom to act.

.avia-image-container.av-rny7oi-97ab829030f9d8b5b8687c0b79b7cf7b img.avia_image{ box-shadow:none; } .avia-image-container.av-rny7oi-97ab829030f9d8b5b8687c0b79b7cf7b .av-image-caption-overlay-center{ color:#ffffff; }

However, given the domestic American politics of rising gas prices, a series of moves to interrupt supply would seem to be one of few meaningful strategies left to Iran. Attacks on fixed targets will draw a U.S. response, but if shipping insurance rates rise and the smooth transport of oil around the world becomes less certain, Iran may yet find it has some leverage and buy it time until the US election.

The problem Iran’s leadership now faces is that it has raised expectations domestically for a robust response, but its choices remain limited. Meanwhile, Trump has shown he’s not interested in nation building or committing U.S. land forces. He  has established a clear red line that the loss of American lives won’t be tolerated. Cruise missiles and drones allow the U.S. to pursue remote yet devastating engagement with minimal risk. Crippling economic sanctions continue to hurt the Iranian population.

Iran’s current approach of low-level, asymmetric attacks has also failed to achieve their goals They may have overplayed their hand, and are now left with few options.  A direct military response risks heavy-handed retaliation, while small provocations through proxies expose Iran’s leaders personally. It’s unclear how Iran’s government can lower tensions, and little evidence they want to.

Trump’s killing of Suleimani highlights how unpredictable the conflict has become. Energy investments are a good insurance policy. The past decade’s underperformance against the S&P500 has left many investors underweight, and lowered the sector’s correlation with the rest of the market. Oil prices don’t yet price much risk premium. Midstream energy infrastructure’s growing free cash flow (see The Coming Pipeline Cash Gusher) is well beyond Iran’s reach, and offers a highly likely outcome in a period of uncertainty.


Stocks Have Been Cheaper

We’ve been using the Equity Risk Premium (ERP) as a measure of the relative attractiveness of stocks for many years. The ERP is the earnings yield (i.e. the reciprocal of the P/E ratio) minus the ten year treasury yield. It compares stocks with bonds, allowing today’s relationship to be compared with history. The S&P500’s P/E is currently 18.1, based on Factset‘s 2020 earnings forecast of $178. That’s an earnings yield of 5.5%, producing an ERP of 3.6 when compared with the ten year treasury yield of 1.9%. Since 1960, the ERP has averaged 0.6, so it currently favors stocks.

The Cyclically Adjusted Price/Earnings Ratio (CAPE), another valuation tool, has been disastrous. It’s shown stocks to be expensive, because it compares the current P/E with the long term average. The flaw in this simple approach is that it ignores interest rates. Stocks are historically expensive, but bonds are even more so. CAPE practitioners have missed out on an enormous rally.

.avia-image-container.av-o19kcc-a5e5e9a734148550c636ffd1ce1af351 img.avia_image{ box-shadow:none; } .avia-image-container.av-o19kcc-a5e5e9a734148550c636ffd1ce1af351 .av-image-caption-overlay-center{ color:#ffffff; }

We first wrote about the ERP in 2012 (see The Price of Fear) when it was 6.3. It’s been providing a bullish signal for stocks ever since, as we’ve often pointed out. A year ago it was 4.4. During 2019 yields fell, earnings grew and multiples expanded, all of which supported the market’s 31% return.

I was chatting with a friend the other day about valuations, and the ERP. Factset bottom up earnings for 2019 began last year at $174 and edged down all year to $163. That’s often the case – sell-side analysts and management guidance typically open the year with optimism that subsequent events gradually erode.

.avia-image-container.av-o3tq8s-6c21e3a0570adf10a81ea1da45c91f20 img.avia_image{ box-shadow:none; } .avia-image-container.av-o3tq8s-6c21e3a0570adf10a81ea1da45c91f20 .av-image-caption-overlay-center{ color:#ffffff; }

At the end of 2018, the 2020 earnings forecast was $193. It’s already fallen almost 8% to reach its current level of $178. Although at 3.6 the ERP remains wide compared with fifty years of history, it’s less so over the past decade. If the same downward path to earnings forecasts continues, 2020 will come in close to 2019 at around $164. That would push the ERP down to 3.2. A 1% jump in long term rates, always a possibility and more likely than a 1% drop, would move the ERP to 2.2.

Stocks remain a good investment, although they have been substantially more attractive at different points over the past decade. Bonds continue to be an extremely poor long term bet. But it wouldn’t take much for equity valuations to be mundane. One exception might be energy, especially pipelines and other midstream infrastructure, where low valuations should provide more downside support if the broader market takes a tumble. In Pipeline Bond Investors Are More Bullish Than Equity Buyers, we highlighted how cheap pipeline stocks are compared to bonds. Energy was the worst performing sector of the past decade. One result is that it’s far cheaper than the broader equity market.

Wishing all our clients and readers a happy and prosperous 2020.


Looking Back on 2019

Our twice-weekly blog saw a 30% increase in pageviews during 2019, along with a healthy jump in subscribers. It’s reposted across several other websites, and we believe it’s the most widely read blog on midstream energy infrastructure.

The interest level shown by readers, as well as questions asked by investors, both influence our choice of topics. Reviewing the past year’s stats provides a useful perspective on what pipeline investors are thinking about.

Our most read blog post of the year was When Will MLPs Recover? It was published on November 13th. It didn’t catch the low, which came in early December, but the recent rally has lifted prices nicely above their mid-November level. Coming on the heels of a weak October, always-fragile sentiment plunged to utter resignation among some. MLPs lagged midstream energy infrastructure by a wide margin in 2019, with the Alerian MLP Index up 9% compared with the American Energy Independence Index which is up 23%. It’s a consequence of the narrow investor base for MLPs.

.avia-image-container.av-vwd6hd-d05fc31a0e823339d98ae72c95bf701c img.avia_image{ box-shadow:none; } .avia-image-container.av-vwd6hd-d05fc31a0e823339d98ae72c95bf701c .av-image-caption-overlay-center{ color:#ffffff; }

The Coming Pipeline Cash Gusher was #2, offering our most eloquent response to the question about sector recovery. Free Cash Flow (FCF) has not historically been a metric used by MLPs. Two of the best performers in 2019, TC Energy (TRP) and Enbridge (ENB), do generate healthy FCF. Their capital allocation reflects values inspired by Canadian Presbyterian parsimony. Their strong 2019 returns suggest that as other pipeline companies increase FCF, their stock prices will also rise. We’ll be updating this analysis following 4Q19 earnings when companies provide updated 2020 growth capex guidance.

American Energy Independence is Imminent was #3, celebrating the many positives for the U.S. that increased domestic energy production is bringing.

AMLP’s Tax Bondage was #4. This was originally published in January 2018, and is our most read blog over the past two years. Explaining the disastrous tax drag to investors in AMLP invariably draws gratitude from the newly informed.

Why Energy Transfer Can’t Get Respect came in at #5. Too few writers are willing to be critical of the sector they follow. Your investment team is heavily invested in many of the companies we cover. When they do things we disagree with, I am incensed. We sell out if we conclude there’s no hope of management making sound decisions and acting with integrity. But it’s foolish to ignore valuation, and position sizing needn’t be binary (i.e. invested or not invested), it can be scaled to reflect all the relevant factors. Publicly criticizing a CEO to several thousand readers can provide the same satisfaction as impulsively dumping the stock, and often makes for better investment returns.

Our biggest single day of pageviews came on October 9th, driven by Energy Transfer’s Weak Governance Costs Them.

In addition to our blog, we do a weekly podcast which is about six months old. It is steadily gaining listeners. Like our blog, it covers the sector but also takes a political view on issues like climate change that have big implications for our business. A recent episode, The Coming Rally in MLPs, was our most popular podcast. A couple of my personal favorites are Celebrity Climate Change Shaming and Greta’s Grandstanding. The most vocal climate extremists are often those least capable of critical analysis. The climate change debate has too few pragmatists seeking practical solutions. The middle ground, where we sit, is wide open.

We also do a quarterly webinar and periodic videos. Stop Flaring is our most popular video.

Finally, Twitter is an under-utilized resource that surprisingly few financial advisors use. I follow energy journalists and publications, and generally limit my tweets to energy (although occasionally that self-restraint lapses). If you want to know which stories we’re following today, check out @SimonLack.

We enjoy the engagement and feedback on all the material we produce. American Energy Independence is a fantastic story for this great country. There’s a bright future ahead.

We are invested in Enbridge , Energy Transfer and TC Energy


Searching for Christmas

Our blog has a Search function that allows users to quickly find what they’re looking for. One of our most often read blog posts is MLP Funds Made for Uncle Sam, which is easily found by entering “Sam” in the search box.

SL Advisors is a secular organization, but searching for the word “Christmas” generates a surprising number of results.

Some relate to the seasonal pattern in which November weakness in MLPs is followed by a rally into January. Why MLPs Make a Great Christmas Present, MLPs Lose That Christmas Spirit and MLPs Weak in November, As Usual all reference Christmas in the text.

In Stocks Are the Cheapest Since 2012 a year ago we welcomed Christmas as a respite from relentless selling. Stocks, including midstream energy infrastructure, duly rallied with our American Energy Independence Index gaining 20% since then.

Investor frustration with the sector was high at times during 2019, and few probably expected the year’s returns to finish where they are. Energy infrastructure has joined the festive season in recent weeks.

Although New Jersey is not having a white Christmas, it’s still too cold for golf. This remains one of our favorite cartoons.

.avia-image-container.av-iloo3m-988d0b2a386a527afa8da66a97c2ba8b img.avia_image{ box-shadow:none; } .avia-image-container.av-iloo3m-988d0b2a386a527afa8da66a97c2ba8b .av-image-caption-overlay-center{ color:#ffffff; }

We wish all of our readers a Merry Christmas, Happy Holidays, and much joyful time with family and friends.


Pipeline Bond Investors Are More Bullish Than Equity Buyers

One of the most consistent bullish indicators for stocks has been the Equity Risk Premium (ERP) – the spread between the earnings yield on the S&P500 and the ten year treasury yield. At the end of last year, the S&P500’s 2019 earnings yield was around 7.2% (one divided the P/E ratio, which was then 13.8). With ten year treasuries at 2.8%, the ERP was 4.4, well above the 50-year average of 0.6.

The S&P500 is up 30% this year, and the P/E multiple has expanded to 18X next year’s  earnings (i.e. earnings yield of 5.5%). This has brought the ERP down to 3.6 — still favoring stocks, but not as clearly as a year ago. If treasury yields had remained at last year’s levels rather than dropping almost 1%, the ERP would be even lower at 2.7.

.avia-image-container.av-tqytsx-676c9036d63a67302684bfa89ce14bad img.avia_image{ box-shadow:none; } .avia-image-container.av-tqytsx-676c9036d63a67302684bfa89ce14bad .av-image-caption-overlay-center{ color:#ffffff; }

Since stocks look cheap, bonds must be expensive. Perhaps the biggest unanswered question facing investors today is why long term bond yields remain so low, and whether this is sustainable.

The return bond investors require over inflation, the real rate, has been in secular decline for thirty years (see Real Returns On Bonds Are Gone). Today’s bond investors are willingly locking in low and negative real yields – in many cases even negative nominal yields. Two compelling explanations are (1) inflexible investment mandates, and (2) fear of another 2008 financial crisis.

U.S. pension funds have raised their fixed income allocation even while yields have fallen, a counter-intuitive response to lower expected returns (see Pension Funds Keep Interest Rates Low). Hard evidence that investors are holding additional low risk assets as protection against a crash is harder to come by, but low yields certainly support that explanation.

.avia-image-container.av-lv3ckh-b424e4df2628f1b828e0a80a4ef33268 img.avia_image{ box-shadow:none; } .avia-image-container.av-lv3ckh-b424e4df2628f1b828e0a80a4ef33268 .av-image-caption-overlay-center{ color:#ffffff; }

Lower real yields on sovereign debt are a result of investors’ strong desire for bonds with negligible credit risk. But the fact that corporate bond yields are being pulled down by these same forces reveals a pricing inefficiency that equity investors can exploit.

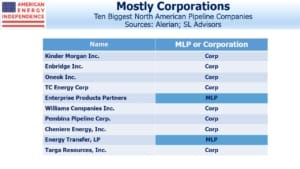
It’s most clear at the individual issuer level, where excessive demand for debt instruments is causing some interesting distortions. The table shows long term bond yields for the ten biggest North American pipeline companies, with an average equity market capitalization of $39BN.

They’re all members of the American Energy Independence Index, the broadest and most representative index of North American midstream energy infrastructure. These ten companies have outstanding bonds with maturities of 25-40 years. They are all investment grade, offering an average yield of 4.3%, which reflects a high degree of comfort with their credit risk over several decades.

By contrast, their equity dividend yields average 5.8%, 1.5% above their bond yields. And this even includes Cheniere Energy (LNG), which doesn’t currently pay a dividend (although they’re likely to institute one over the next couple of years).

Energy has been out of favor more or less since 2014, although stock price performance in December has been strong. These ten companies’ average dividend yield is almost 3X the 1.75% yield on the S&P500, reflecting substantial wariness about their prospects. And yet, bond investors don’t share the same concern.

Equity investors can earn higher yields than bond investors on the same issuer, in addition to enjoying likely earnings and dividend growth in the years ahead. Once equity prices reflect the positive outlook reflected in their long term debt, they’ll re-price higher.

Based on recent performance, that revaluation may already be under way.

We are invested in all the names mentioned above.


Stop Flaring


Tallgrass Investors Catch a Break

Yesterday Blackstone (BX) surprised Tallgrass Equity (TGE) investors by sweetening their offer for the shares they don’t own to match the price they originally paid in March. It marks a victory for Limited Partners in TGE, which retained its partnership structure even though it’s taxed at a corporation so as to avoid issuing K-1s.

The sideletter that provided a floor on the price management received for their LP units was unfair, and caused us to criticize it in September (see Blackstone and Tallgrass Further Discredit the MLP Model) when BX announced their offer to acquire the remainder of the shares. Most sell-side analysts were embarrassingly silent in standing up for their investors, conflicted as they are by the desire to win banking mandates from the protagonists. RW Baird’s Ethan Bellamy is a standout exception, unafraid to raise awkward questions during earnings calls, which renders his research opinions more credible. Other sell-side analysts should take note.

TGE CEO David Dehaemers claimed not to understand (see Tallgrass Responds to Critics, Missing the Point) and with nobody else publicly taking his side, he brought forward his retirement. This ended a disappointing episode in an otherwise successful career.

.avia-image-container.av-tb6u8c-ebbf565a9f2717e00c2ccfcf30880ff4 img.avia_image{ box-shadow:none; } .avia-image-container.av-tb6u8c-ebbf565a9f2717e00c2ccfcf30880ff4 .av-image-caption-overlay-center{ color:#ffffff; }

Although the degree of sweetening from BX was a surprise, once they’d invested in TGE it always made sense for them to acquire the rest. Having a public equity position in a private equity portfolio adds unwelcome valuation realism. Private equity funds are reporting far better investment returns than public markets (see Private Equity, Private Valuations), even though they occasionally commit some howlers (see Leverage Wipes Out Investor’s Bet on Enlink). GIP’s 44% partial ownership of Enlink (ENLC) can hardly be their desired position – they’ll either buy the rest or exit, realizing a substantial loss. Information on GIP’s intentions has been sparse. PE investments rarely lose value as quickly as this one, and explaining it has been an unwelcome distraction for GIP’s overworked investor relations people.

TGE’s pending disappearance as a public company also represents another step in the shrinking universe available to Alerian’s MLP indices. TGE was a 4.7% weight in the Alerian MLP and Infrastructure Index (AMZI), followed by the tax-burdened ETF AMLP (see MLP Funds Made for Uncle Sam). TGE is far less than 4.7% of North American midstream energy infrastructure, as shown by its 2.4% weight in the American Energy Independence Index. Because AMZI is limited to partnerships, the TGE proceeds will have to be reallocated across a subset of the pipeline sector, further increasing AMLP’s concentration and rendering it even less representative (see AMLP’s Shrinking Investor Base).