The Death Of Modern Monetary Theory

The last two years have provided an empirical test of Modern Monetary Theory (MMT), the idea that a government can borrow indefinitely in its own currency with no fear of bankruptcy. Stephanie Kelton is the cheerleader for testing the limits of fiscal prudence – I reviewed her book in late 2020 (see Reviewing The Deficit Myth). MMT doesn’t prescribe limitless spending. It is axiomatic that bankruptcy in one’s domestic currency can always be avoided by printing money – having the central bank finance debt issuance – so there’s nothing insightful about that. MMT holds that the economy’s capacity to produce goods and services without generating inflation is the true limit.

Even MMT’s most basic assertion, that non-inflationary consumption financed with debt is harmless, fails cursory scrutiny. Suppose Congress voted a giant July 4th party with the world’s biggest ever fireworks display funded by issuing 30 year bonds. MMT doctrine would allow this consistent with the inflationary limit. Most would find this absurd. Borrowing to finance transfer payments such as Medicare and social security, as we do now, is an equally indefensible passing of a burden to later generations for no benefit to them.

.avia-image-container.av-k5w38v-672f3156a9adc134c2758c5f21c73f84 img.avia_image{ box-shadow:none; } .avia-image-container.av-k5w38v-672f3156a9adc134c2758c5f21c73f84 .av-image-caption-overlay-center{ color:#ffffff; }

Fiscal policy has looked very MMT-like since Covid struck, so Kelton and other supporters have been gamely trying to manage the message. A year ago, Kelton appeared on a Bloomberg podcast titled, “How M.M.T. Won the Fiscal Policy Debate.” By last July, she was describing surging inflation as “temporary…growing pains.” Now even the NYTimes is expressing mild skepticism.

More recently, Kelton is distancing MMT from current fiscal policy, arguing that the former can’t be evaluated from the latter. She argues that deficit spending requires a CBO-like assessment to determine whether it will be inflationary, and that faithfully adhering to the economy’s speed limit will allow a country to maximize its non-inflationary spending.

It’s a bit like NAIRU (Non-Accelerating Inflation Rate of Unemployment). Central Bank utopia is keeping the economy close to NAIRU as much as possible. It doesn’t happen – not just because economic surprises inconveniently intrude, but because central bankers never know exactly where NAIRU lies. It’s only ever possible to identify it in hindsight, when the absence of inflation suggests more employment slack than anticipated, or rising wages demonstrate the opposite.

Wage increases that outstrip improvements in productivity are believed by most economists to be a necessary pre-requisite for inflation to become embedded and no longer “transitory” (to use Jay Powell’s now discredited term). Without knowing where NAIRU is, it’s impossible to know how close the economy is to running at full capacity, and therefore to gauge the inflation risk.

Government policy already aims to keep the economy moving at close to its speed limit. The Fed’s mandate is to seek maximum employment consistent with stable prices.

MMT is no more than a statement of the obvious masquerading as a profound theory.

Kelton argues that the spending limits to fiscal policy should be set by the CBO scoring the budget based on whether it would generate inflation or not. We should keep borrowing and spending up until the inflationary point. Calculating the deficit impact of a budget is complicated, but forecasting the inflationary result is a giant step farther. Although the CBO isn’t charged with the task Kelton would set them, the Federal Reserve is.

The Fed concluded that the March 2020 CARES Act ($2.2TN), the December 2020 Consolidated Appropriations Bill ($900BN) and the completely irresponsible March 2021 American Rescue Plan Act ($1.9TN) were not going to cause inflation. The Biden White House also believed this last dollop of fiscal profligacy wouldn’t be inflationary, even though Covid vaccines were already being administered to older Americans by the time it passed.

The Fed went even further and deemed the fiscal response inadequate to the economic challenge, because they maintained their own stimulus via rock-bottom interest rates and partial debt monetization.

It must be obvious to all that government forecasts of continued moderate inflation were dead wrong. Forecasting is hard, although prudent risk management would have seen the Fed curbing their ultra-accommodative stance a year ago, as we noted at the time (see Bond Investors Are Right To Worry). On February 23 last year, Jay Powell said, “At this point, the Federal Open Market Committee is seeking inflation running moderately above 2% for some time.” Following the most recent CPI report showing inflation since then at 7.5%, and 6.0% excluding food and energy, it looks like job done.

Why does Kelton think a CBO inflation analysis would have reached a different conclusion than economists in the White House and the Fed?

In case it isn’t already clear what a wealth-destroying philosophy Kelton promulgates, a recent blog post lists her favorite pre-emptive measures to smooth economic cyclicality and includes the following gem: “Instead of allowing millions of people to fall into unemployment each time the economy falters, workers could transition into a public service job that replaces some or all of their lost income.”

To what useful employment would such a Federal program direct former MMT economists, of which there is already a surplus?

Negative real interest rates have allowed the continued explosion of Federal indebtedness to occur with relatively little pain. MMT has nothing to say on this, but there are $TNs dedicated to fixed income with no need of a return on capital, simply a return of capital. Central banks, sovereign wealth funds, pension funds and others are enabling hitherto unseen levels of US debt accumulation.

If there is an inefficiency to be exploited, it is this excessive supply of cheap financing. The case for testing spending limits rests with the low cost of debt, not some idea that if we could only forecast inflation accurately, we could reach our full economic potential.

MMT was bunk when it was still just a theory. Now that it’s received a full empirical test, savers are left to deal with the consequences.

We have three funds that seek to profit from this environment:

Energy Mutual Fund

Energy ETF

Real Assets Fund

Please see important Legal Disclosures.


The Costs Of Bad Energy Policy

European policymakers are being forced to reassess energy policy. Premature reliance on intermittent renewables came up short last Fall (see Europe Follows California Into Renewables Oblivion). More recently, the EU’s reliance on Russia for 40% of its natural gas imports is being exposed as especially unwise with Russian troops poised to invade Ukraine.

Britain has moved steadily to use wind power, and when the normally windy North Sea was inconveniently calm they turned to imports of Liquified Natural Gas (LNG) because they have been phasing out natural gas storage.

Horizontal fracturing (“fracking”) is mostly limited to the US. In 2018 we chronicled Cuadrilla’s ill-fated attempt to drill for natural gas in Lancashire, northwest England (see British Shale Revolution Crushed: America’s Unique Ownership of Oil and Gas). With British households bracing for a 50% hike in power bills because of high natural gas prices (see Learning From EU Mistakes On Energy Policy), being more self-reliant for natural gas looks smart.

Hence the right wing Daily Telegraph is making the case that fracking would have shielded Britons from the worst effects of the energy crisis. Members of Britain’s ruling Conservative party are pressing PM Boris Johnson to relax rules against fracking. The country’s unrealistic aspirations to give up reliable energy are facing a reality check.

Meanwhile Germany is considering legislation to force increased storage of natural gas by utilities in time for next winter. Germany has rated reducing emissions ahead of energy security, a prioritization that looks poorly considered.

European leaders have embraced renewables faster than many American states. Reducing emissions is a laudable goal, but many of these policies betray little serious thought about the consequences for reliability or cost.

New Jersey’s Democrat legislature passed the Global Warming Response Act (GWRA) in 2007, and updated the law in 2019. It requires an 80% reduction in annual CO2 equivalent emissions (i.e. converting other greenhouse gases such as methane into CO2 equivalents based on their warming impact and rate of degradation) below the 2006 total by 2050 (dubbed “80X50”). This requires a reduction by then of 96.5 million tonnes per year.

China plans to increase emissions until 2030, and only then start reducing them to zero by 2060. New Jersey’s population is around 0.6% of China’s, and the reduction under the GWRA is approximately 1% of China’s current emissions.

Maybe liberals are poor negotiators. The government officials that negotiate climate change agreements are probably more worried than average about the planet – that must be why western countries have agreed to continue reducing emissions while the biggest emitters like China are still increasing theirs. Shouldn’t we all be reducing CO2 at the same time, rather than creating capacity for others to keep generating more?

The people implementing NJ climate change regulations are playing fast and loose with the data. A recent proposal that buildings replacing fossil-fuel fired boilers would have to install electric ones instead estimated “the operational costs for an electric boiler may be between 4.2 and 4.9 percent higher.”

A subsequent correction quietly conceded, “The Department’s analysis indicated that operational costs for an electric boiler would result in a 4.2 to 4.9 times increase (rather than 4.2 to 4.9 percent increase).”

It’s a trivial typo, except that the proposed regulation must be uneconomic following the correction. This reflects the same absence of cost-benefit analysis that has led the EU to depend so heavily on renewables and Russian natural gas for energy. The Europeans are reassessing the energy transition and pragmatic changes will follow.

It’s in nobody’s interests for energy policy to be run such that everything is examined through the single lens of its impact on emissions.

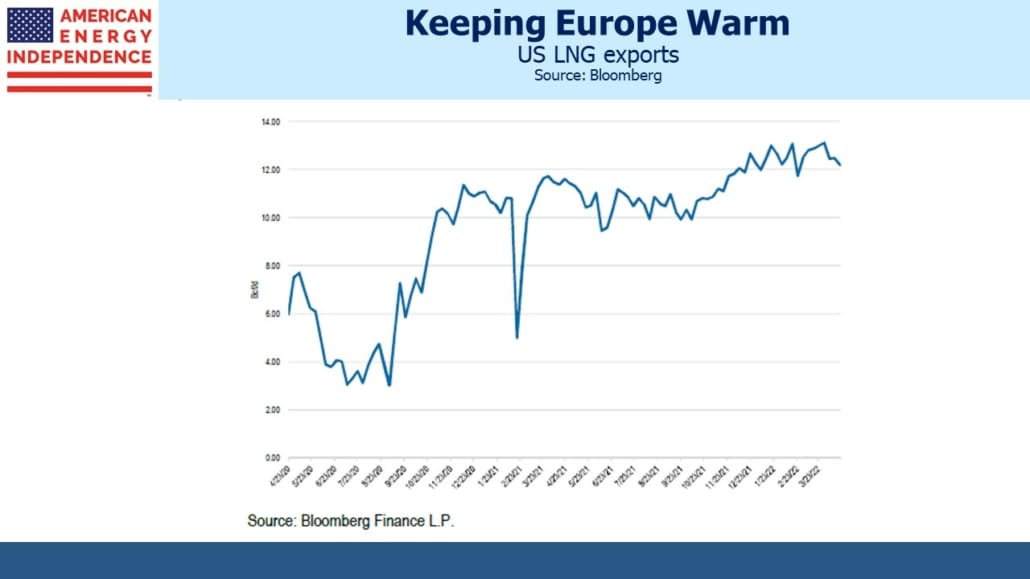
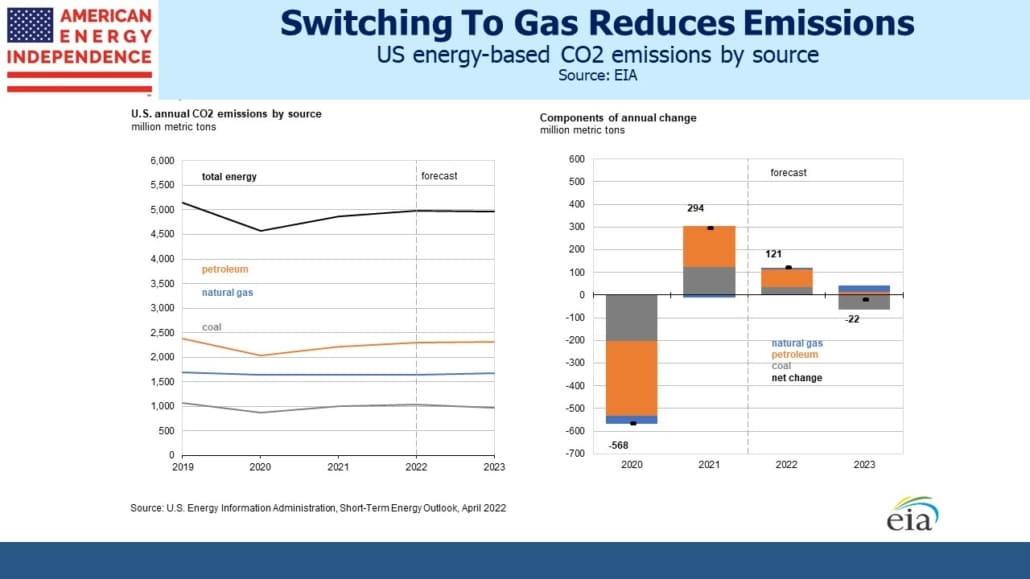
The good news for investors is that when idealistic plans collide with realism, natural gas is often the winner. An example is Europeans buying more LNG from the US, reducing their vulnerability to Russia’s capricious supply decisions and intermittent renewables.

.avia-image-container.av-wepfim-e9da39197acedd4cfc18e1bccce540e1 img.avia_image{ box-shadow:none; } .avia-image-container.av-wepfim-e9da39197acedd4cfc18e1bccce540e1 .av-image-caption-overlay-center{ color:#ffffff; }

Natural gas power generation is most flexible in reacting to shifting demand. NJ offers an informative example. During the summer when power demand goes up because of air-conditioning, natural gas responds. Natural gas based power production is 94% correlated with the total. Renewables at a 4% share aren’t relevant but have a similar low correlation to nuclear – neither is able to change output when customers need them to.

The energy transition means electrification. Natural gas, which is reliably 40% of US power production, will continue to benefit from this shift in NJ and elsewhere – as long as the bureaucrats don’t follow New England where new pipelines are blocked with LNG regularly imported rather than transported by pipeline from Pennsylvania (see Why Staying Warm In Boston Will Cost You).

We’ll be watching carefully.

We have three funds that seek to profit from this environment:

Energy Mutual Fund

Energy ETF

Real Assets Fund

Please see important Legal Disclosures.


Pipelines Offer Protection From European Conflict And The Fed

Friday afternoon’s warning from the White House that a Russian invasion of Ukraine could come at any time did at least distract attention from Thursday’s CPI. Energy stocks rose while the S&P500 fell – a welcome negative correlation.

Bonds also recouped their losses from the prior day. Over several decades the bond market’s sensitivity to rising energy prices has evolved. In 1990 when Iraq invaded Kuwait, threatening to cut supply of oil to the west, bond yields rose sharply. The memories of 1970s inflation caused by OPEC raising prices was still fresh.

At other times, rising crude has been regarded as a tax hike, since it does represent a wealth transfer from oil consumers to producers. The Shale Revolution altered US sensitivity to oil prices by increasing the portion of the economy that benefits when they’re high. Your blogger has to restrain his glee when friends complain about the price at the gas pump or how much they’re spending on heating oil. During the Covid-induced collapse in the energy sector in early 2020, cheap gasoline provided scant solace for depressed portfolios. We look forward to crude oil continuing its march higher.

Friday saw higher prices for bonds, crude and pipelines, as the rest of the market feared European conflict will hurt growth and sought refuge in energy.

The midstream sector’s strong performance does highlight its resilience to geopolitical risk. Enbridge, North America’s biggest pipeline company, reported earnings on Friday. Enbridge has no assets outside North America, a welcome protection from any global disruption.

Pipeline pricing is often tightly regulated, to prevent gouging of customers. A substantial portion of the industry sets tariffs based on the PPI. Last month the Federal Energy Regulatory Commission (FERC) set the pricing index for the next five years as PPI-0.21%.

Inflation as measured by the PPI Final Demand Goods, the index used by FERC, was 13.6% last year.

.avia-image-container.av-t58lun-15b394df9ea4014f3c3bd00b12489b79 img.avia_image{ box-shadow:none; } .avia-image-container.av-t58lun-15b394df9ea4014f3c3bd00b12489b79 .av-image-caption-overlay-center{ color:#ffffff; }

This built-in protection against inflation used to receive more attention. Prior to 2014, before the Shale Revolution had led to some dubious capital allocation decisions, MLPs (since that’s mostly where pipelines were housed back then) attracted investors because of their stable yields that came with built-in price escalators.

The tumult of the last few years has not altered this feature, even though it is rarely on the list of reasons investors cite when making an allocation. But over the next several quarters, expect to see increased mention about Cost of service (CoS) adjustments to pipeline tariffs.

Enbridge, to cite one example, says that 80% of its EBITDA comes from CoS contracts. In August we noted that Wells Fargo estimated a 3% lift to sector EBITDA from PPI escalators (see Pipelines Still Linked With Inflation). This was based on a 2021 PPI estimate of 5.5%, less than half the actual result.

What is becoming clear is that when the FOMC reinterpreted their dual mandate of maximum employment with stable prices in 2019, they made a subtle but important shift in favor of full employment at the risk of elevated inflation. Although it seems surreal given last week’s CPI release, three years ago they were concerned at the tendency of inflation to come in below their 2% target, and the constraint this placed on monetary policy to be stimulative without resorting to negative nominal rates.

Within six months Covid stopped the economy dead in its tracks, and Congress unleashed enormous fiscal stimulus through early 2021. The Fed’s prolonged monetary stimulus, synchronized with $TNs of debt-financed spending, reflected their new bias towards employment and willingness to risk inflation.

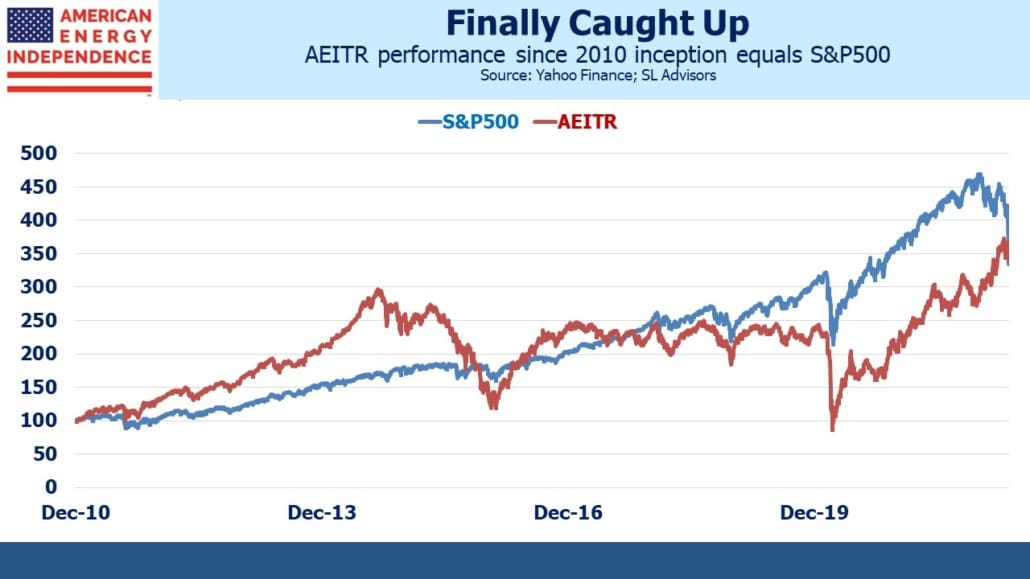
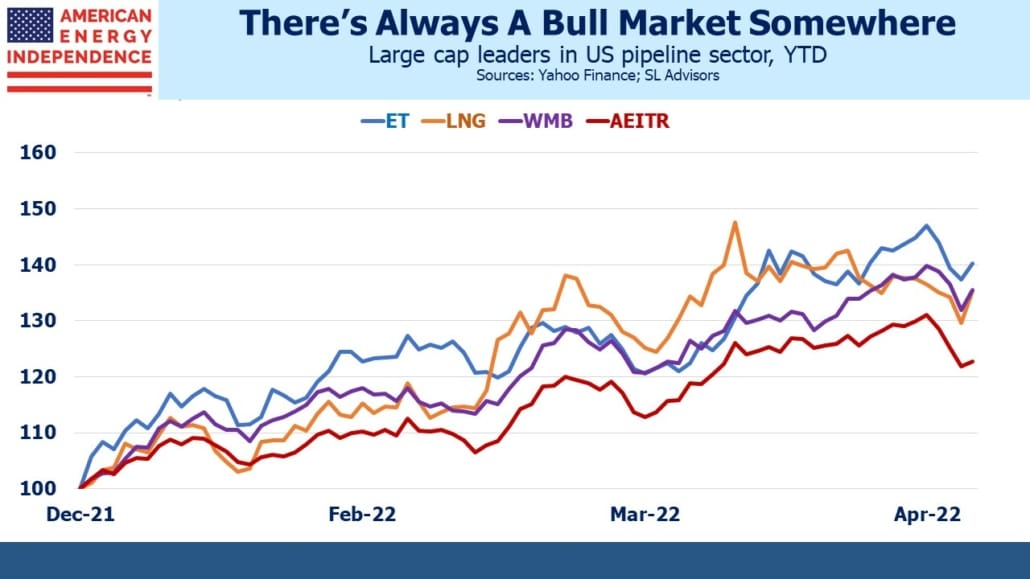
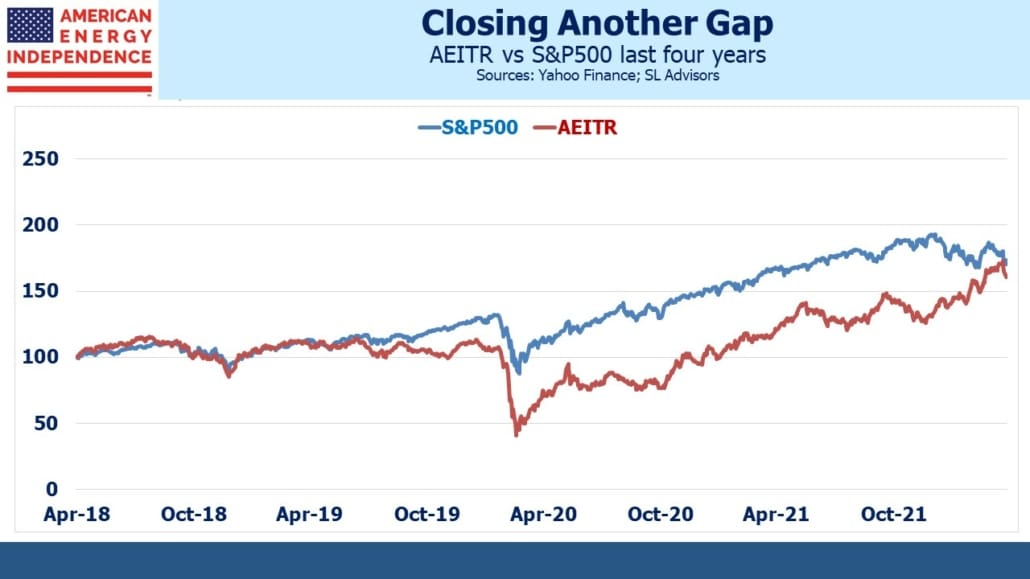
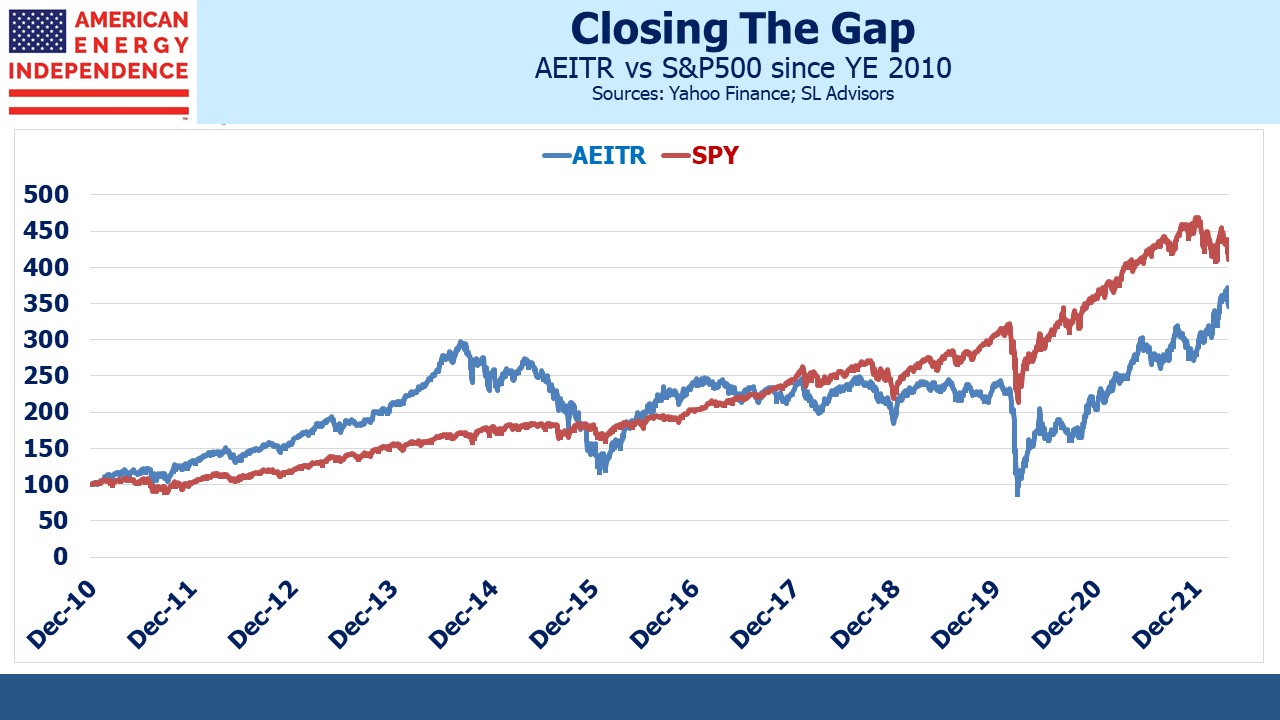
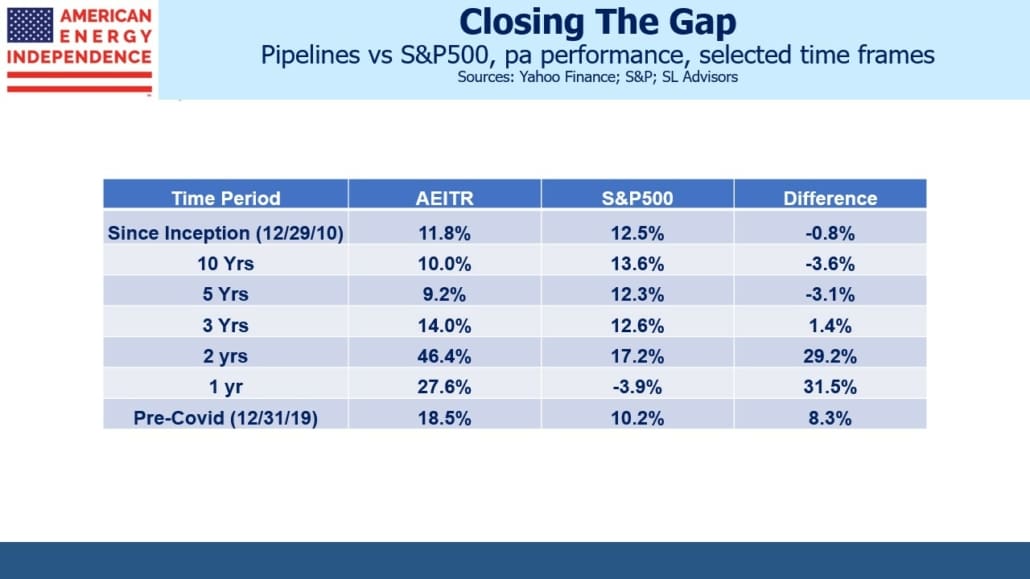
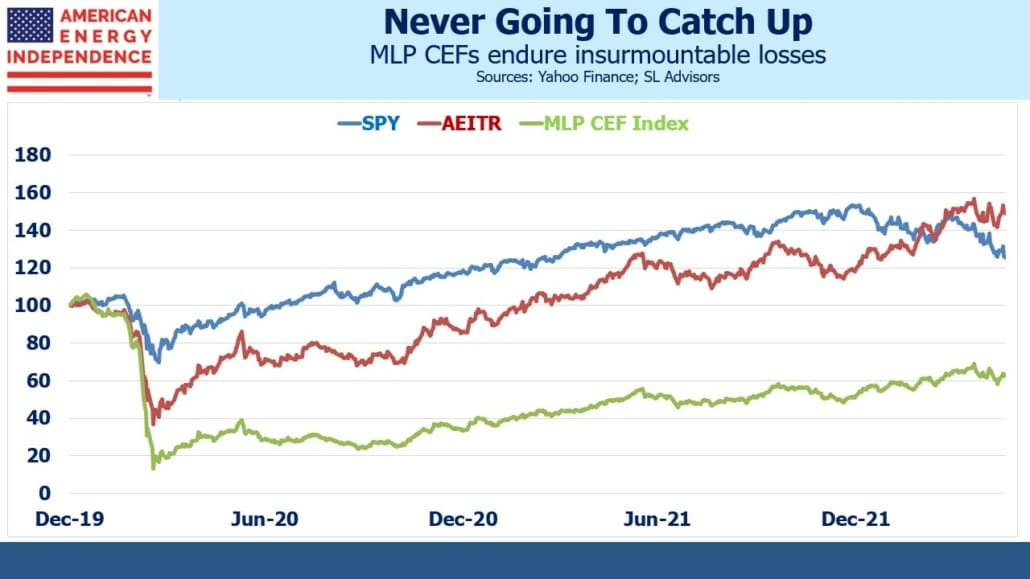
Following a near-death experience in the early months of Covid, the pipeline sector has been steadily closing the performance gap with the S&P500. On Friday the broad-based American Energy Independence Index (AEITR) recorded another good day, beating the S&P500 by 4.7%. It’s within easy reach of being ahead of the S&P500 from the end of 2019, wiping out the entire Covid-related period of underperformance.

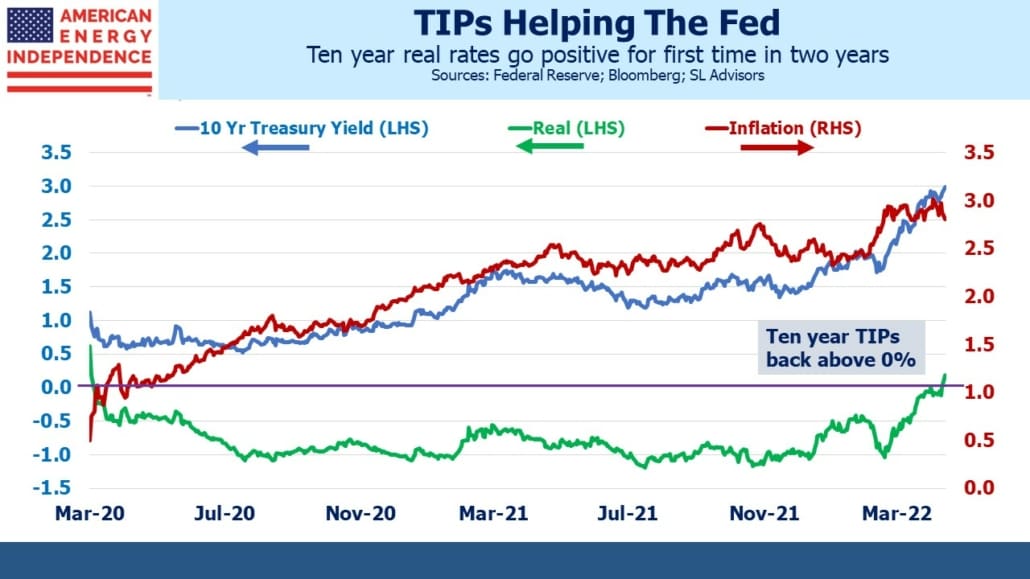
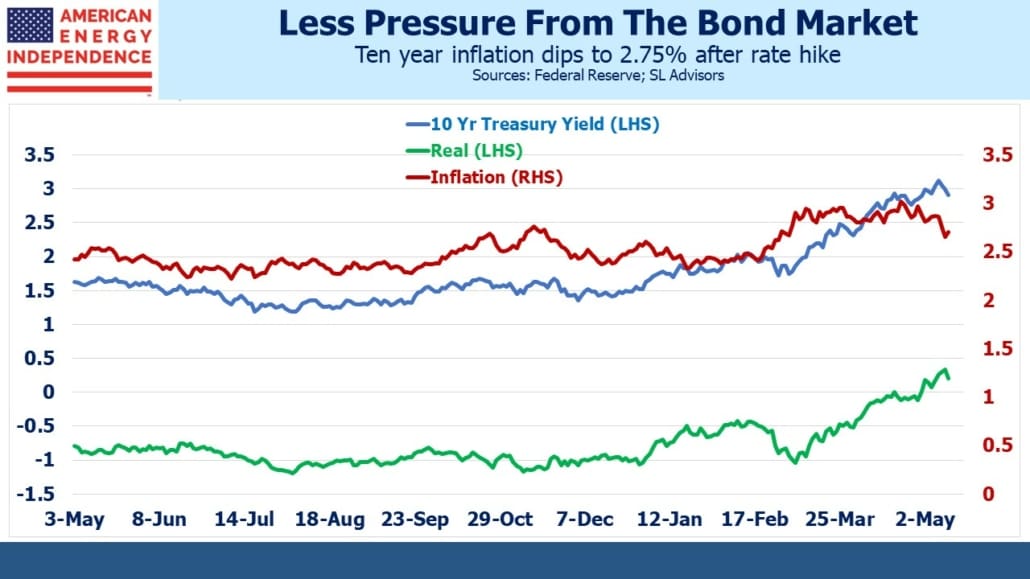
Demand for inflation protection remains strong. Treasury Inflation Protected securities (TIPs) are an example – real yields (i.e. after inflation) are still negative. Big investors are starting to adjust their long term inflation expectations. For example, Blackrock expects inflation to average 3% over the next three years, and five year TIPs are priced for 2.8%. As Americans come to accept that the days of 2% inflation are behind us, it’ll be increasingly difficult for the Fed to bring it back down.

The demand for real assets such a midstream energy infrastructure is driven in part by investors who want protection against the Fed’s new tolerance for a little faster inflation. 3% over the long run is a safer bet than 2%.

We have three funds that seek to profit from this environment:

Energy Mutual Fund

Energy ETF

Real Assets Fund

Please see important Legal Disclosures.


The Market’s Too Relaxed About Interest Rates

Mohamed El-Erian maintained his criticism of the Federal Reserve, with an op-ed on Monday morning (see Fed and ECB still behind the inflation curve). It’s remarkable that the ECB’s “hawkish pivot” simply resulted in a fourth quarter tightening no longer being off the table. The Fed meanwhile moves ahead in their predictable fashion even while their predictions about inflation are wrong.

It’s easy to criticize the Fed’s delinquent normalization of policy, but also worth acknowledging that they have engineered a booming economy with full employment, rising asset prices and unmet demand for almost everything. It seems churlish to complain about inflation under such circumstances – given the labor market, many workers can simply demand higher pay to compensate for rising prices.

Last Friday’s employment report showed that’s roughly happening – average hourly earnings for all employees rose 5.7% over the past twelve months. A week earlier, the Employment Cost Index (ECI), which is released quarterly, showed compensation of private industry workers rose 4.4% last year. Pay increases across groups ranged from 3.5 percent for management, professional, and related occupations to 7.1 percent for service occupations.

.avia-image-container.av-14tt7kl-21787e4571695fca278d76a8e941b304 img.avia_image{ box-shadow:none; } .avia-image-container.av-14tt7kl-21787e4571695fca278d76a8e941b304 .av-image-caption-overlay-center{ color:#ffffff; }

CPI inflation is running at 7%. Without food and energy, it’s lower at 5.5%, but excluding these now makes little sense because everybody uses energy and eats. These two components can swing around which is why economists like to exclude them, but currently they’re going up like everything else.

Some will always find reasons to be despondent, but asset prices and employment are high while interest rates remain low. The drop in labor force participation is partly due to higher than average numbers of new retirees, enabled by swollen 401Ks and downsizing to a smaller home on better terms than they ever expected. A more popular president would be emboldened to quote Britain’s former PM Harold MacMillan, who in 1957 said his countrymen had, “never had it so good.” Hold on to this economic moment – it will one day be a fond memory.

.avia-image-container.av-pm4k6t-a0b79b1cced702feeb6cbc6e4a64c72e img.avia_image{ box-shadow:none; } .avia-image-container.av-pm4k6t-a0b79b1cced702feeb6cbc6e4a64c72e .av-image-caption-overlay-center{ color:#ffffff; }

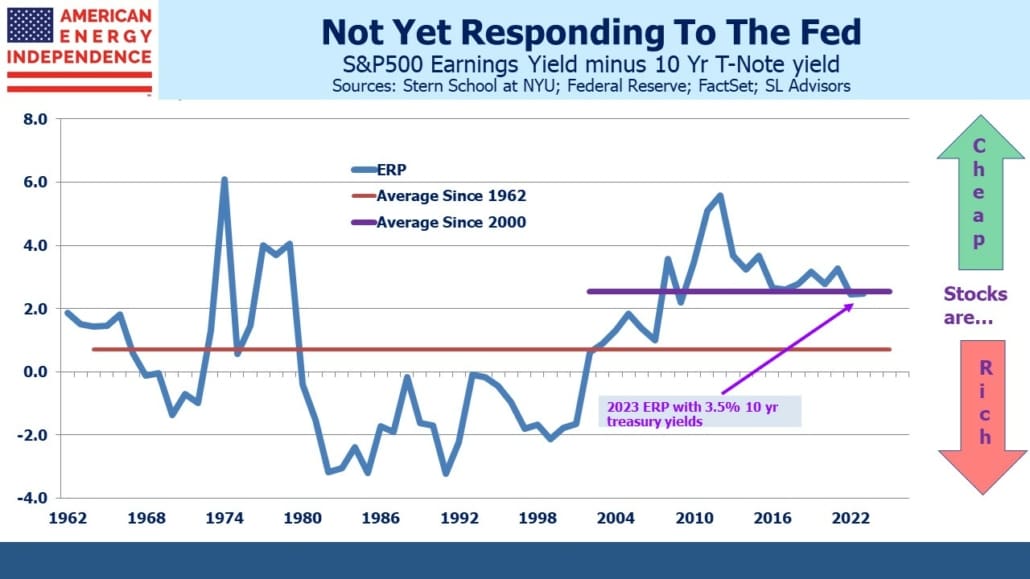
Economic orthodoxy dictates that we embrace the hair shirt of higher rates as penance for such good economic fortune. So we will. But the Fed will need to create a headwind to all these positives long before inflation is back down to its 2% target. It’s implausible that this will happen without short term rates moving above 2%. Being a Fed critic is satisfyingly self-indulgent, but not as useful as figuring out how to profit from their actions.

Last month in Why You Shouldn’t Expect A Return To 2% Inflation we noted the incongruity of well-contained ten year inflation expectations with a modest 2% rate cycle peak, all as derived from the bond market. The yield curve hasn’t shifted much since then – an ECI report slightly better than expected was later neutralized by the strong payroll report.

Today’s FOMC interprets its dual mandate of maximizing employment consistent with stable prices in a way that is more risk-tolerant of inflation while more desirous of seeing everyone employed. Americans’ willingness to tolerate a Fed-induced slowdown in pursuit of price stability is untested in over 30 years. Fed chair Jay Powell often says, as he did last month, “We will use our tools to support the economy and a strong labor market and to prevent higher inflation from becoming entrenched.”

For now, Biden has provided political cover for the Fed by endorsing their long-awaited policy shift. Nonetheless, it’s easy to imagine Powell’s Congressional critics once unemployment starts to rise: coping with 7% inflation is bad enough when you’re employed, but harder when you’re out of work.

We’ve been warned for decades that fiscal profligacy will lead to disaster, and so far Stephanie Kelton’s Modern Monetary Theorists are winning that debate (see Reviewing The Deficit Myth). Why is 2% inflation any more vital to our economic wellbeing than a Debt:GDP ratio below 100%? We’ve already abandoned the latter with no apparent consequence.

AOC and her squad are ready to pounce.

Esther George, President and CEO of the Kansas City Fed, gave a speech recently in which she cited research showing that the Fed’s bulging balance sheet is depressing long term bond yields by as much as 1.5%. Take away that support, and ten year treasuries would yield almost 3.5%, forecasting a rate cycle peak easily above 2%. The presence of such support limits the impact of rising short term rates on the economy, requiring an even higher cycle peak than would be the case if the Fed’s balance sheet was back at pre-2008 levels.

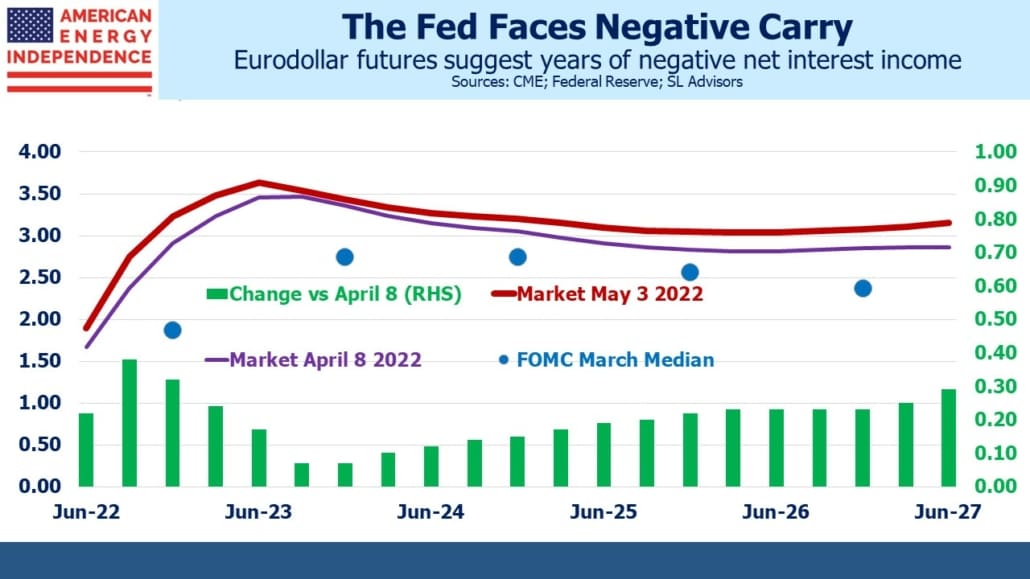
The actionable trade is to bet on a higher cycle peak – shorting treasury securities or eurodollar futures with a three to five year maturity is the most efficient. They should eventually price in a Fed Funds rate of 2.5-3%. If by then the economic pain is audible in Congress, tolerance of 3% long term inflation will start to look more likely than a 3% overnight rate. But one or the other is assuredly coming – and probably both. This week’s CPI report may be a catalyst.

We have three funds that seek to profit from this environment:

Energy Mutual Fund

Energy ETF

Real Assets Fund

Please see important Legal Disclosures.


Learning From EU Mistakes On Energy Policy

The other day my partner Henry Hoffman was commenting on what his family pays for natural gas to heat their home in Pelham, NY. Winters in the northeast US are not for everyone – your blogger misses most of the worst weather by evacuating to Florida for a few months.

Natural gas is the most common source of heat in most northern homes. The US continues to enjoy the supply benefits of the Shale Revolution, although those benefits are spread unevenly. Pennsylvania became a huge source of natural gas that has kept prices low for those that use it.

US states have significant influence over energy policies. Where climate change is a concern of political leaders, what typically follows are poorly conceived progressive strategies that increase prices and create inconvenience for residents of that state. New Jersey, New York and Massachusetts are three states well positioned to rely on natural gas from the Marcellus shale. Their energy policies could be dubbed “Left-leaning” (NJ), “Liberal” (NY) and “Wacky” (MA).

.avia-image-container.av-qit9ad-ab463e2d076d30a8c9eb9665847bf211 img.avia_image{ box-shadow:none; } .avia-image-container.av-qit9ad-ab463e2d076d30a8c9eb9665847bf211 .av-image-caption-overlay-center{ color:#ffffff; }

NJ passed legislation in 2020 mandating an 80% reduction in greenhouse emissions by 2050. Among other steps it is developing offshore windpower. So far, these efforts haven’t been too disruptive to life as we know it. The Energy Administration Information shows that in 2020 NJ’s power mix was 50% natural gas and 2% solar and wind. NJ households are paying 17% less for natural gas than a decade ago.

New York state’s governor wants to ban natural gas connections to new buildings in the state, copying a similar plan enacted in New York City. The Marcellus shale even extends into the state, but no drilling is allowed. New York’s power mix is 41% natural gas and 4% solar and wind. NY households have seen natural gas prices rise 3% over the past decade even though the US is a significant exporter and has some of the world’s cheapest supply.

Massachusetts, which relies on natural gas for 78% of its electricity generation (9% solar and wind) and half of its residential heating, has blocked new gas pipelines coming into the state in spite of the fact that they are so dependent on it. Boston regularly imports Liquified Natural Gas (LNG) from the Caribbean and in the past has even bought from Russia. This forces them to compete with European and Asian buyers who have paid prices 10X or more higher than US domestic prices in recent months. Massachusetts has completely missed the benefits of increased US supply, with prices 9% higher than a decade previously.

.avia-image-container.av-19twu1x-f14a913b8081bd599ac137f1f950fcd3 img.avia_image{ box-shadow:none; } .avia-image-container.av-19twu1x-f14a913b8081bd599ac137f1f950fcd3 .av-image-caption-overlay-center{ color:#ffffff; }

Energy policy in Massachusetts has managed to combine heavy reliance on natural gas with impediments to access it. Such masochistic virtue signaling receives scant attention other than from the self-congratulating political leaders who have engineered such an outcome.

The result is that over the last decade or so, average natural gas prices in NJ have trended lower than those in more progressive NY and MA. I hesitate to hold NJ up as an example of enlightened energy policy, because there are Democratic political leaders in Trenton probably envious of what NY and MA policymakers have imposed on their residents. But at least NJ isn’t importing LNG from foreign countries.

.avia-image-container.av-2qnxdx-5352aefc72359c3576bc45509359e4f5 img.avia_image{ box-shadow:none; } .avia-image-container.av-2qnxdx-5352aefc72359c3576bc45509359e4f5 .av-image-caption-overlay-center{ color:#ffffff; }

US states can learn from Europe, where excessive reliance on renewables has led to an energy crisis with eye-watering prices for natural gas. The UK is an example. It gets around a quarter of its electricity from renewables – mostly wind from the usually reliable North Sea. But northwest Europe isn’t always windy, and that contributed to the UK’s sudden increased reliance on natural gas and coal. Renewables are not just limited to sunny/windy days; when they don’t produce they all go down at the same time. Dispatchable energy sources such as natural gas have diversified uptime risk. Ten independent plants are unlikely to fail simultaneously.

One result is that the UK regulator has approved an increase in the cap on household energy bills that will see more than 50% hikes for many within a couple of months. The government has responded with income-based subsidies to soften the blow, only three months after pressing the COP26 Climate Change conference to eliminate “inefficient fossil fuel subsidies.”

Germany has among the most expensive electricity in the world, also because of their switch to renewables.

These expensive and not very impactful moves away from cheap, reliable energy are swamped by increasing emissions in emerging countries such as China, which doesn’t plan to reduce emissions before 2030. This is because they value raising living standards more than curbing emissions, a reality overlooked by climate extremists attempting to impose dysfunctional policies on western communities.

It’s becoming increasingly clear that the energy transition will be disruptive and expensive. Politicians suggesting anything less are not thinking through the issues.

The EU has been farther ahead in seeking to reduce CO2 emissions. As a result, they’ve confronted more of the problems than most US states, and offer some useful examples. In a triumph of pragmatism over religious fervor, the EU recently defined natural gas and nuclear power as clean energy. There are caveats, such as that the natural gas must be displacing a coal-burning power plant and have CO2 emissions below a reasonably achievable threshold.

It’s a sensible move. So far the energy transition has delivered more expensive, less reliable energy without any discernible impact on emissions. Sharply higher prices will test the strength of public support for climate ambitions. States like New York and Massachusetts would be well served to follow the EU’s lead. Cheap natural gas is right on their doorstep.

We have three funds that seek to profit from this environment:

Energy Mutual Fund

Energy ETF

Real Assets Fund

Please see important Legal Disclosures.


Why You Should Follow The Money In Pipelines

Last year fund outflows totaled $1.94BN for the midstream energy infrastructure sector (still often referred to as the MLP sector even though most of the market cap is corporations) according to JPMorgan. October was the only positive month, at a modest $6MM. 2021 was the third straight year that fund outflows exceeded $1.9BN. The last full year of inflows was in 2016.

It would seem hard to find much positive in those statistics – so read on.

.avia-image-container.av-2076cye-d18ceaa518965cddd07d566fcc3b1ff4 img.avia_image{ box-shadow:none; } .avia-image-container.av-2076cye-d18ceaa518965cddd07d566fcc3b1ff4 .av-image-caption-overlay-center{ color:#ffffff; }

Commentators often refer to money flowing into or out of a market – a description that often betrays intellectual laziness. Since for every buyer there’s a seller, trading flows rarely result in net flows of money. The notable exceptions are (1) IPOs, when new money is invested to purchase shares, and (2) buybacks, when a company retires shares leaving the sellers with net cash taken out from the market.

Ordinarily, the $1.94BN in sales from pipeline sector funds would have been bought by other investors – institutions, high net worth or retail investors – and would simply represent a change of ownership.

But in recent years MLPs and midstream corporations have been announcing buybacks. It’s another example of the industry’s continuing desire to demonstrate financial discipline and return capital to shareholders. When the MLP model prevailed, buybacks were rare since the MLP was always intended to be a funding vehicle, issuing equity when directed by its General Partner (GP) in order to build or buy assets – often from the GP itself in “drop-down” transactions. It’s why we believed GPs were always a better bet than the MLPs they controlled (see The Power of the MLP GP from 2014).

For an MLP to repurchase its own shares would be contrary to its raison d’etre.

Poor capital allocation decisions during the Shale Revolution led to many big MLPs converting to corporations. This was so they could access more traditional investors rather than the US taxable, K-1 tolerant high net worth buyers that had become disillusioned with serial distribution cuts, as well as for various tax advantages for the GP.

.avia-image-container.av-1s9ikwm-2f16b784a712f6ca4c976b343cb97abe img.avia_image{ box-shadow:none; } .avia-image-container.av-1s9ikwm-2f16b784a712f6ca4c976b343cb97abe .av-image-caption-overlay-center{ color:#ffffff; }

This led to a shift to more traditional performance metrics including total shareholder return (dividends plus buybacks). A selection of the biggest companies shows over $13BN in announced buyback programs. These only impact flows when they’re implemented though – but three companies’ actual 2021 buybacks executed in the open market equal 43% of the $1.94BN in net fund outflows from the sector. They are Enterprise Products Partners, Magellan Midstream and MPLX.

Most companies have yet to announce full year earnings with 4Q21 buybacks – of the three, only the EPD figure is for all of 2021.  Wells Fargo estimates that midstream companies in their coverage repurchased $2.9BN of stock in 2021 and see that number steadily increasing in the coming years.

In the first of two privately negotiated transactions, Hess Midstream (HESM) repurchased $750MM in LP units from its parent and investor Global Infrastructure Partners, which also resulted in a commensurate sharecount reduction and increased ownership of HESM by its shareholders. The second private deal saw Crestwood buy out their general partner and investor First Reserve for $400MM.

.avia-image-container.av-11cylzq-48953f3911dff843fd29e44368fb014a img.avia_image{ box-shadow:none; } .avia-image-container.av-11cylzq-48953f3911dff843fd29e44368fb014a .av-image-caption-overlay-center{ color:#ffffff; }

What it means is that when all the figures are added up for last year, all the fund redemptions by retail investors were easily absorbed by the operating companies themselves. Once FY 2021 reports are published this figure will move higher.

The last five years have been emotionally draining for anyone with an overweight to the energy sector. Your blogger can attest that equal measures of resilience and stubbornness were necessary to maintain holdings through early 2020, so as to participate in the strong recovery that followed. Some of the retail sellers were just weary.

.avia-image-container.av-j63xpy-02f05b8a11c1a8b9a7277a7be173088b img.avia_image{ box-shadow:none; } .avia-image-container.av-j63xpy-02f05b8a11c1a8b9a7277a7be173088b .av-image-caption-overlay-center{ color:#ffffff; }

Energy executives are genetically engineered to spend on new projects – new oil and gas output for E&P companies, and new infrastructure for midstream. Thousands of executives have made their careers by putting money into the ground. All these companies and others have rejected internally generated capex proposals, some with optimistic IRRs, in favor of buying back stock. Given the energy sector’s culture, CFOs must show that reducing the share count by returning cash to shareholders to be exceptionally attractive to compete with the desire of some colleagues to spend the money on building projects instead. Also thank environmental extremists for throwing up so many roadblocks that capex has become less attractive.

In other words, in 2021 the less-informed sellers were taken out by better informed buyers.

It’s why net fund outflows didn’t visibly hurt performance. The broadly representative American Energy Independence Index (AEITR) was up 38.6% for the year, beating the S&P500 by almost 10%.

Given the size of the announced buyback programs, any sustained weakness in the sector is likely to be countered with more companies buying back their stock. There are also signs that funds outflows are ending – we’ve been seeing steady inflows into our products for some time, and interest to set up calls by existing and new clients has never been stronger. As the sector switches to experiencing fund inflows, it’s likely to propel prices sharply higher.

We have three funds that seek to profit from this environment:

Energy Mutual Fund

Energy ETF

Real Assets Fund

Please see important Legal Disclosures.



Thoughts on Jay Powell and European Natural Gas

Markets interpreted Fed Chair Jay Powell’s press conference bearishly last week. This was mostly because of omissions – he didn’t rule out raising rates at a faster pace than once a quarter, and he didn’t rule out beginning with a 50bp hike in March. As ever, monetary policy will be data-dependent.

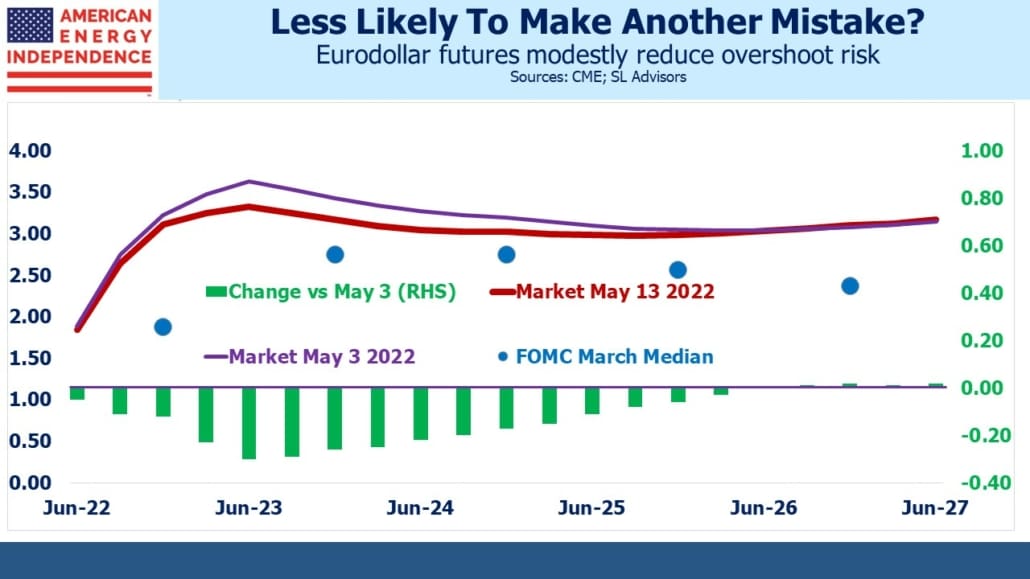
Eurodollar futures flattened further, with a faster pace of tightening being priced in while a cycle peak of 2% remains. The powerful feature of interest rate futures is that market prices rarely if ever fail to reflect available information. For the Fed to succeed in bringing inflation back to 2% without even raising rates above that level seems unrealistically optimistic, but one can scarcely suggest that investors have overlooked this implication. A substantial number must find this plausible. December ‘24 eurodollar futures yield almost exactly 2%, and to us a trade to 2.5% seems far more likely than 1.5%. The data will determine it.

.avia-image-container.av-20rno5p-4b079d26cd70cc29efa97d7ee1323475 img.avia_image{ box-shadow:none; } .avia-image-container.av-20rno5p-4b079d26cd70cc29efa97d7ee1323475 .av-image-caption-overlay-center{ color:#ffffff; }

The 4Q21 Employment Cost Index registered a 1% increase in total compensation – down from 3Q21 1.3% but nonetheless a 4% rate for the year.  We all know businesses that are struggling to hire people. Labor is tight. PCE inflation is running at a 5.8% annual rate. Both these reports were better than expected, and bonds consequently recouped earlier losses to finish the week roughly unchanged. The Fed’s languid normalization of monetary policy reflects their expectation, or hope, that incoming data will assuage the sting of criticism from past Fed members Treasury secretaries, and others.

Critics include David Kelly, chief global strategist at JPMorgan Asset Management, who said “They are behind the curve and they are guilty of being too easy for too long,”

.avia-image-container.av-1my3pwt-abbf8f591304b827708b28600bc652a9 img.avia_image{ box-shadow:none; } .avia-image-container.av-1my3pwt-abbf8f591304b827708b28600bc652a9 .av-image-caption-overlay-center{ color:#ffffff; }

Wall Street tightening forecasts are ratcheting up. Goldman and JPMorgan expect five this year; Bank of America seven; Nomura expects 50bps in March. The incongruity in the market is a yield curve forecasting a 2% cycle peak along with ten year inflation expectations of only 2.5%, which with real yields of –0.7% is anchoring ten year treasury yields below 2%. It’s hard to see how both forecasts can be correct – we think inflation is most likely to be higher, but for that reason the rate cycle peak probably will be as well.

Like the Fed, the path of rates will be data dependent.

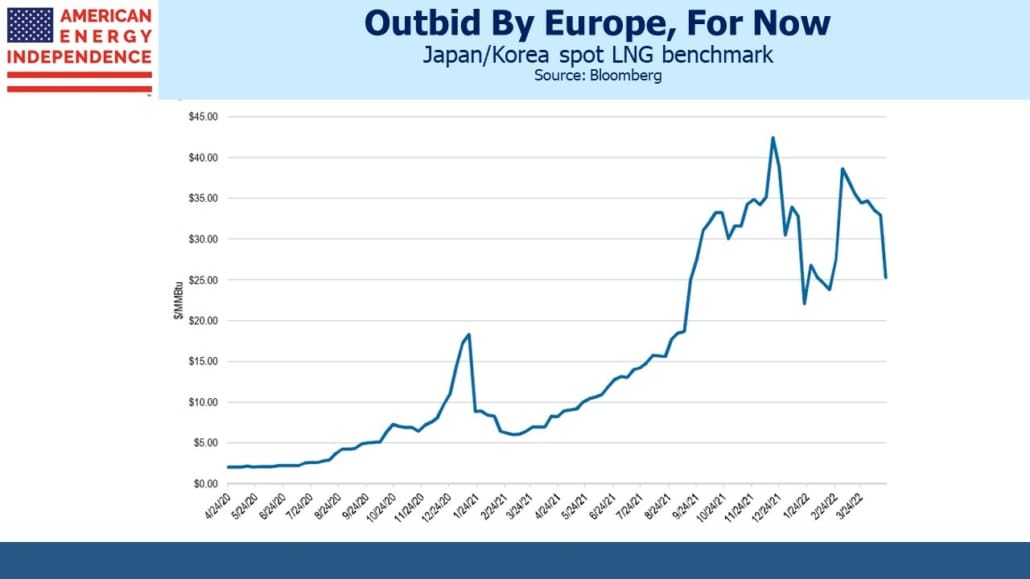
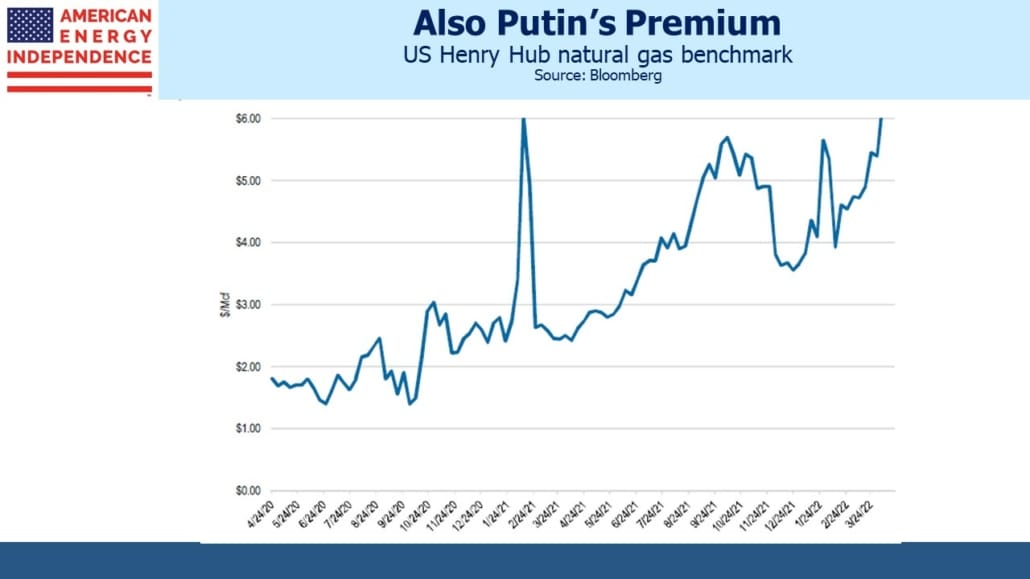
In other news, US natural gas prices drew attention when front month futures jumped sharply just prior to the February contract expiration. Volumes were low and covering by a few tardy short sellers probably the cause. Europe’s vulnerable gas supplies may be a factor, but the US has limited ability to make up any Russian shortfall because Liquified Natural Gas (LNG) export facilities are running close to capacity. The most likely result of a Russian invasion of Ukraine would be reduced European consumption as energy intensive industries are forced to halt production, either by ruinous prices or government edict.

.avia-image-container.av-194jrnx-1458fa4dc426cf500eb5587922fe8bb8 img.avia_image{ box-shadow:none; } .avia-image-container.av-194jrnx-1458fa4dc426cf500eb5587922fe8bb8 .av-image-caption-overlay-center{ color:#ffffff; }

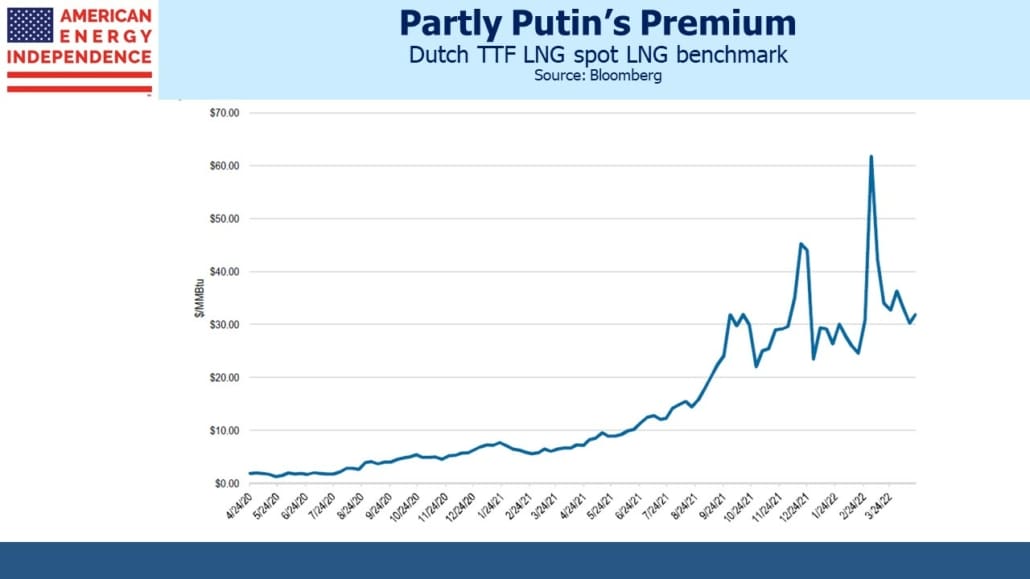
This is turning out to be more than simply a short-term problem. TTF futures, the European LNG benchmark, have been increasing two years out, exposing the enormous strategic error planners in Germany and elsewhere have committed in relying so heavily on Russia. January ‘24 futures have more than doubled from a year ago. European households will be paying more for electricity.

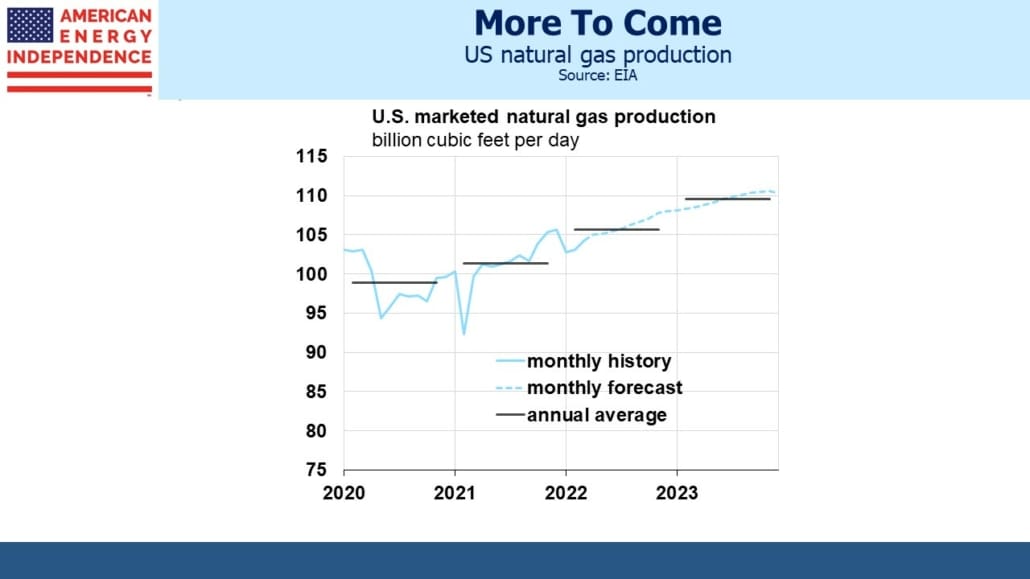
The price difference to the US is easily sufficient to draw more US LNG exports if they weren’t capacity constrained. However, shipments will increase over the next year or so, which will modestly underpin domestic prices and support volume growth. Forget about what the climate extremists may strive for – global natural gas demand is going to grow, to the benefit of investors in producers and midstream energy infrastructure.

.avia-image-container.av-wm7hot-ee56ec68d654a8ee3f3c9f9c008c46f7 img.avia_image{ box-shadow:none; } .avia-image-container.av-wm7hot-ee56ec68d654a8ee3f3c9f9c008c46f7 .av-image-caption-overlay-center{ color:#ffffff; }

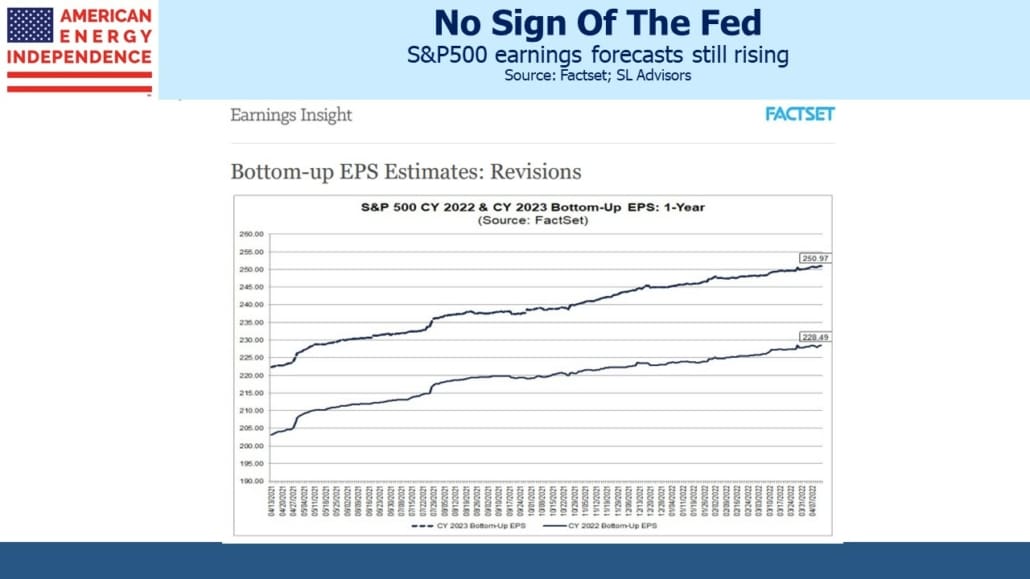
For further confirmation of the energy sector’s newfound fiscal prudence, note the decline in its share of S&P500 capex between 2014 and now. Thanks to Barry Knapp of Ironsides Economics for highlighting this in his very readable weekly newsletter. The White House is caught between proclaiming the demise of traditional energy while pleading with OPEC to increase production. Energy investors are benefiting from higher prices with less spending.

Finally, the ever-colorful Jim Cramer weighed in against the hapless Cathie Wood and her ARK Innovation ETF (ARKK) with a clip that’s gone viral. The Tuttle Capital Short Innovation ETF (SARK) bets directly against ARKK’s holdings, and Cramer memorably emptied a bottle of Cutty Sark over a table of figures representing ARKK. It’s 25 seconds of theatre masquerading as unconventional investment advice – although worth noting that in SARK’s brief existence its investors have done better than ARKK’s, since the latter are net down (see ARKK’s Investors Have In Aggregate Lost Money). Cramer must like Buffet’s quip (“If you’re not going to kick a man when he’s down, when are you going to?”) even at the cost of his chivalrous credentials.

We have three funds that seek to profit from this environment:

Energy Mutual Fund

Energy ETF

Real Assets Fund

Please see important Legal Disclosures.
.


Energy As A Hedge Against Geopolitical Risk

It’s a measure of the increased importance of natural gas to the world economy that geopolitical tensions now move its price the way crude oil has responded for decades. Russian troops massing on the border with Ukraine have shed an uncomfortable light on Europe’s vulnerable natural gas supply. Climate extremists are partly to blame because they’ve assumed windmills can solve every energy problem.

Germany’s government is still dead set against nuclear power, and is lobbying the EU to omit it from the revised list of clean energies. But relying on Russia for so much of Germany’s natural gas has constrained their ability to respond to Russian aggression elsewhere in Europe. US energy policy, whatever its faults, is more enlightened than Europe’s.

.avia-image-container.av-zub0n6-05903474a360a7cf0da18b04ab3f9919 img.avia_image{ box-shadow:none; } .avia-image-container.av-zub0n6-05903474a360a7cf0da18b04ab3f9919 .av-image-caption-overlay-center{ color:#ffffff; }

In recent weeks, the Ruble’s moves against the US Dollar have been calibrated to the fluctuating odds of a Russian military incursion into Ukraine with its consequent damage via sanctions to the Russan economy. The deployment of NATO assets to member countries in the region represents another step in escalation that has drawn the market’s attention.

.avia-image-container.av-jhs15u-d863e712e53d04af73e50a529a1bc41f img.avia_image{ box-shadow:none; } .avia-image-container.av-jhs15u-d863e712e53d04af73e50a529a1bc41f .av-image-caption-overlay-center{ color:#ffffff; }

But Russia isn’t uniquely vulnerable – European natural gas futures have begun moving with the Ruble too, reflecting the possibility of supply disruptions if Russia chooses to respond to sanctions by using its own economic leverage.

Geopolitical risk often comes with fears of supply disruption to crude oil, but this might be the first time in history that natural gas prices have been sensitive to the possibility of armed conflict. It’s rarely easy to predict such events, but investments in the energy sector can be a source of some comfort when uncertainty is driving the market lower. The strong recent performance of pipelines versus the S&P500 may be a coincidence – the shift from growth to value has been more important – but holding US energy infrastructure assets does bring the comfort of knowing America retains more control of its destiny than any other country. Domestic natural gas pipelines and LNG export terminals are invulnerable to foreign conflict and potentially able to opportunistically benefit from supply disruptions elsewhere.

Eastern Europe is the current focus, but it’s not the only potential hotspot. On the weekend, the United Arab Emirates intercepted a ballistic missile fired over Abu Dhabi, probably by rebels in Yemen where a proxy war between Saudi Arabia and Iran continues to smolder.

China has been adopting a more bellicose posture towards Taiwan, whose independence from the mainland it has never recognized.

North Korea periodically tests new missiles, sometimes flying them over Japanese territory.

None of these other flashpoints are related – and yet, the risk is that if one heats up it raises the tension elsewhere. This is because all of them to some degree draw the oversight and potential engagement of the US. If American military attention and resources are focused in one area, bad actors in another may perceive an opportunity to act when the superpower is briefly looking away.

It’s this strategic challenge that underlies US military planning to be prepared to fight two major wars simultaneously – most likely one in Europe and another in Asia. The thinking is that conflict in one makes an adversary more likely to take provocative action in the other theatre.

Russia’s troops massed on Ukraine’s border are likely to move within weeks – either as invaders or back within their own country. Winter with its ice-hardened roads and fields offers a preferable environment for tanks and heavy equipment than the spring thaw when the terrain is muddy.

Usually, the bad outcomes you fear in investing don’t happen, but it’s as well to be prepared. It scarcely seems in Russia’s interests to draw the apparently ruinous sanctions the US has planned. So the most likely outcome must surely be a diplomatic exit.

But it’s worth considering that Russian tanks rolling into Kyiv isn’t the limit of how bad things could get. Other points of conflict will then be at increased risk of heating up.

This is where energy investments offer a form of geopolitical tail risk insurance. Most of the time, such coverage provides little or no payoff, but occasionally can look prescient. If you consider a list of all the products and services offered by the companies in the S&P500, domestic energy and the physical infrastructure required to process, transport and store it looks more vital and in our national interest relative to much else that generates EPS.

Hopefully, this crisis will pass, but it is a reminder that planning for the unexpected is an essential element of risk management.

We have three funds that seek to profit from this environment:

Energy Mutual Fund

Energy ETF

Real Assets Fund

Please see important Legal Disclosures.


The Bubble Was In ARKK’s Arc, Not Value Stocks

It’s easy to sympathize with Cathie Wood’s plaintive cry that value stocks look like a bubble. As long-time energy investors, we’ve watched awestruck as the ARK Innovation ETF (ARKK) traced out its stratospheric path for both performance and AUM. “Bubble” was a wholly inadequate sobriquet (see ARKK’s Investors Have In Aggregate Lost Money).

Having reached its apogee, there is now no pleasure in watching ARKK’s Icarus-like plunge. Pipeline investors were there a little over two years ago, when a sector that looked ridiculously cheap lost over half its value as Covid ravaged the energy sector.

.avia-image-container.av-qa6gz8-7adb29d2a404a73249eaf1e336012c18 img.avia_image{ box-shadow:none; } .avia-image-container.av-qa6gz8-7adb29d2a404a73249eaf1e336012c18 .av-image-caption-overlay-center{ color:#ffffff; }

We have no view on ARKK’s holdings, and little more to say on value stocks outside of energy, where we have much to add. Although momentum is extending the recent moves of ARKK and the pipeline sector, valuations of the latter provide ample justification for this to continue.

An overly exuberant Shale Revolution, the looming uncertainty of the energy transition and Covid’s demand destruction were the adverse trifecta that floored sentiment around traditional energy. April of 2020, when crude oil went briefly negative, represented a nadir of sentiment and valuation so severe it likely surpassed anything that came before.

The recency of such trauma continues to impose caution on prospective investors, allowing valuations to remain attractive. Flows into the sector are once again positive. Bubbles do not follow with such relative haste as Cathie Wood implies.

Industry capex appears parsimonious against the standards of five years ago, provoking incongruous pleas from the White House to produce more of something they claim to want phased out. CEOs such as Pioneer’s Scott Sheffield maintain that investors don’t want production that isn’t accretive on a per share basis. It took the last few years to convince them, but capital discipline remains the industry’s new religion.

.avia-image-container.av-1919vtg-e9d47a19d7bd45b5d3538046382246e3 img.avia_image{ box-shadow:none; } .avia-image-container.av-1919vtg-e9d47a19d7bd45b5d3538046382246e3 .av-image-caption-overlay-center{ color:#ffffff; }

An example is the growing spread between Distributable Cash Flow (DCF) and Capex. DCF is cash from operations minus maintenance capex (the cost of maintaining existing assets). Capex on new projects is down by almost two thirds for pipeline companies, similar to the reduced spending by E&P companies who are their customers. Many investors may be skeptical that such frugality will persist, but as Scott Sheffield’s comments show, financial performance is now more important than production growth.

.avia-image-container.av-w8mt2s-1766278ca37b21625d5497c069ec5ab5 img.avia_image{ box-shadow:none; } .avia-image-container.av-w8mt2s-1766278ca37b21625d5497c069ec5ab5 .av-image-caption-overlay-center{ color:#ffffff; }

Free Cash Flow (FCF) is being boosted by the DCF-Capex spread. Sources and uses of funds is an important variable. In projecting FCF we’ve assumed that half of growth spending is debt-financed, which would still allow leverage to continue decreasing while increasing payout coverage. We’ve made no assumptions about dividend hikes or buybacks, which are hard to forecast more than a year out.  Both may trim FCF growth, but since these represent a direct return of additional cash to investors there would be little to complain about.

Increased capital discipline is occurring simultaneously with energy policies intended to inhibit supply growth. Political leaders routinely draw on professed public concern about climate change to provide legitimacy for related policies. However, there seems to be little political appetite to limit demand for reliable energy. The focus remains on the supply side, as if the energy transition can be painless to consumers with the disruption only on big corporations.

The result is that continued demand growth and constrained supply are boosting prices for natural gas, crude oil and even coal. Progressive policy prescriptions have failed to meaningfully impact emissions – but they have served to highlight the challenges of intermittency with renewables, inadvertently improving the outlook for traditional energy companies.

Emerging countries favor raising living standards over fighting global warming, and the most impactful step the world could take would be promoting natural gas over coal for power generation.

Moreover, midstream energy infrastructure companies will mostly own and manage the infrastructure needed for carbon capture, where increased Q45 tax credits enjoy bipartisan support. If hydrogen use becomes commercially viable, the same companies will manage that. In short, rather than threatening the pipeline sector, the energy transition is turning out to be impossible to execute without it.

Any economic threat posed by Covid has long since passed – the collapse in stocks like Peloton and Netflix shows that lockdown spending is dissipating as normalcy returns.

The result is that all three headwinds that hurt investment performance in midstream energy infrastructure have been converted to tailwinds. Meanwhile, valuations remain compelling. If some sellers of ARKK are fleeing to pipelines, they are drawn by the positive fundamentals listed above. They’re abandoning what was clearly a bubble in favor of solid fundamentals.

We have three funds that seek to profit from this environment:

Energy Mutual Fund

Energy ETF

Real Assets Fund

Please see important Legal Disclosures.


Why You Shouldn’t Expect A Return To 2% Inflation

Jamie Dimon thinks the Fed may tighten rates six or seven times this year. Bill Ackman believes the Fed should punctuate the start of the tightening cycle with a 50bp hike in order to regain some credibility. Whatever their self-image, this is a dovish FOMC. Central bank bond buying is set to continue until March, and raising short term rates can only start then. So monetary stimulus continues, in the interests of avoiding any surprises. An unemployment rate of 3.9% combined with hourly earnings increasing at a 7.5% annualized rate (December was up 19 cents to $31.31) reflects full employment. They’re already late.

Cyclical peaks in short term rates have declined over the past couple of decades. It seems the economy succumbs to monetary tightening more readily each time. This is why the market doesn’t expect rates to move much above 2%, and is probably why the Fed is so lethargic in normalizing policy. They don’t expect to tighten much.

.avia-image-container.av-rkdpi0-3e41082d3d518a1fe0b86b4ca64074e8 img.avia_image{ box-shadow:none; } .avia-image-container.av-rkdpi0-3e41082d3d518a1fe0b86b4ca64074e8 .av-image-caption-overlay-center{ color:#ffffff; }

Over the next year, the risks seem skewed to the upside for rates. Fed chair Jay Powell continues to blame goods shortages for inflation, even though labor is most clearly under-supplied. FOMC forecasts of inflation have been steadily increasing. A 2% rate cycle peak with the economy booming and the Fed still stimulating seems optimistic. Eurodollar futures have been pricing in less optimism recently, but surely need to at least match FOMC projections in order to stop offering an asymmetric bet.

.avia-image-container.av-82bcyg-97ac003ae664b9cf8efc03b249ff8d1d img.avia_image{ box-shadow:none; } .avia-image-container.av-82bcyg-97ac003ae664b9cf8efc03b249ff8d1d .av-image-caption-overlay-center{ color:#ffffff; }

Looking farther out, ten year inflation expectations at 2.5% invite one to wager on higher. Although Jamie Dimon’s warning of more aggressive tightening looks prescient, we only reached this point because of the FOMC’s dovish posture. Reducing inflation from 7% draws little debate; bringing it down from 4% to 3%, and eventually to their long run 2% target, is likely to provoke concern about unnecessarily costing jobs. The Fed has taken excessive inflation risk to achieve today’s full employment – they clearly interpret their dual mandate as weighted towards people over bonds.

.avia-image-container.av-1pr4z88-62e8abf1afa43ca22e7680e582f93308 img.avia_image{ box-shadow:none; } .avia-image-container.av-1pr4z88-62e8abf1afa43ca22e7680e582f93308 .av-image-caption-overlay-center{ color:#ffffff; }

This is not necessarily bad. Monetary orthodoxy has long held that 2% inflation maximizes employment, but that could change. America’s indebtedness is relentlessly up. Expect more thoughtful pieces arguing that a little higher inflation eases the burden of debt service by providing more room for negative real rates. It is the endless gift from investors who must own bonds to those who service them — US taxpayers. We should take advantage of it.

.avia-image-container.av-15jpkbc-0154afd633b37886aa430937f5dd76a6 img.avia_image{ box-shadow:none; } .avia-image-container.av-15jpkbc-0154afd633b37886aa430937f5dd76a6 .av-image-caption-overlay-center{ color:#ffffff; }

There are in any case ways for the Fed to overlook certain elements of inflation. Owners’ Equivalent Rent (OER) is one. This flawed survey of what homeowners believe their home would rent for continues to show the cost of shelter to be only inconsequentially rising, in complete defiance of the buoyant real estate market the rest of us see. Since the July 2006 peak in housing OER and the Case Shiller index, which actually measures home prices, have recorded similar increases albeit along very different paths.

.avia-image-container.av-nvsh2w-f5882af46767025368f6e0e6d9700d1d img.avia_image{ box-shadow:none; } .avia-image-container.av-nvsh2w-f5882af46767025368f6e0e6d9700d1d .av-image-caption-overlay-center{ color:#ffffff; }

OER is lagging housing prices by over 15% year-on-year but has belatedly begun to reflect the housing market since its annual rate of increase has risen from 2% in April to 3.8% now. This suggests OER is set to inconveniently accelerate just when the FOMC strategy of hope is supposed to be working. But since OER is the only non-cash item in the inflation statistics, it wouldn’t take much for the Fed to dismiss its message since nobody writes a monthly rent check linked to OER.

The energy transition is another example. Shifting to a lower carbon energy system is going to raise prices – obviously, or we’d already be there. The inflation that counts usually excludes food and energy, because they’re volatile. But Europe’s energy crisis shows what excessive reliance on windmills and policy aligned with Greta soundbites can deliver.

ECB member Isabel Schnabel recently warned that Europe’s transition to cleaner energy presented upside risks to their inflation target. US states have generally avoided the worst of Europe’s policy errors but won’t be immune to rising global demand for coal, natural gas and oil. Investments in new production remain well behind what most analysts believe is necessary to meet emerging economies’ increasing living standards, and energy sector growth capex will remain constrained by caution around public policy.

If inflation is elevated due to the energy transition, tighter monetary policy need not follow. Although the energy value of a British Thermal Unit (BTU) is fixed, officials could conclude that greener BTUs are more desirable. It’s similar to the numerous quality adjustments statisticians at the Bureau of Labor Statistics make, which lower stated inflation. Successive iPhones are more expensive, but their added features represent improved quality. Since inflation measures the cost of a basket of goods and services of constant utility, this approach records falling prices for most consumer electronics even if the consumer winds up paying more. The same approach could be used for energy, in that the BLS could assess a quality improvement to energy delivered with reduced emissions, muting its actual increased cost.

The bottom line is that investors over the next year or so should consider the risks of a more hawkish Fed. But over a longer timeframe, the impact of sustained 3-4% inflation on portfolios warrants more attention. It’s likely to be the path of least resistance.

We have three funds that seek to profit from this environment:

Energy Mutual Fund

Energy ETF

Real Assets Fund

Please see important Legal Disclosures.