Valuing MLPs Privately — Enterprise Products Partners
MLP valuations show that the trust of the traditional MLP investor has been lost, perhaps irretrievably. In Kinder Morgan; Still Paying for Broken Promises, we showed how that company’s history of investor abuse via two distribution cuts and an adverse tax outcome continues to weigh on its stock price. In Magellan Midstream: Keeping Promises But Still Dragged Down by Peers, we showed how even well-run companies that have honored promised distributions remain hampered by the abuse of others in the sector. The Alerian MLP ETF (AMLP) lowered its quarterly dividend again last week, by 7.5%. It’s now 34% below its 2014 high. The persistent cheapness of pipeline stocks reflects understandable wariness by MLP investors, who bought for the tax deferred income and had it partially removed.
Valuing such stocks on yield alone inadequately captures the past history of distribution cuts. Another common metric, EV/EBITDA (Enterprise Value/Earnings Before Interest, Taxes, Depreciation and Amortization), is a blunt tool making little distinction between appreciating versus depreciating assets, or long term versus short term contracts.
Private equity buyers tend to look at cashflows. Using Enterprise Product Partners (EPD) as an example, Discounted Cash Flow (DCF) analysis reveals underappreciated value. DCF is often used to refer to an MLP’s Distributable Cash Flow, cash available for paying distributions to investors. To avoid confusion, in this article we will only use DCF as initially defined, the present value of future cashflows
EPD is the largest MLP. It is one third owned by the Duncan family and its well respected management team is ably led by Jim Teague. Their pipelines, storage assets and processing facilities handle crude oil, natural gas, natural gas liquids (NGLs) and refined products. They have a huge presence in along the gulf coast and include vertically integrated businesses that, for example, capture, moves, fractionate and export ethane.
EPD’s P/E ratio is unremarkable. Based on a consensus estimate of $1.67 for 2019, they trade at 16X, approximately the same multiple as the S&P500.
EPD’s EV/EBITDA is 11X. By comparison, KMI is 9.4X (penalized for past transgressions) while Oneok Inc (OKE) is at 14.7X, still feeling the love after last year’s successful conversion from an MLP to a corporation. Magellan Midstream (MMP), subject of last week’s blog, is 12.6X. On this measure, EPD could be described as moderately cheap versus its peer group.
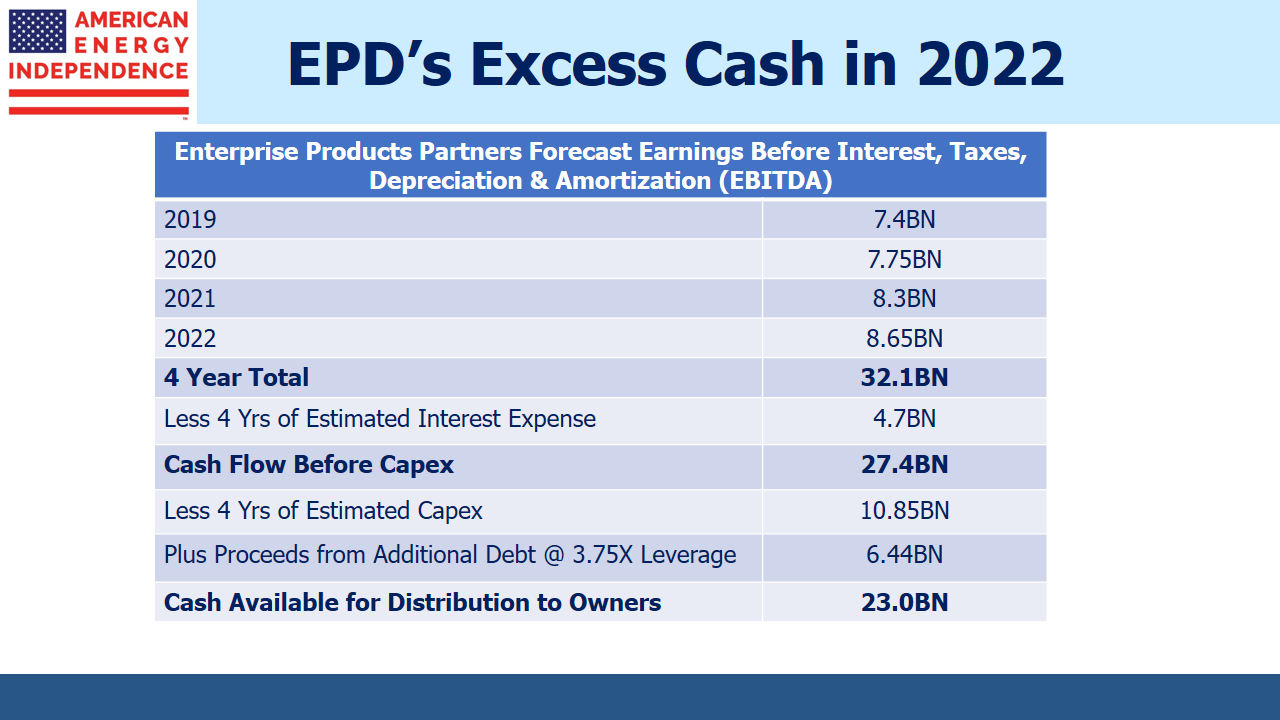
While those traditional measures of valuation are unexciting, DCF analysis reveals a truly undervalued asset. Below is simplified look at cash flow analysis based on consensus EBITDA estimates:
2018: $7.0BN
2019: $7.4BN
2020: $7.75BN
2021: $8.3BN
2022: $8.65BN
===========
2019-22 Total $32.1BN
Financing EPD’s $26BN in debt costs $1.17BN (4.5% borrowing rate) annually. This year they’ll generate around $5.83BN in cash before taxes (which they don’t pay as an MLP). Depreciation and Amortization are non-cash expenses that typically don’t reflect the growing value of their assets, which is why earnings multiples such as P/E aren’t that useful.
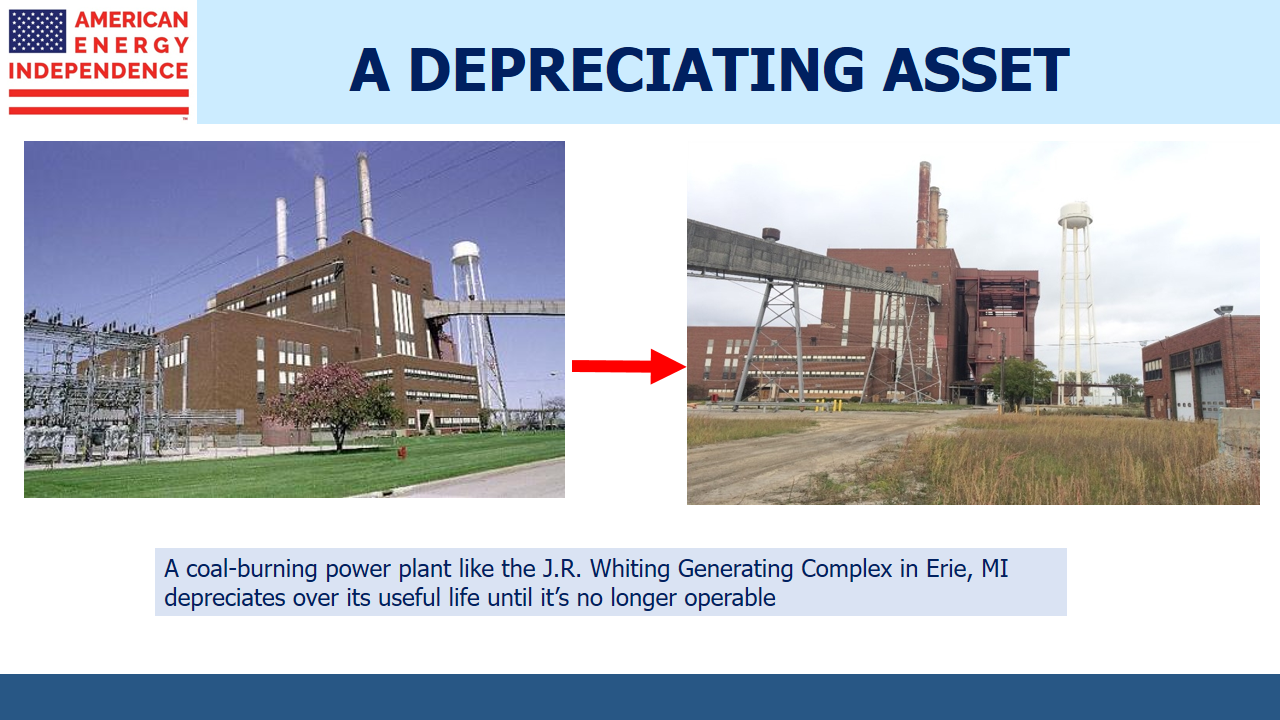
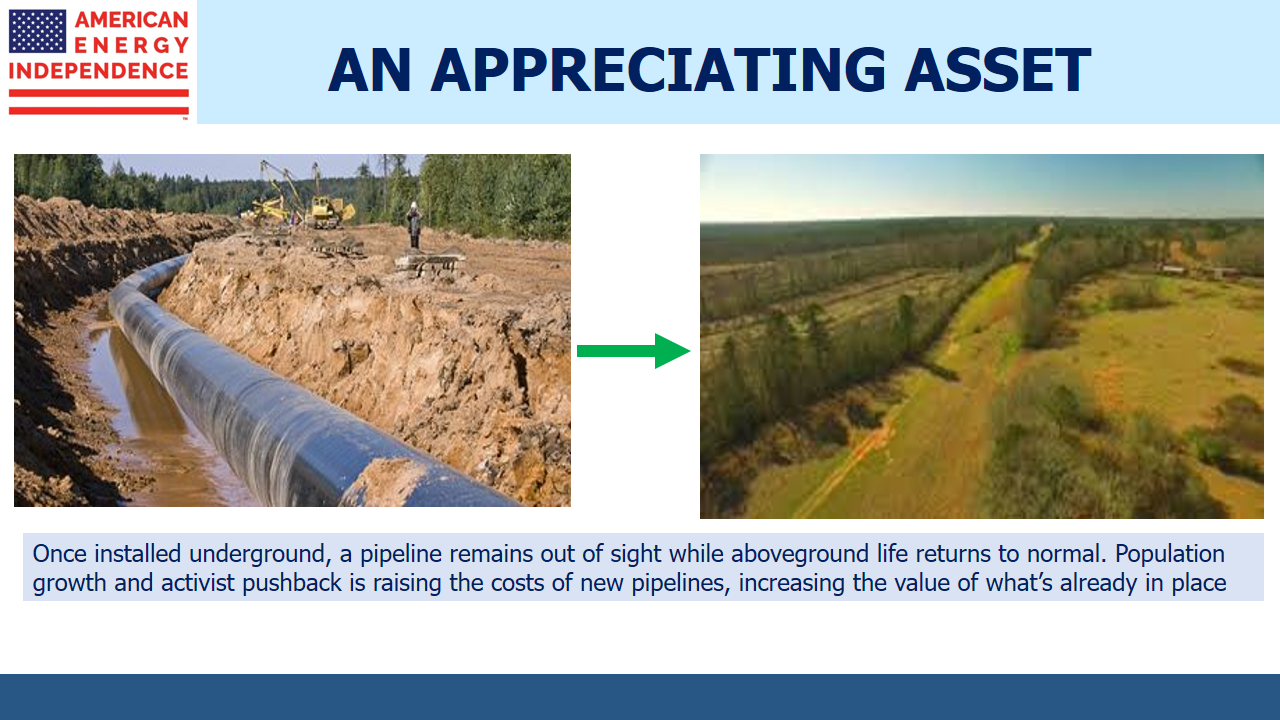
For example, EPD owns underground salt caverns in Mont Belvieu, used for storing NGLs. This is wholly different than, say, a coal-burning power plant, which is why EV/EBITDA comparisons with utility stocks make little sense. Pipelines, when properly maintained, generally appreciate in value. As communities grow up around and over them, and other pipelines link into them, it becomes prohibitively expensive to build competing infrastructure.
With a Debt:EBITDA ratio of <4.0X, EPD is comfortably investment grade with a strong balance sheet. This allows them to rely on debt to finance their backlog of new projects. The Shale Revolution continues to create demand for new infrastructure in support of America’s growing production. Companies like EPD are financing and building it.
EPD’s backlog of new projects over the next four years is estimated at $9.5BN and they’re expected to spend $1.35BN in maintenance capex, which is money spent on their existing assets to maintain their capability.
Because their EBITDA is growing, by 2022 they’ll be able to carry debt of $32.44BN (2022 EBITDA of $8.65BN multiplied by their 3.75X desired Debt/EBITDA multiple – the low end of their guidance range of 3.75 to 4.0x Debt/EBITDA). That’s $6.44BN more than their current debt, which means they could, if they chose, borrow to finance ~60% of their $9.5BN in new projects and $1.35BN in maintenance capex, allowing more cash to be returned to equity holders. Only $4.4BN needs to be sourced from cash generated, so there is no need to issue dilutive equity.
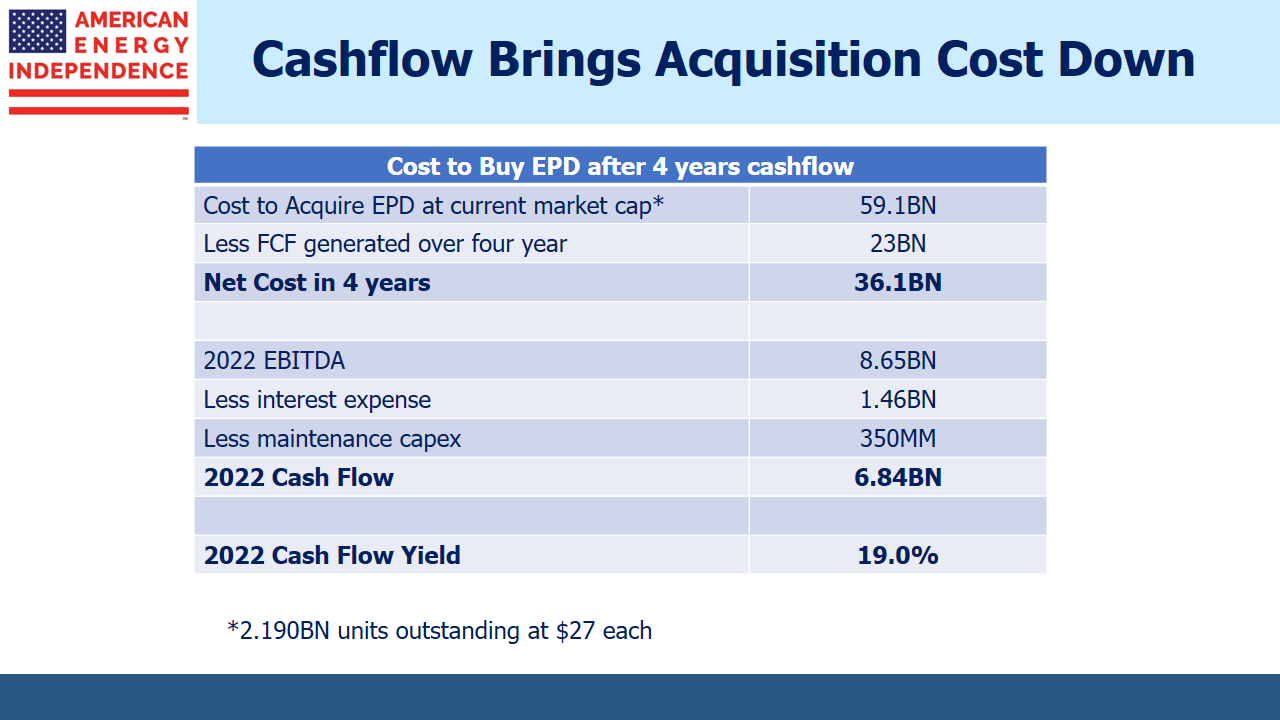
Since new projects can be self-financed, it simplifies the valuation of the business. Suppose you had $59BN in cash with which to acquire the company at its current market capitalization (although as you’ll see, it’s doubtful the Duncan family would sell).
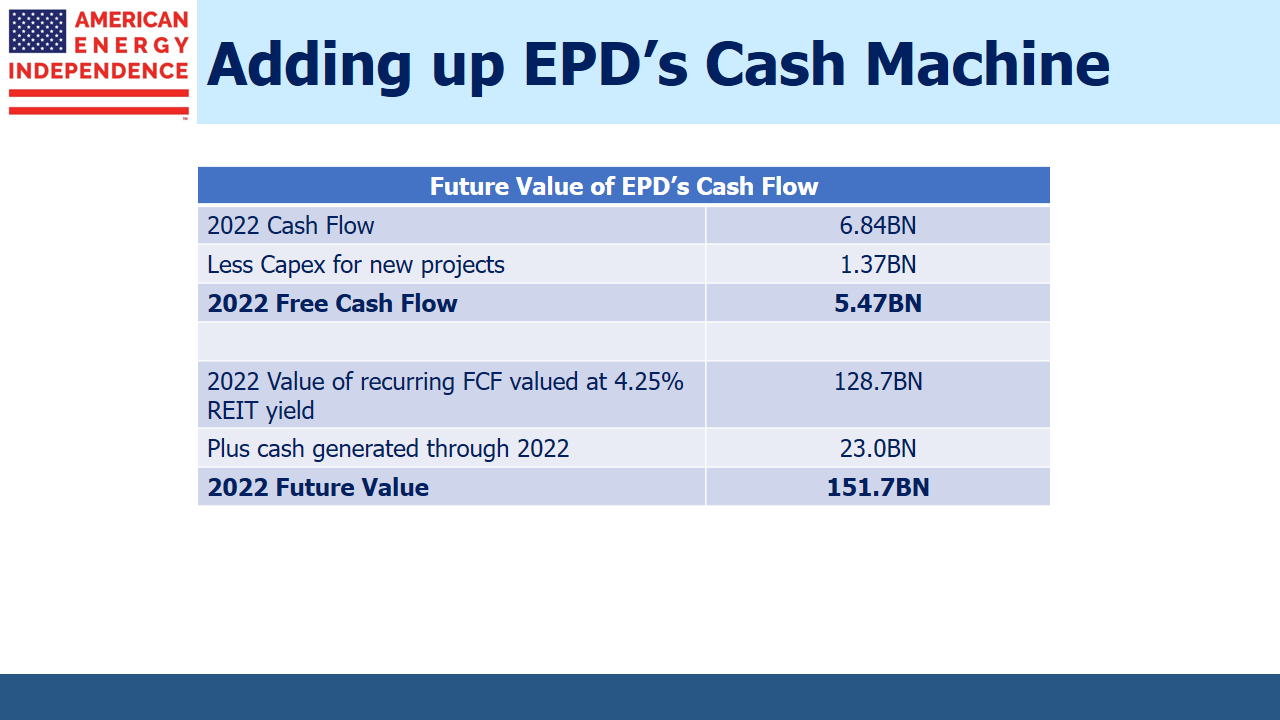
Over four years, the business will generate $32.1BN in EBITDA, less its interest expense of $4.7BN (4 times $1.17BN) and new investments funded from cash flows of $4.4BN, leaving $23BN. Returning this excess cash reduces the purchase price to $36BN by 2022. Deduct annual interest expense of $1.46BN (since there’s now more debt because of the growth projects) and maintenance capex of $350M, and the business is generating $6.84BN in cash, annually. On the $36BN purchase price, that’s a 19% cash flow yield.
Even half that cash flow yield would be attractive, which would value EPD 20% above its current market cap after paying out ~40% of its market cap in cash.
Future growth projects add further to the potential value. New energy infrastructure projects generally have required returns from as low as 10-12% to 20%+, depending on the degree of risk. Suppose EPD is able to reinvest 20% of its $6.84BN in annual cash, or $1.37BN, into new projects that have an expected unlevered return of approximately 14.3%. This equates to an EBITDA multiple of 7X (i.e. $100 invested to earn $14.30 is a multiple of 100/14.3, or 7) which is in the middle of the expected range for EPD’s current projects of 6-8X. Sticking to their 3.75X leverage multiple, they could finance 54% of the project with debt (i.e. 3.75X desired debt multiple divided by 7X project multiple). The rest would come from equity, which would be sourced from current cashflow.
The result would be an investment of $1.37BN in equity ($6.84BN times 20%) along with $1.58BN in debt, for a total of $2.95BN. The 14.3% expected return on the $2.95BN project would generate $421MM annually, contributing to future EBITDA growth. After interest expense of $71MM (same interest rate of 4.5% assumed throughout) and maintenance capex of $21MM (estimated to be 5.0% of EBITDA), there would be $329MM of incremental cash flow for distribution.
By 2022 the business would have $5.47BN in annual distributable cash flows ($6.84BN in cash after interest & maintenance capex less the $1.37BN for new projects). Distributions to the owner would be growing at 4.8% annually. This comes from taking the $329MM generated by new projects, multiplied by an 80% payout ratio, since we’re assuming 20% of cashflow gets reinvested back in the business ($329 times 80% divided by $5.47BN = 4.8% growth rate).
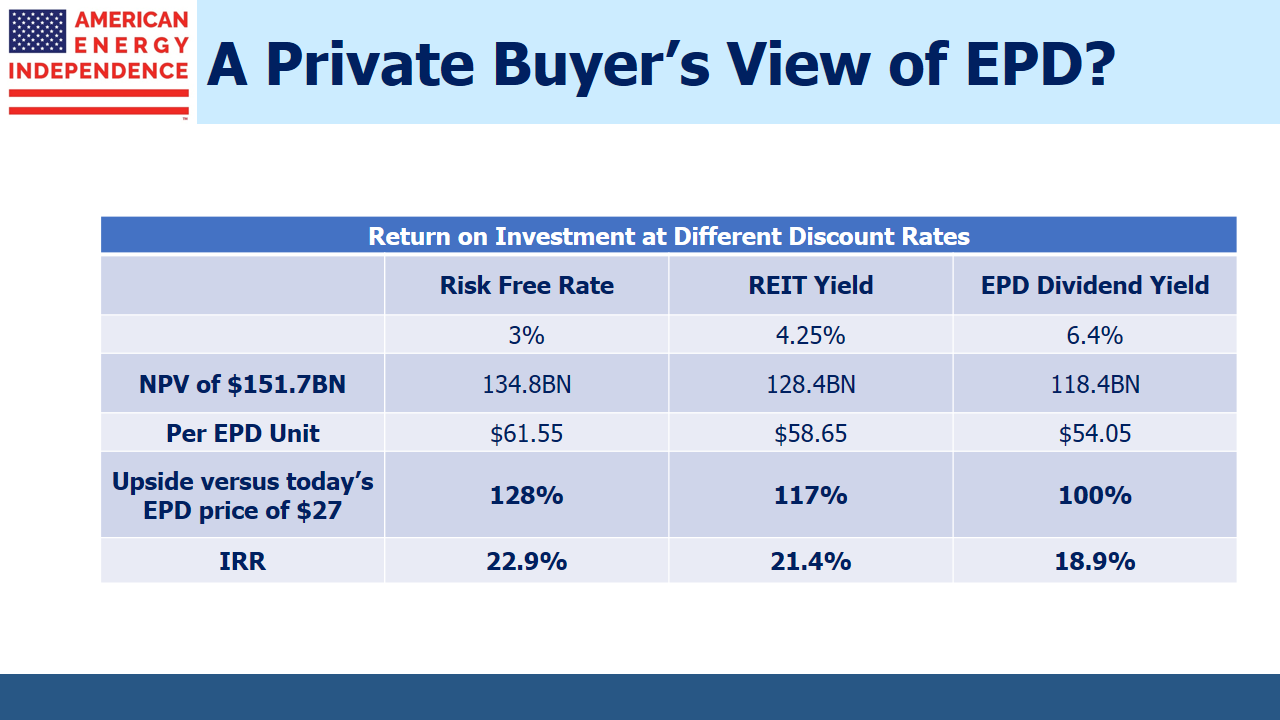
By comparison, Utilities have a dividend yield 3.5% and REITs 4.25%, both with similar growth rates. If EPD was simply valued at the same yield as REITs, the $5.47BN in 2022 cash flow would be worth $128.7BN. Add back the $23B in cash received to that point gets to $151.7BN. Discounted back to today at the risk free rate of 3%, gives a market value of $134.8BN. Divide by EPD’s current share count of 2.19BN units gives a price of above $60/unit, more than double today’s unit price.
Cash flow analysis presents a very different picture of MLP valuation than looking at conventional multiples such as P/E or EV/EBITDA.
The problem for public market investors is that EPD units come with a K-1. This generally rules out tax-exempt and foreign institutions, as well as non-U.S. individuals. The remaining investor base is narrow, consisting of older, wealthy Americans who want stable income. This group is still smarting from the 34% drop in MLP payouts, as reflected in AMLP. The MLP model may not be broken, but the trust of many of the traditional MLP investors is, which in effect means the same thing.
Cash flow analysis is how private equity buyers tend to value companies, although EPD is probably too big for such a take-private transaction. This illustrates why private equity firms often outbid the large midstream public companies for assets, despite the latter’s enormous competitive advantages of linking to existing integrated systems, and the associated synergies of maximizing utilization across their assets.
We are invested in EPD, KMI, MMP and OKE. We are short AMLP
