Chesapeake and Southwestern Are Betting On Higher US NatGas

Chesapeake (CHK) and Southwestern (SWN) are the latest energy companies to be contemplating a merger. Chesapeake was founded by Aubrey McLendon, whose belief in higher natural gas prices combined with his ample risk appetite led the company into financial difficulties during a period of low prices. In 2016 he was indicted by a federal grand jury on charges of conspiring “to rig bids on oil and natural gas leases”. The following day McLendon died alone in a fiery car crash. Chesapeake ultimately filed for bankruptcy in 2020 and emerged with reduced debt the following year.

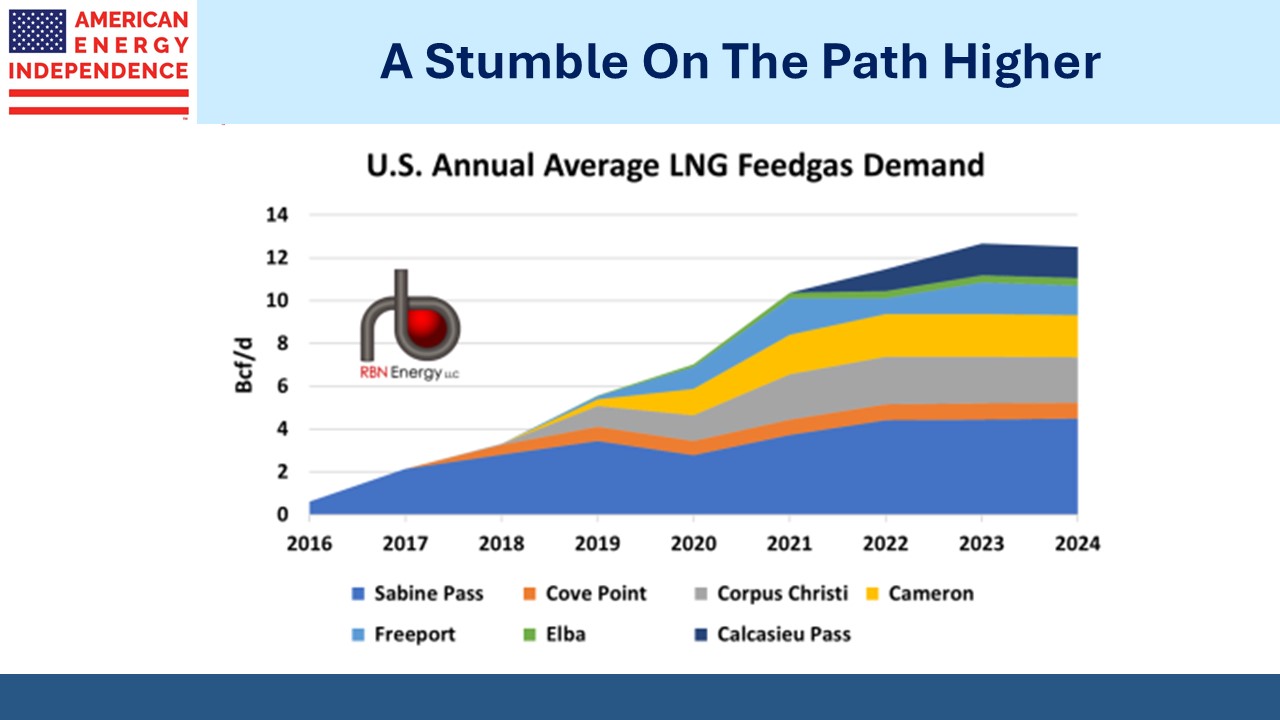
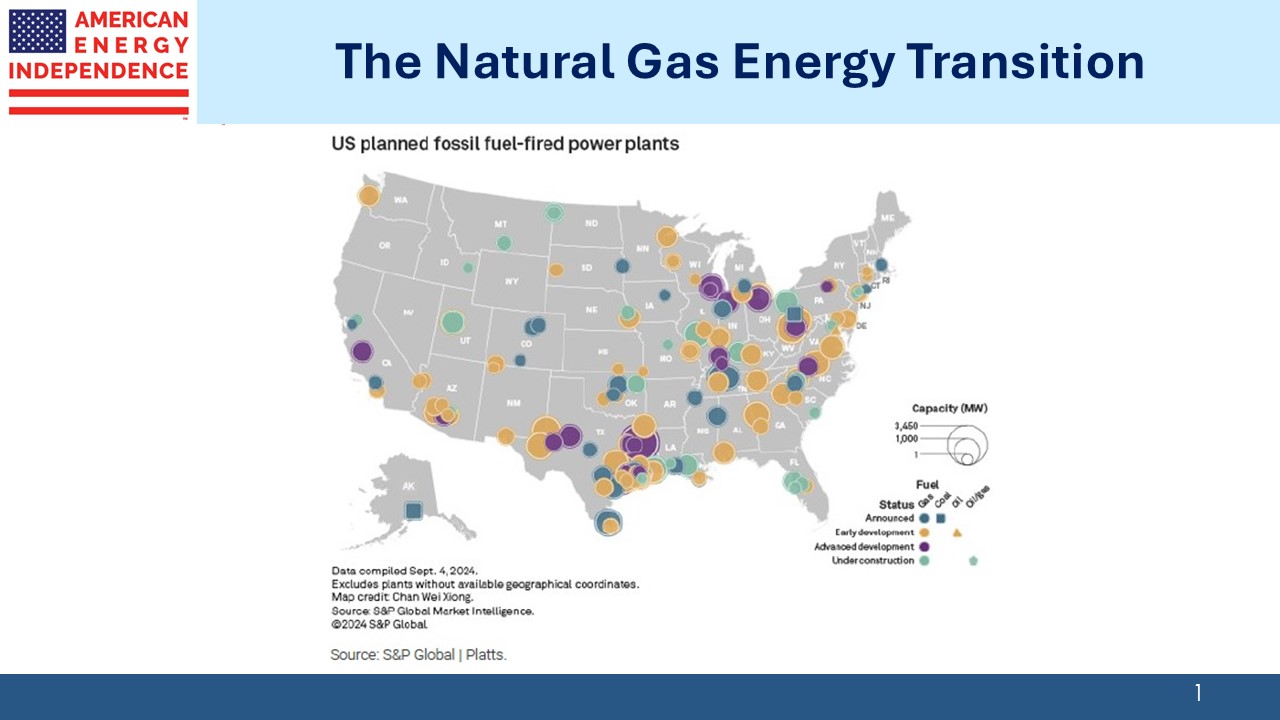
The US natural gas story is about growing LNG exports. By combining, CHK and SWN would be America’s biggest natgas producer.

.avia-image-container.av-2q0f8n-10419ec359f3c83d7b0e16e1a3571ee8 img.avia_image{ box-shadow:none; } .avia-image-container.av-2q0f8n-10419ec359f3c83d7b0e16e1a3571ee8 .av-image-caption-overlay-center{ color:#ffffff; }

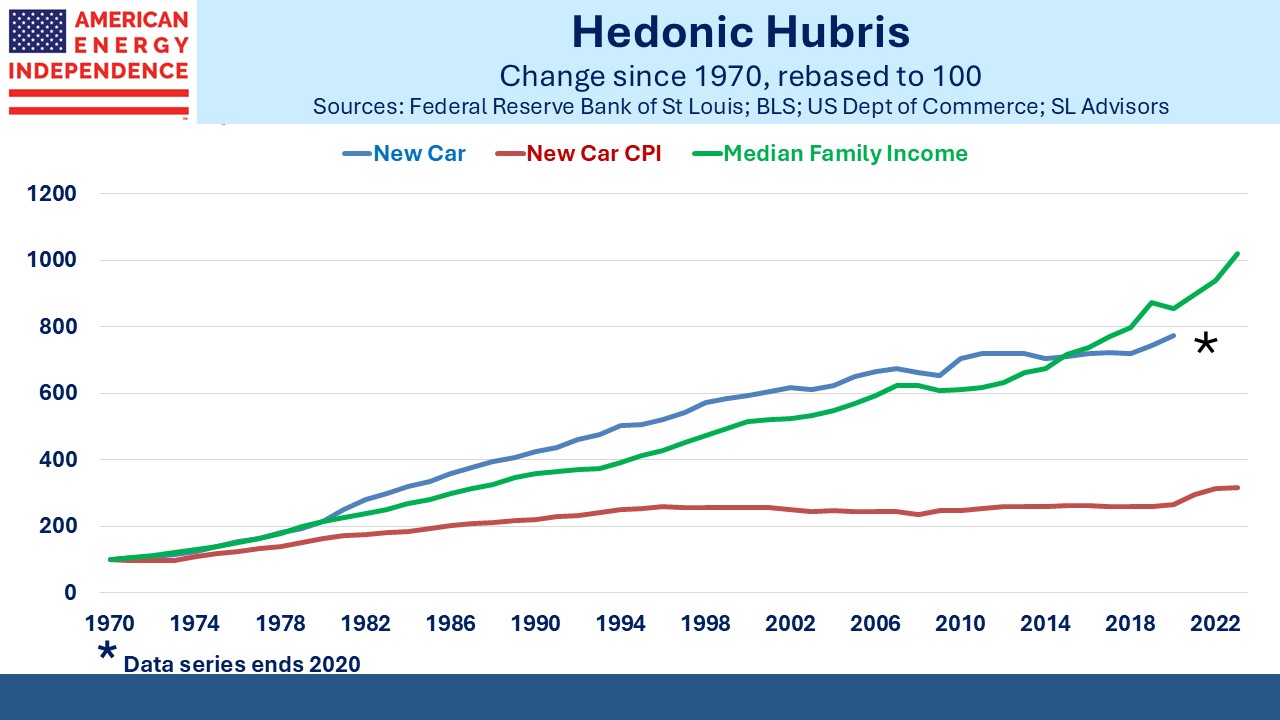
The opportunity can be seen in the futures curves for three regional benchmarks. Because natural gas is difficult and expensive to transport across the ocean, huge price discrepancies can persist for years until liquefaction and regassification infrastructure can be built in the appropriate places to allow for increased trade.

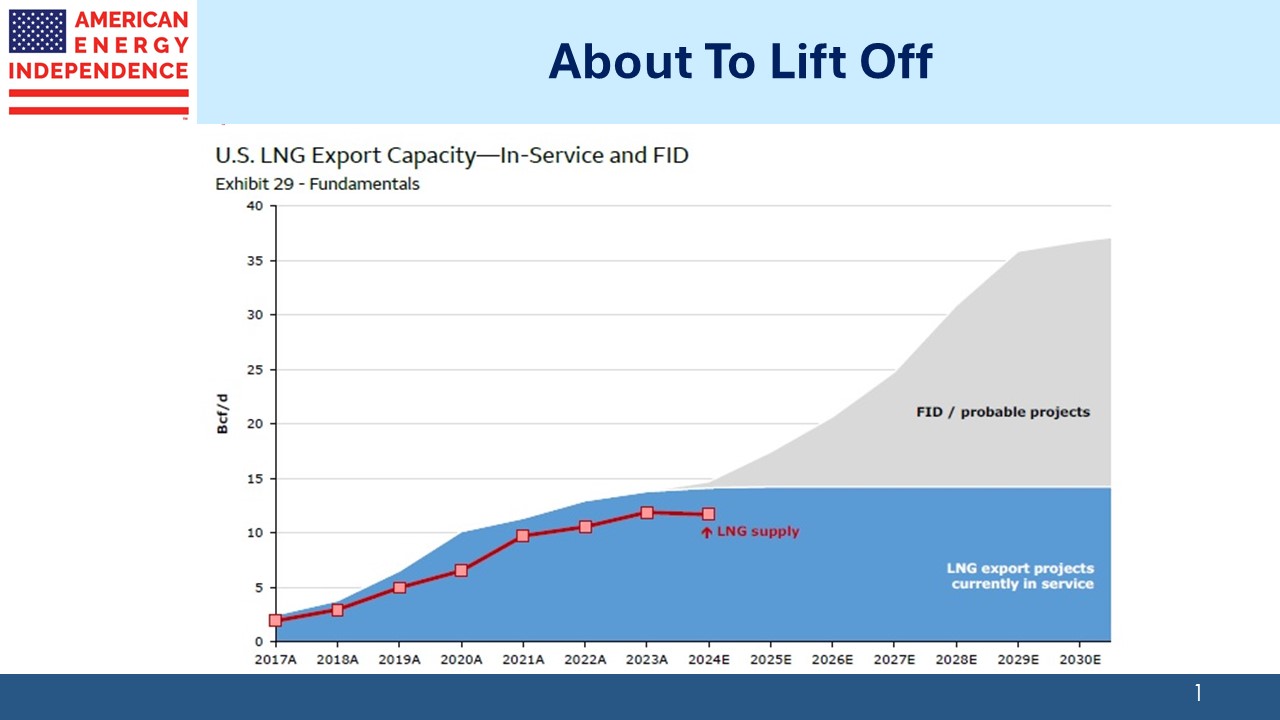
US natgas is very cheap, at under $3 per Million BTUs (MMBTUs). 13 Billion Cubic Feet per Day (BCF/D) is our export capacity, because that’s how much can be chilled and loaded onto specialized LNG tankers. But the discrepancy is so wide that it’s driving the construction of additional capacity.

.avia-image-container.av-1084civ-1065022a17ca19d2c437090a0ccb10ba img.avia_image{ box-shadow:none; } .avia-image-container.av-1084civ-1065022a17ca19d2c437090a0ccb10ba .av-image-caption-overlay-center{ color:#ffffff; }

The US Energy Information Administration (EIA) expects North American LNG export capacity to double by 2027. Given the several years construction takes, this is more than simply an economic forecast. Many projects have already reached Final Investment Decision (FID), meaning financing is lined up and they will be built. By adding in probable projects to those that have already reached FID, Wells Fargo sees 17 BCF/D of new US capacity by 2027 and 24 BCF/D by 2030, for 38 BCF/D of total US export capacity.

Perhaps the most tangible and certainly the most spectacular ESG disaster is Germany’s now shredded belief that they could rely on Russian gas while they transitioned to windpower. The WSJ quoted Bill Ackman thus: “Well-intentioned movements like ESG can have catastrophic consequences for the world. Europe’s loss of energy independence was a contributing factor in Putin having the confidence to invade Ukraine.”

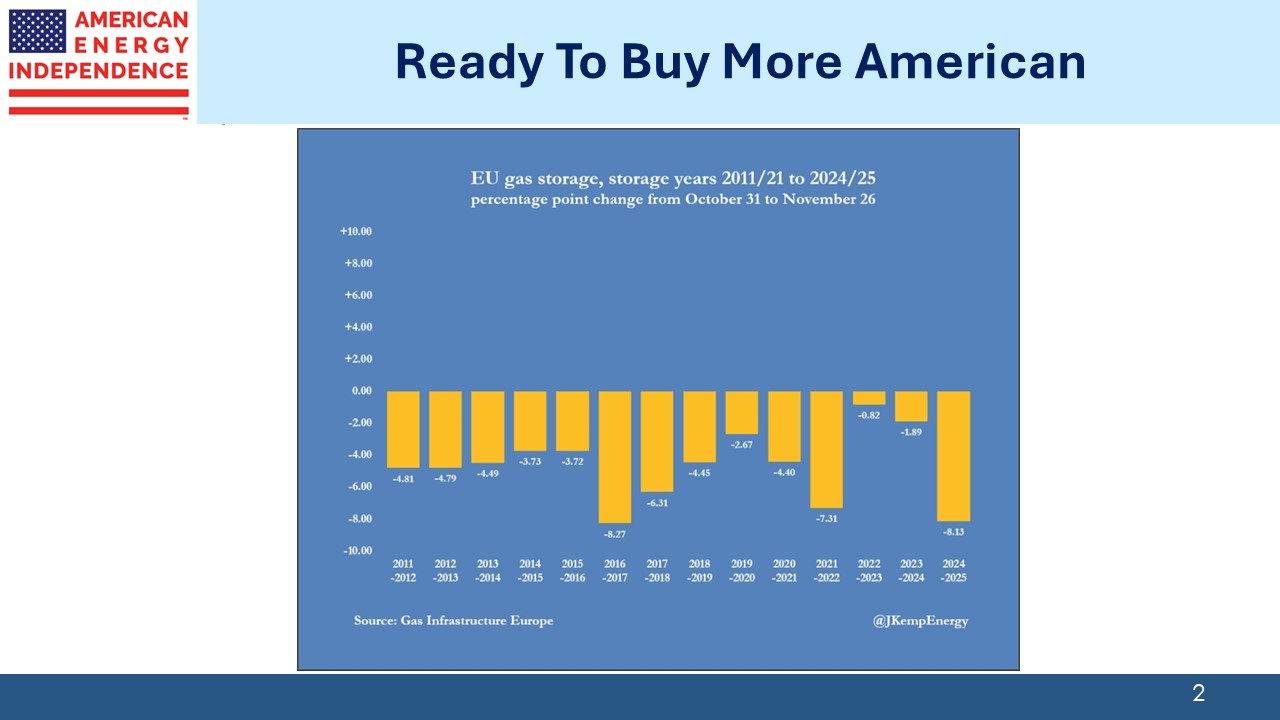
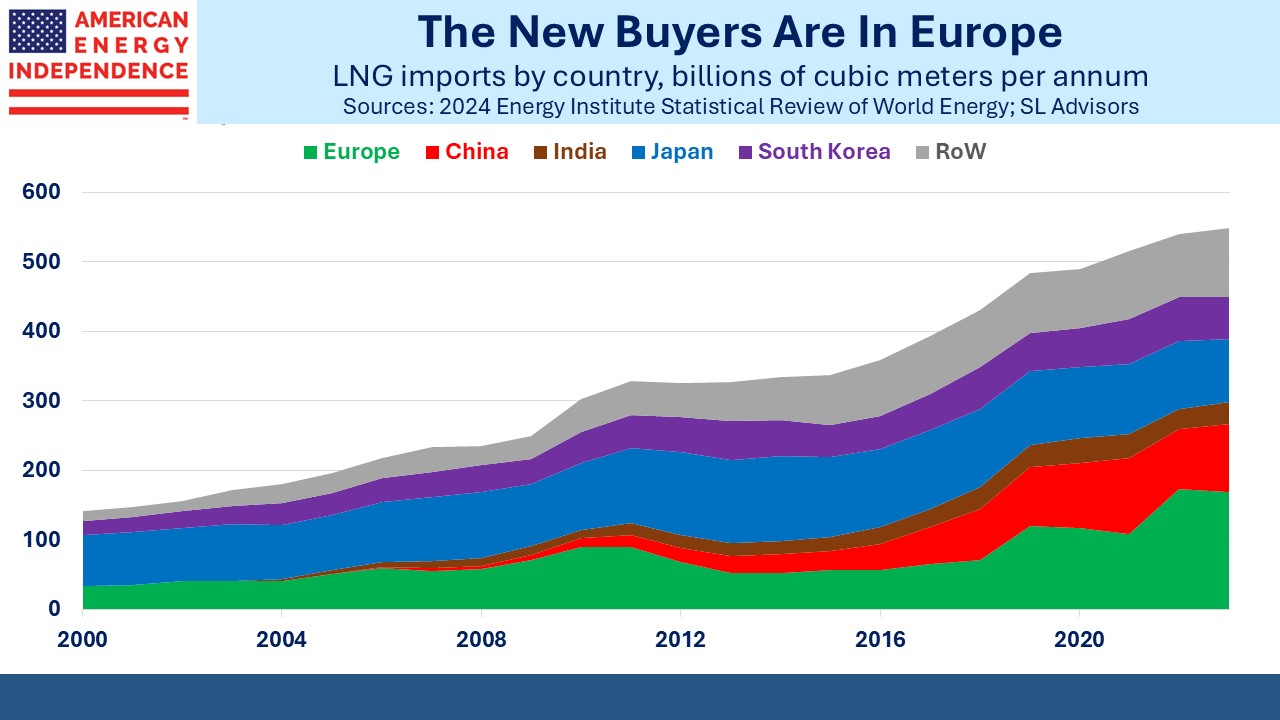
The bet that a CHK/SWN tie-up is making is that the price differential between US natgas and other regional benchmarks will narrow. Asia has represented around 70% of global LNG trade in recent years. But Europe is becoming a bigger player, thanks to a misguided reliance on Russian gas and overly optimistic assumptions on renewables. European and Asian prices are $10-15 per MMBTUs higher than US, It costs around $2 per MMBTU to ship LNG from the US to Asia. Add in a $3 fee charged for liquefaction, and that still leaves a substantial price difference to support increased global trade.

The long term price curves for natgas futures suggest that increasing US LNG exports won’t be that impactful. This seems wrong. If US exports reach 25% or more of domestic production by 2030, as seems likely, domestic prices will rise. The market is not pricing in any narrowing of the differentials between the Asian/European benchmarks which are where the buyers are, and the US which is bringing more availability online.

Some may doubt Europe’s long term appetite for natural gas. It is the region most committed to reducing CO2 emissions, although much of their recent success on this has come from ruinously high energy prices forcing industrial output lower. German companies are relocating manufacturing out of Europe, including to the US.

But European energy companies aren’t behaving as if global LNG gas demand will disappear. Shell recently signed a twenty year contract to buy Canadian-sourced LNG from a new export facility in British Columbia. The Ksi Lisims project isn’t expected to be operational until 2030. And while Asia is geographically the obvious destination for these exports, if the European premium sustains it won’t be hard for Shell to redirect their purchased LNG to other buyers.

.avia-image-container.av-31k8dj-9f709169f057a24fef710f3081bd86ff img.avia_image{ box-shadow:none; } .avia-image-container.av-31k8dj-9f709169f057a24fef710f3081bd86ff .av-image-caption-overlay-center{ color:#ffffff; }

CHK and SWN are motivated by the likely upward pressure on US natgas prices growing LNG exports will cause. They’re probably also aware that as relatively high-cost producers, they are vulnerable to some more efficiently run competitors.

The bet on higher natgas prices looks like a sound one. If completed, the CHK/SWN merger will represent a pureplay bet on growing US LNG exports, something that’s also good for the midstream energy infrastructure companies that make it possible.

Join  us for a webinar today, Wednesday January 10 at 4pm eastern. Click here to register.

We have three have funds that seek to profit from this environment:
Energy Mutual Fund

Energy ETF

Real Assets Fund


US Sets Multiple Energy Records

President Biden probably won’t brag about US energy production, but when the final figures for 2023 are in the US will have set numerous records.

Crude oil production reached a record 13.2 Million Barrels per Day (MMB/D) in October, surpassing the prior record set four years earlier before the pandemic. Few analysts were projecting this at the beginning of last year. Upstream capital discipline was expected to moderate output growth. But drillers squeezed efficiencies out of their operations, producing more with fewer rigs and drilling longer laterals.

.avia-image-container.av-3mh3jw4-7f1f7594922fa2665414763d6f460a38 img.avia_image{ box-shadow:none; } .avia-image-container.av-3mh3jw4-7f1f7594922fa2665414763d6f460a38 .av-image-caption-overlay-center{ color:#ffffff; }

Biden complained bitterly two years ago that US oil production wasn’t increasing in response to higher prices. As he was reminded back then, it takes time to raise production and the Administration doesn’t exactly behave like a friend of reliable energy. But the market works, and most bullish price forecasts for crude oil last year were wrong because they didn’t expect increasing US supply.

Our crude exports averaged a record high of 3.99 MMB/D in 1H23.

.avia-image-container.av-2xj1b04-2eaddbdb4f315357a43b96588e806347 img.avia_image{ box-shadow:none; } .avia-image-container.av-2xj1b04-2eaddbdb4f315357a43b96588e806347 .av-image-caption-overlay-center{ color:#ffffff; }

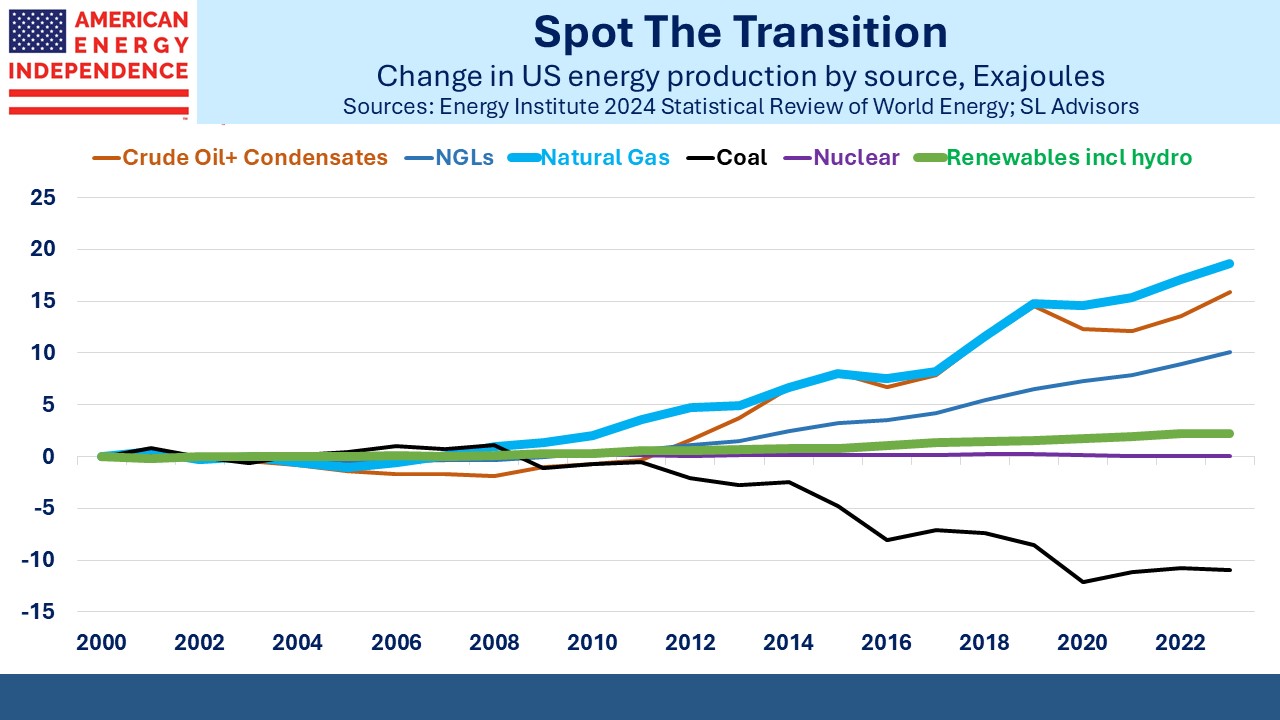
Natural Gas Liquids (NGLs, which include ethane, propane and butane) continue to set new records with volumes more than doubling over the past decade. Ethane is increasingly used in the petrochemical industry to manufacture various forms of plastics. Propane is used domestically for cooking where natural gas is unavailable, and by farmers for drying crops. But export growth is behind the steady increase in US propane production.

.avia-image-container.av-973mk4-f1713e534518ade50be83879f828ea7e img.avia_image{ box-shadow:none; } .avia-image-container.av-973mk4-f1713e534518ade50be83879f828ea7e .av-image-caption-overlay-center{ color:#ffffff; }

Natural gas production continues to set new records. As with crude oil, this has been done more efficiently, with the gas rig count falling 24% during the first ten months of last year. Some of the increased gas production has come from oil wells as associated gas, largely in the Permian basin in west Texas and New Mexico. The three major oil plays in the Permian are now producing almost 14 Billion Cubic Feet per Day (BCF/D) of gas, over a tenth of US output.

.avia-image-container.av-1zr5vec-20d165427f536509631c4442e9faf304 img.avia_image{ box-shadow:none; } .avia-image-container.av-1zr5vec-20d165427f536509631c4442e9faf304 .av-image-caption-overlay-center{ color:#ffffff; }

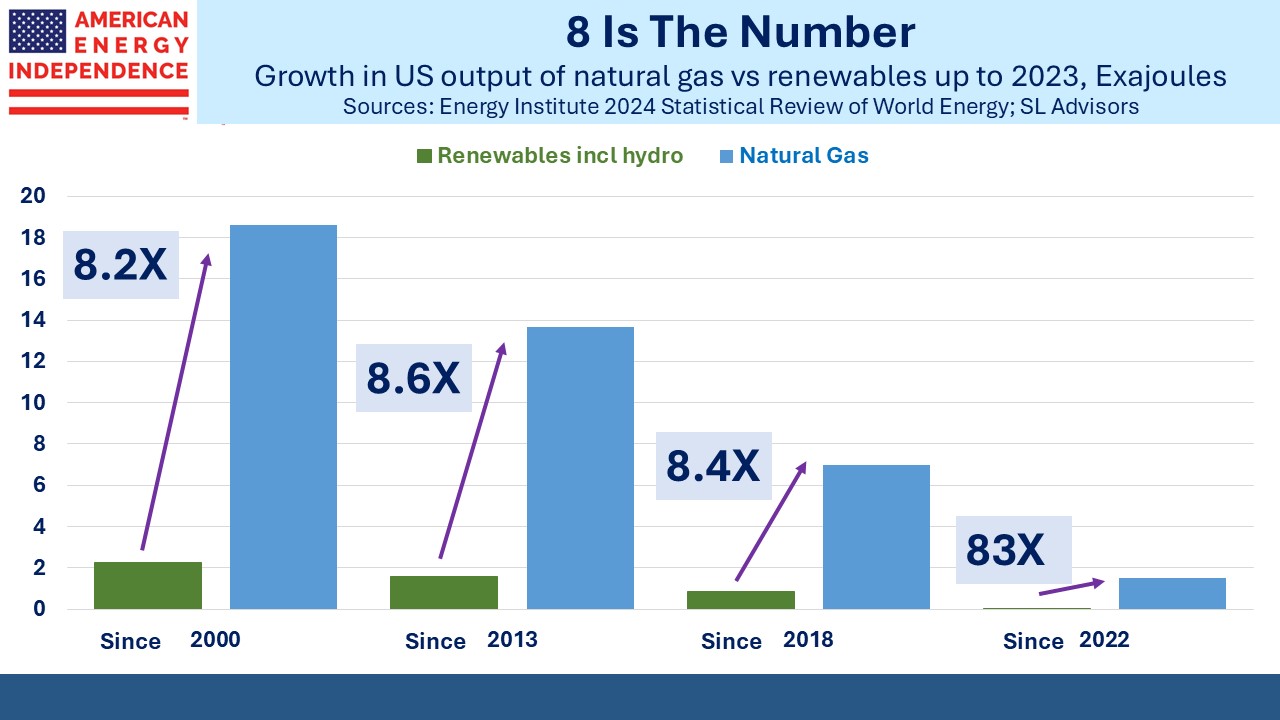
Natural gas production growth helped reduce our use of coal for power generation and is increasingly offering the same opportunity to our trade partners. LNG exports set another record last year, and the Energy Information Administration (EIA) expects export capacity to more than double by 2027.

.avia-image-container.av-1pvfdg4-ba1953f80489b426a65fb9e5497cba01 img.avia_image{ box-shadow:none; } .avia-image-container.av-1pvfdg4-ba1953f80489b426a65fb9e5497cba01 .av-image-caption-overlay-center{ color:#ffffff; }

This is all a big success story for America.

This abundance has weighed on prices for crude oil and domestic natural gas. Exxon Mobil warned that 4Q operating results could drop to $8.9BN, down 30% on a year ago. They also expect to write down California-based assets by $2.5BN in response to the Golden state’s hostile policies towards reliable energy.

.avia-image-container.av-189cq6s-7fda146685973ddd6bf2d449b6566c07 img.avia_image{ box-shadow:none; } .avia-image-container.av-189cq6s-7fda146685973ddd6bf2d449b6566c07 .av-image-caption-overlay-center{ color:#ffffff; }

Chevron expects to take $3.5-4.0BN impairment on its California assets due to “continuing regulatory challenges.”

Both stocks are down over the past year. Most of the energy sector had a poor year.

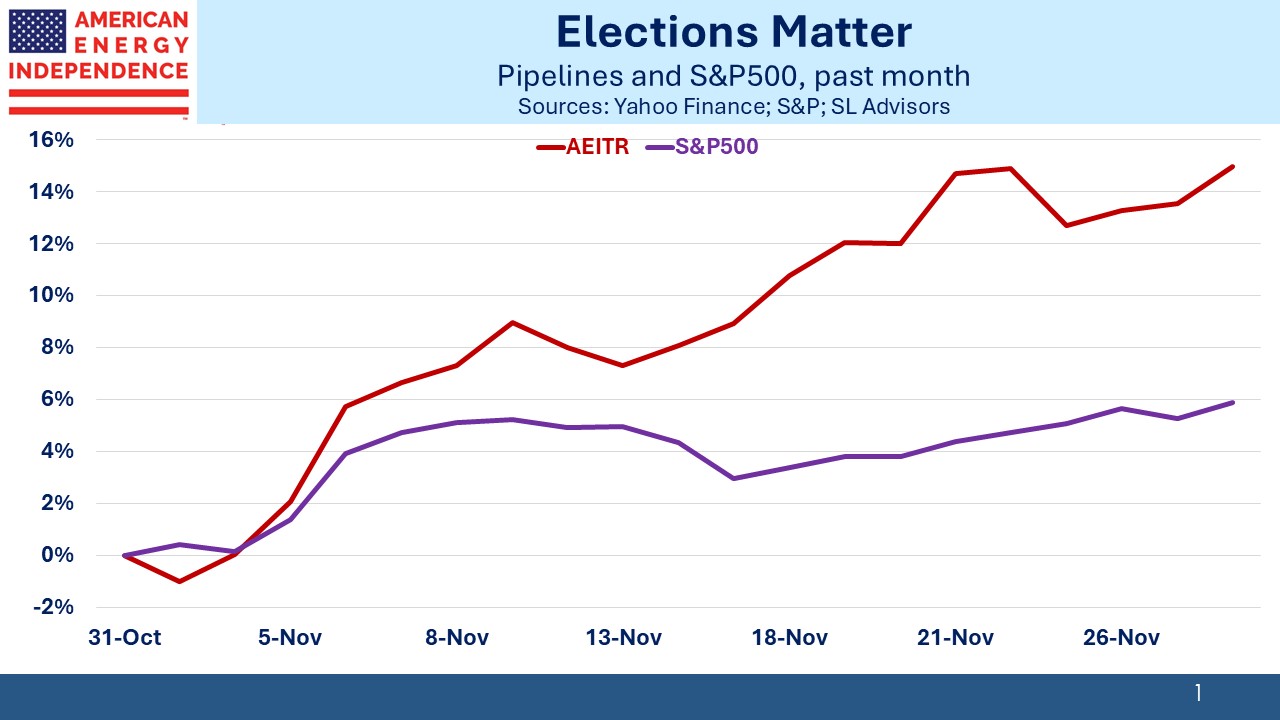
But the increasing volumes were good for midstream, with the American Energy Independence Index beating eight of the 11 S&P 500 sectors (see Higher Despite Retail Selling). The link between oil prices and pipeline stocks is weakening in response to lower leverage.

Record-setting US production of oil, NGLs and natural gas under a Democrat administration shows that the party in the White House has less influence than some think over the sector. Even though Biden famously promised to end fossil fuels four years ago when he was campaigning, that goal soon became aspirational and before long he was pleading for more oil.

VP Kamala Harris is from California, and assuming Biden keeps her on the ticket the presidential election will carry a real possibility that a second Biden term might be completed by a President Harris. There’s little about California’s energy policies that should endear investors to such a prospect.

But when you’re looking for energy policies to avoid, Germany usually offers a better example. The WSJ recently estimated that pursuing zero emissions will cost Germans €1.9TN by 2030. This is around half their GDP.

German voters have generally supported policies that are domestically ruinous and mostly serve to accommodate growth in emissions by emerging economies led by China and India. You’d think a willingness to spend so much would assure results – and emissions from Germany fell to 673 Million Metric Tonnes (MMTs), down by 73 MMTs and well below the government’s annual target of 722 MMTs. However, only 15% of this reduction was credited to improved efficiencies and renewables.

Half came from production cuts.

German policies have made energy so expensive, both because of the focus on renewables but also because of the reliance on Russian natural gas, that they are shrinking their way towards their climate goals.

Some of those German companies cutting back production are investing in new facilities in America.

Let’s hope the sharp contrast between American and German policies persists, unless German voters become more pragmatic – and more American.

.avia-image-container.av-ujo3dg-e4dffc7d5206a9a325ab0068ca9cebea img.avia_image{ box-shadow:none; } .avia-image-container.av-ujo3dg-e4dffc7d5206a9a325ab0068ca9cebea .av-image-caption-overlay-center{ color:#ffffff; }

We have three have funds that seek to profit from this environment:
Energy Mutual Fund

Energy ETF

Real Assets Fund


Bond Rally Helped Equity Valuations

It can fairly be said that the bond market boosted stocks in the last couple of months of the year. Equities have lost their cheapness in recent years, ever since the Fed belatedly became concerned about inflation. TINA became unfashionable as interest rates returned to unfamiliar, reasonable levels.

Compared with bonds, stocks are as expensive as they’ve been for at least two decades.  October was the worst point of the year for relative valuation. The Equity Risk Premium (ERP), defined here as the yield spread between S&P500 earnings and the ten year treasury, touched 1.0 as long term rates briefly reached 5%. The subsequent bond rally was helped in December by the FOMC’s Summary of Economic Projections (SEP) indicating rate cuts in 2024. The fall move in bond yields was so strong that the relative pricing of stocks still isn’t as poor as it was two months ago, even after an almost 16% rise in the S&P500.

.avia-image-container.av-2mlfmyx-da5c792f03932b8a3b215cba3d146cde img.avia_image{ box-shadow:none; } .avia-image-container.av-2mlfmyx-da5c792f03932b8a3b215cba3d146cde .av-image-caption-overlay-center{ color:#ffffff; }

The problem with considering the market’s ERP is that performance has been dominated by the “Magnificent Seven”*. Five of them sport an earnings yield nowhere close to the market. Tesla in particular looks ruinously priced. This blog maintains a spirited dialogue with fervently happy Tesla owners (watch EVs are NOT cheap) whenever we fail to embrace the charms of waiting 20-30 minutes to recharge.

.avia-image-container.av-29vnfxl-280acdaf80bfb6770dfb344a7787759c img.avia_image{ box-shadow:none; } .avia-image-container.av-29vnfxl-280acdaf80bfb6770dfb344a7787759c .av-image-caption-overlay-center{ color:#ffffff; }

Uber leases Teslas to some of their drivers, and I’ve only heard one complain about having to stop at a charging station in the middle of each workday. Elon Musk has built a devoted following, and a short trip to penury awaits those who short Tesla. The last short squeeze ended in 2020 when Tesla finally took pity on the shorts, providing more supply with a secondary offering following a tripling in price. It spent most of last year near the top of most shorted names. Bernstein is recommending a short sale.  but I think Tesla’s best avoided from both sides.

.avia-image-container.av-1gu69nt-7c3b04c1675d6adbec80eddd5d71a40d img.avia_image{ box-shadow:none; } .avia-image-container.av-1gu69nt-7c3b04c1675d6adbec80eddd5d71a40d .av-image-caption-overlay-center{ color:#ffffff; }

The domination by the Magnificent Seven is evident in the contrasting results of the S&P500 with its equal weight cousin. From 2013-2022, the annual returns of the market cap weighted version beat equal weight by an average of 0.7%. Last year was 12.4%. It was less about stock picking than how much AI you had in your portfolio.

The “Dogs of the Dow”, popularly defined at the ten stocks in the DJIA with the highest dividend yield, all lagged the S&P500 last year. Historically, their purchase has rewarded investors over the following year.

.avia-image-container.av-19owv61-71f426ebef592cc16f873cdc20917997 img.avia_image{ box-shadow:none; } .avia-image-container.av-19owv61-71f426ebef592cc16f873cdc20917997 .av-image-caption-overlay-center{ color:#ffffff; }

It does seem to be a moment of extreme valuations. Without the Magnificent Seven, the ERP would be closer to its long term average.

After examining the market from these various angles, 5.25% three month treasury bills seem pretty reasonable. The market is telling you the yield won’t last, but you never know. Jay Powell downplayed the inference from the December SEP that they’ll be cutting rates in the first half of this year. If you’re ambivalent on adding to equity exposure, even if rates fall this year and rolling over treasury bills averages, say, 4.5%, that hardly looks like a disaster.

.avia-image-container.av-pisls9-0051825308401d7d8d43c5aae6085b87 img.avia_image{ box-shadow:none; } .avia-image-container.av-pisls9-0051825308401d7d8d43c5aae6085b87 .av-image-caption-overlay-center{ color:#ffffff; }

Energy infrastructure continues to offer compelling cash returns. Enbridge (ENB) yields 7.6% and has increased its payout for 29 straight years. It still looks a compelling pairs trade versus a short SPY (noted in Fiscal Policy Moves Center Stage in early October). And January should see seasonal buying pressure in MLPs (see The MLP Yuletide Spirit). AMLP is the simplest way to play that – although this deeply flawed ETF is regularly criticized on this blog, it does have its uses as a short-term trading vehicle.

On December 26, also known as Boxing Day to Brits (email me if you want to know more), the Vogtle nuclear power plant in Georgia finally began commercial operations. It’s the first new nuclear reactor in the US since the Tennessee Valley Authority’s Watts Bar 2 was commissioned in 2016. France relies heavily on nuclear for power, and China is leading the world in new construction, as for many things. Spain confirmed they’re phasing out nuclear power by 2035.

It’s not credible to be concerned about global warming but also be anti-nuclear, the world’s safest form of power generation. If your only solution is to run everything on weather-dependent solar and wind, you’re promoting an enormous leap backwards for humanity rather than trying to solve the problem.


*Amazon, Apple, Google, Meta, Microsoft, Nvidia and Tesla

We have three have funds that seek to profit from this environment:
Energy Mutual Fund

Energy ETF

Real Assets Fund


Year-End Roundup

Heading into year’s end, a number of interesting stories caught my attention. Energy Transfer (ET) rarely avoids conflict and is embroiled in a dispute with three pipeline developers in Louisiana who sought crossings over Gulf Run Pipeline, owned by ET. Momentum Midstream, one of the developers with a $1.6BN project, accused ET of unfair trade practices. ET has also sought temporary restraining orders against Williams Companies and DT Midstream.

Pipelines routinely have to cross over or under each other as they crisscross the country. Momentum argues that without competition, ET could control up to 80% of the pipeline capacity supplying LNG exports in Louisiana. ET argued that the crossings sought were numerous, threatened pipeline safety and disregard ET’s exclusive ownership over certain stretches of land.

A court ruling is awaited. ET’s well-earned bare-knuckle approach to business hasn’t hurt the stock, +27% this year.

Morgan Stanley continues to report attention around the Alerian MLP Infrastructure Index (AMZI), which AMLP tracks (albeit not very well). The shrinking pool of MLPs is causing AMZI to be more concentrated and even to move beyond midstream infrastructure by incorporating USA Compression Partners, LP. At their recent rebalancing, AMZI publisher Vettafi retained the 12% position cap. Morgan Stanley continues to warn that AMZI might eventually relax its 12% cap or, more radically, AMLP might adopt a RIC-compliant index which would limit its MLP holdings to 25% (versus 100% now).

Such changes could create turmoil in MLP names. But Vettafi could also do nothing, reasoning that if investors didn’t like the fund’s current structure they wouldn’t own it.

Kinder Morgan’s (KMI) prescient sale of the TransMountain (TMX) pipeline project to Canada’s federal government in 2018 (see Canada’s Failing Energy Strategy) looks better every month. Facing unexpectedly hard rock, TMX recently asked the regulator for permission to drill a smaller-diameter pipe through a 1.4 mile section. The regulator turned them down, causing TMX to warn of a further two year delay if they are forced to proceed with the wider diameter. Canadian Natural, the country’s biggest oil producer, has urged the regulator to give its approval. Meanwhile the Trudeau administration approved another C$2BN in loan guarantees for a project quickly exceeding triple the cost anticipated when KMI made its well-timed exit.

A drought in Panama has impeded ship traffic through the canal in recent weeks. This is because the locks rely on supplies of inland fresh water to operate. As a result, Chile and some Asian buyers have reduced their imports of US gasoline from the gulf coast, depressing prices. The alternative route around the tip of South America is more costly and slower. Interestingly though, an LNG executive recently told us that Panama sets the canal tarrif close to the break-even point for ships considering the alternative. For US LNG exports to Asia, this suggests that the long route takes longer but doesn’t cost that much more.

In Oklahoma, fans of David Grann’s Killers of the Flower Moon will have been fascinated to see the Osage Nation win a victory against a wind farm built by Italian energy company Enel. A decade-long legal fight was settled when U.S. Court of International Trade Judge Jennifer Choe-Groves ruled eighty wind turbines had been illegally built. They have to be removed. You can find a more complete telling of this unusual tale here.

.avia-image-container.av-rbqzvl-c115256f64132832b8d0d4a30c0087fe img.avia_image{ box-shadow:none; } .avia-image-container.av-rbqzvl-c115256f64132832b8d0d4a30c0087fe .av-image-caption-overlay-center{ color:#ffffff; }

We know oil production has become more efficient over the years, but this chart of rigs versus production back to 1980 is a compelling visual. Few forecasters saw US oil production reaching a new high this year. But it did.

Finally, the slowdown in US EV sales continues to draw unwelcome news coverage. They’re still growing, but at a declining rate. EVs are also taking dealers about three weeks longer to sell than conventional cars. Sales tend to be concentrated in blue counties and states. Across the US EVs have an 8% market share, but in California it’s 24%. In Michigan it’s 3%.

The Administration wants to require that EVs represent 2/3rds of all automobile sales by 2032. Canada is planning to require all auto sales be zero emission by 2035.

The EPA estimates that the typical passenger car emits about 4.6 Metric Tonnes (MT) of CO2 per year. The Inflation Reduction Act values CO2 pulled out of the ambient air and permanently buried via Direct Air Capture (DAC) at up to $180 per MT in tax credits. This is enough to have encouraged Occidental to build the world’s biggest DAC plant and CEO Vicki Hollub is bullish on the technology.

It looks as if public policy is to force EV adoption by making conventional cars scarce. But if you’d prefer to own just one car, not two like most EV owners I know (a regular one for long journeys), a carbon tax based on 2X the DAC credit would impose a $1,656 annual cost on the owner of a gas-powered car. Some would willingly pay that for the convenience of easy refuelling and assurance that inadequate charging infrastructure wouldn’t force them to have their EV transported back home on a truck.

I would be one of those people willing to pay the $1,656 annually. It’s why a carbon tax would be better than the current method of subsidies, tax credits and regulation. It gives people a choice.

We have three have funds that seek to profit from this environment:

Energy Mutual Fund

Energy ETF

Real Assets Fund


Higher Despite Retail Selling

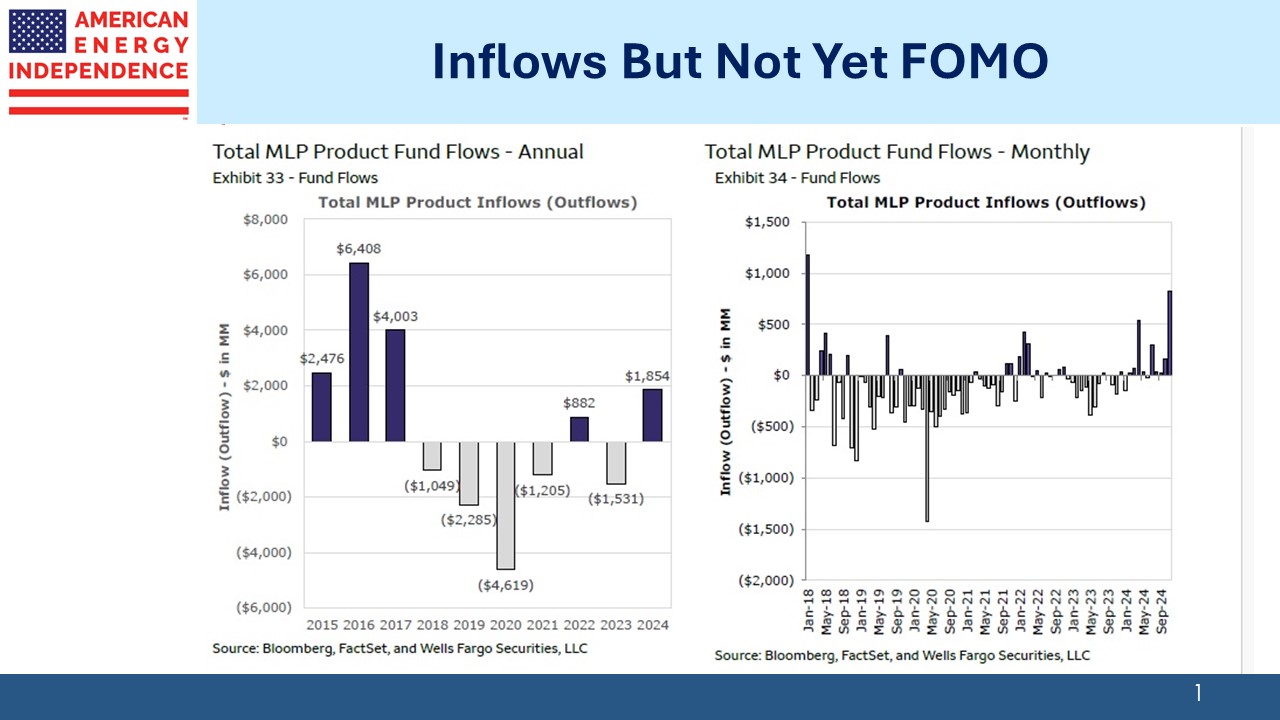
The only negative about the pipeline sector today is the direction of fund flows. It’s regularly covered in this blog and a topic that continues to mystify us. Although we’re still awaiting data for the last two months of 2023, it’s almost certain to be the fifth year of the last six during which retail investors exited MLP funds.

This category includes both the non-RIC compliant MLP-only funds like the Alerian MLP ETF (AMLP) as well as other RIC-compliant funds such as the ones we run. The $4.6BN that investors withdrew in 2020 can fairly be attributed to the pandemic. Leveraged funds were partly to blame (see MLP Closed End Funds – Masters Of Value Destruction).

.avia-image-container.av-2kkx1h0-19e1c5731545b0618d3bb4ef308aacd8 img.avia_image{ box-shadow:none; } .avia-image-container.av-2kkx1h0-19e1c5731545b0618d3bb4ef308aacd8 .av-image-caption-overlay-center{ color:#ffffff; }

But the outflows continued the following year even as the sector maintained its recovery. 2022 was an exception, perhaps because nine of the eleven S&P sectors were down as the Fed aggressively tightened policy. Energy was +64% and Utilities scraped out a 1% return.

The monthly data tells the same story, with only 19 out of 70 months since 2018 being positive.

Even more incongruous is that performance has been good. Four of the past six years have been positive, even though there was net retail buying in only one of those.

For investors, the 2020 market collapse caused by the pandemic was sharp but mercifully brief. The S&P500 finished the year +18%. The recovery was well under way entering 2021, as the vaccine rollout progressed. You’d think those pipeline investors not panicked into selling by the Covid collapse and blow up of closed end funds would be unshakeable. Apparently, they weren’t.

.avia-image-container.av-24cwy6s-5c567473095d1789d72228bc1be73336 img.avia_image{ box-shadow:none; } .avia-image-container.av-24cwy6s-5c567473095d1789d72228bc1be73336 .av-image-caption-overlay-center{ color:#ffffff; }

Over the past three years, the S&P Energy sector has easily beat the other ten S&P sectors, returning 36% pa. The “Magnificent Seven” with their AI theme have left the other 493 members of the S&P500 behind. But in spite of this, the S&P Technology sector has lagged energy considerably, delivering 15% pa.

Midstream energy infrastructure also beat the other ten sectors over three years, with 25% pa. There is this incongruity in which retail investors are selling but prices are nonetheless rising. Usually fund flows follow performance and even accentuate the prevailing trend.

.avia-image-container.av-1pm75jo-e9a15ea4afa24b417479ab739d42b9c6 img.avia_image{ box-shadow:none; } .avia-image-container.av-1pm75jo-e9a15ea4afa24b417479ab739d42b9c6 .av-image-caption-overlay-center{ color:#ffffff; }

The retail sellers are clearly missing out on the pipeline sector’s strong performance. Some are probably motivated to avoid energy because of concerns about climate change, and that must also apply to the legions of investors who choose not to commit capital to the sector. This is in spite of strong operating performance and declining leverage, routinely noted on this blog. In rejecting midstream energy infrastructure, these investors exhibit the antithesis of irrational exuberance – call it irrational gloom.

Pipeline companies have taken the other side of the retail selling. Just one company, Cheniere, has offset the retail outflows from MLP funds with their buyback program in 2023. Adding back those from Kinder Morgan, Targa Resources, Enterprise Products and Energy Transfer results in buybacks of more than double the net outflows. The less informed have been selling to the better informed. It’s why the sector has performed so well in spite of investor selling.

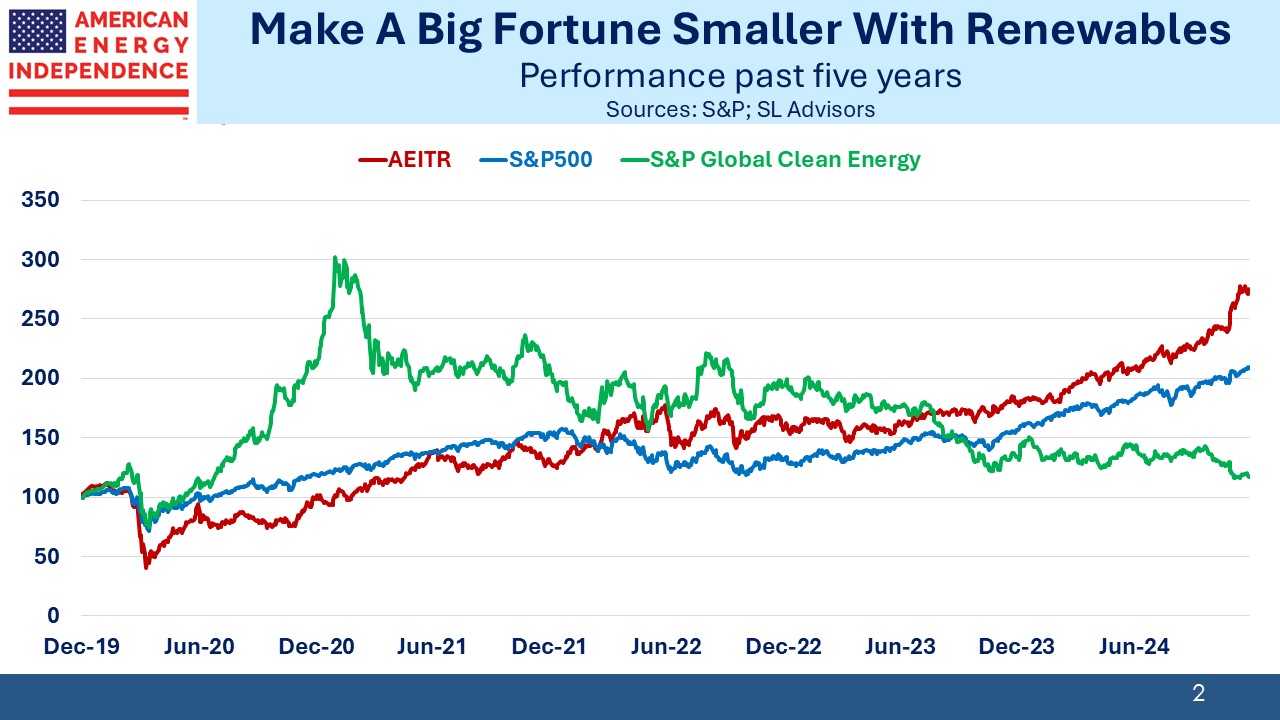
Perhaps those who have been underweight traditional energy for up to the last three years will finally reconsider as we enter 2024.  If they’ve been allocated to clean energy they’ll have done even worse.

.avia-image-container.av-zv53hw-44ff08da9252ce13bfafa4728646e0a6 img.avia_image{ box-shadow:none; } .avia-image-container.av-zv53hw-44ff08da9252ce13bfafa4728646e0a6 .av-image-caption-overlay-center{ color:#ffffff; }

The S&P Global Clean Energy Index (SPGTCED) has done worse than any of the S&P’s eleven sectors since 2021 and finished behind all of them in two of the past three years. Even a 1% bias within an investor’s energy allocation towards clean energy would have cost 0.5%pa in underperformance.

We’re open to investing in renewables if only we could identify profitable opportunities. Stable visible cashflows are nowhere to be found in solar and wind. Many of the investors who reject traditional energy on non-economic grounds use the same analysis to favor SPGTCED. But they’ve found that Federal subsidies and a conviction that they’re doing the right thing can’t overcome poor economics and the cost of intermittency. If the prospects for steady profits improve we’ll revisit, but don’t feel we’ve missed anything so far.

Pipeline companies will continue their buybacks next year, continuing to offset the net fund outflows. And if retail investors merely stop selling that should provide a further boost.

This blog can be accused of being a persistent cheerleader for the sector. But for the past three years, that advice has aligned with results. We’re optimistic that 2024 will be similar.

.avia-image-container.av-jb66yc-16958ca8af385d48f16daca8c0e7a7aa img.avia_image{ box-shadow:none; } .avia-image-container.av-jb66yc-16958ca8af385d48f16daca8c0e7a7aa .av-image-caption-overlay-center{ color:#ffffff; }

We have three have funds that seek to profit from this environment:
Energy Mutual Fund

Energy ETF

Real Assets Fund


Of Christmas Lights And Ladders

Christmas is a time of traditions, which in turn create nostalgia. Like endorphins, this is a free and harmless narcotic.  

Putting up the external Christmas lights, which we typically do right after Thanksgiving, usefully expends a few calories and kicks off that warm Yuletide feeling. Hunting through dusty boxes in the chilly attic for last year’s lights inevitably evokes Clark Griswold. It reminds me not to get locked up there. 

Draping colored lights over the bushes near our front door easily adds Christmas cheer. 

I’m especially pleased by the wreath, which hangs fifteen feet up above the front door over a window. Its positioning may not look especially challenging, but my first attempt required considerable planning. The stone façade ruled out hammering a nail into the wall. I spotted a hook twenty five feet up near the roof that originally supported a window awning nearly a century ago. I concluded the wreath needed to hang from there. 

I devised specialized equipment, including a long pole repurposed from changing light bulbs too high to reach. I had to ascend most of the way up a twelve foot ladder, then use the pole to snag a looped piece of wire onto the hook. 

Still poised unsteadily on the ladder, I then threaded the wire through the wreath. It was finally secured by reaching out to it through an upstairs window. I have been performing this feat annually ever since. My younger daughter holds the ladder and offers moral support, so between us we project a visible expression of Christmas with no other assistance.  

.avia-image-container.av-1403r1c-e507a9dbae4598a8ed5f0057f6805c8c img.avia_image{ box-shadow:none; } .avia-image-container.av-1403r1c-e507a9dbae4598a8ed5f0057f6805c8c .av-image-caption-overlay-center{ color:#ffffff; }

Over the years I have drawn some pride from solving this installation problem. Most of my accomplishments at home maintenance involve writing a check to someone more skilled than me at resolving the issue at hand. This annual demonstration of practical competence provides modest satisfaction.  

I don’t just keep the house running by changing lightbulbs.  

We live in a neighborhood where it’s becoming increasingly common to have the Christmas lights hung professionally. Landscaping contractors are finding it a useful sideline during the offseason. Snow removal, which some of them also provide, has been unprofitable in New Jersey for the past couple of years. Blame global warming.  

.avia-image-container.av-s5gixs-23088592ff9e0019dc8a6a940439c587 img.avia_image{ box-shadow:none; } .avia-image-container.av-s5gixs-23088592ff9e0019dc8a6a940439c587 .av-image-caption-overlay-center{ color:#ffffff; }

A crew of six armed with long ladders and a staple gun can quickly transform a suburban home into a light extravaganza. Illuminations are effortlessly strung at heights I’d rather not scale. The entire house glows Christmas cheer.  

I am a big fan of progress, but I find this trend towards commercial light installations a disappointment. 

I never considered our lights to be in a competition. We’re doing our bit to show ’tis the season to be jolly, to spread comfort and joy. But I must confess to a slight feeling of inadequacy as I drive back home past displays that wouldn’t look out of place adorning a hotel or in the Magic Kingdom. That I invested greater personal effort seems rather foolish when considering the results. The others put in less work. And less love. They just wrote a check.  

.avia-image-container.av-umtou8-a1acecde3d5b4e79601996208964460f img.avia_image{ box-shadow:none; } .avia-image-container.av-umtou8-a1acecde3d5b4e79601996208964460f .av-image-caption-overlay-center{ color:#ffffff; }

Nonetheless, I am not about to join the crowd and outsource the Christmas lights. Next year I’ll just have to create a more extensive display without climbing on the roof. The neighboring houses offer plenty of inspiration.  

The result will still be less than others nearby. But it’ll be my own work, and infinitely more satisfying as a result. 

I hope this anecdote made you smile and boosted your festive spirit. Normal market commentary will resume on Wednesday. 

Merry Christmas or, if it’s more appropriate, Happy Holidays.  


The MLP Yuletide Spirit

This time of year usually prompts a blog post on MLP seasonals. It’s been a reliable topic (see 2015’s Why MLPs Make a Great Christmas Present or 2016’s Give Your Loved One an MLP This Holiday Season). The Alerian MLP Infrastructure Index (AMZI), which is tracked by the Alerian MLP ETF (AMLP) has long displayed a pronounced January effect. Individual investors tend to assess their portfolios around the calendar year end, but the K1s accentuate this effect for MLPs.

If you’re considering selling an MLP, doing so in December instead of January avoids an extra K1 for the stub year. Similarly, a purchase delayed from December to January avoids a one month K1 from the prior year. Using AMZIX data since 1996, the January effect is clearly visible.

.avia-image-container.av-2cf7wq4-2a8b138826f47ac379b8b3699aa5897b img.avia_image{ box-shadow:none; } .avia-image-container.av-2cf7wq4-2a8b138826f47ac379b8b3699aa5897b .av-image-caption-overlay-center{ color:#ffffff; }

The Covid pandemic distorted the pattern somewhat. In March 2020 the AMZIX collapsed, closing the month –48%. It was a miserable time to be invested in the sector. The following month’s rebound was +48%, although that still left the index –34% YTD. Some excessively leveraged operators were partly to blame (see MLP Closed End Funds – Masters Of Value Destruction).

These two months dominate the average March and April returns, rendering the other months seemingly inconsequential.

Five years ago it looked as if the seasonal pattern was weakening (see MLPs Lose That Christmas Spirit) but in hindsight we were just looking back on a period of poor performance during which almost every month was flat or down.

.avia-image-container.av-280jw0c-59ccbad5d5023f8908bc0f55e5735954 img.avia_image{ box-shadow:none; } .avia-image-container.av-280jw0c-59ccbad5d5023f8908bc0f55e5735954 .av-image-caption-overlay-center{ color:#ffffff; }

Seasonals are now back in vogue. Sell-side research routinely mentions the January effect. Morgan Stanley noted that year-end, “historically has pointed to positive performance capture in late December through January.” A strategy of going long at the end of November for two months has an average return of +2.9%, roughly a third of the annual return. Morgan Stanley found that since 1996 MLPs have “posted a positive total return from December 15 through the substantive balance of January,” constituting 41% of the total return during that time.

.avia-image-container.av-1ql7fvw-626d2d31ee2e5411fb67d02da7da7c61 img.avia_image{ box-shadow:none; } .avia-image-container.av-1ql7fvw-626d2d31ee2e5411fb67d02da7da7c61 .av-image-caption-overlay-center{ color:#ffffff; }

It has been possible to earn much of the sector’s return with comparatively short holding periods arranged around year’s end.

The effect is less pronounced for the American Energy Independence Index (AEITR), probably because it limits MLPs to 20% so as to be investable in a fund without being taxed as a corporation. Institutions are much less likely to be driven by the calendar, not least because their investment returns are mostly not taxed. The S&P500 exhibits no meaningful seasonal pattern.

.avia-image-container.av-47000c-cbdc99c3f0439805df10f0834b02fdbe img.avia_image{ box-shadow:none; } .avia-image-container.av-47000c-cbdc99c3f0439805df10f0834b02fdbe .av-image-caption-overlay-center{ color:#ffffff; }

Less appreciated is the quarterly pattern around payouts. MLP investors love their distributions, which are generally paid in the first month of the quarter. Because of the distortion caused by Covid in 2020, it’s helpful to look at median returns rather than average. Over the past five and ten years this quarterly pattern is generally visible. For the past decade January was positive seven times and April eight. Oddly, July doesn’t show any seasonality.

Even with the median return, April still stands out as an appealing month. Perhaps a few investors annoyed at the delayed tax filing often caused by K1s decide to sell just as soon as they receive their April distribution. This was even true during the 2013-18 period when no other seasonal pattern was visible. I’ve personally found April to be the most interesting time to make seasonal trades in this sector.

Few MLP investors will find trading their positions appealing. The point of MLPs is to enjoy those tax deferred distributions for as long as possible, putting off indefinitely the recapture of taxes generated by a sale. These holders wouldn’t be interested in the possibility of a quick buck at the risk of an accelerated tax obligation.

In the spirit of open-mindedness and in spite of its numerous shortcomings routinely described on this blog, I can suggest AMLP as a temporary trading vehicle for this purpose. Since it is 100% MLPs it reflects the same seasonal pattern as its index, AMZI. In the past I have found it preferable to use options on AMLP rather than buying or selling the ETF directly. I already have plenty of exposure to the sector, so concluded that for a trade seeking to pick up a few per cent it’s imprudent to add any more long exposure.

In Sunday’s blog I incorrectly said Vettafi, who publishes AMZI, had dropped the 12.5% position limits in their quarterly rebalancing and allowed Energy Transfer to remain at 19.5%, a level it reached both through appreciation and the acquisition of Crestwood. It turns out they were just slow to update their website. TMX Group  announced their acquisition of Vettafi last week. Perhaps they were distracted.

.avia-image-container.av-jyxdyk-1dbe3b697a7aa5d213b1e616532c9b8a img.avia_image{ box-shadow:none; } .avia-image-container.av-jyxdyk-1dbe3b697a7aa5d213b1e616532c9b8a .av-image-caption-overlay-center{ color:#ffffff; }

We have three have funds that seek to profit from this environment:
Energy Mutual Fund

Energy ETF

Real Assets Fund


Safely, Cautiously Bullish

There’s no particular reason why a 12 month outlook is more important at year’s end, but that is nonetheless when research analysts take stock of past forecasts and offer new ones. In late 2022 many economists were forecasting a recession by now. In his press conference on Wednesday, Fed chair Jay Powell retained enough humility to avoid it looking like a victory lap. The FOMC’s own forecasts have often been inaccurate in the past (see Policy Errors On Interest Rates And Energy). As he once said himself forecasters should be humble and have much to be humble about. The Fed’s critics are silenced for now.

The 2024 outlook is described as “cautious” for midstream by Wells Fargo, and “mixed” although “tactically constructive” for energy more broadly by JPMorgan. Morgan Stanley says, “We see a path higher post the pullback, but risks still exist.” Irrational exuberance is nowhere to be seen.

Perhaps analysts are chastened by S&P Energy ETF (XLE), which has had a disappointing year; at -1.35% it’s 24% behind the S&P500. Midstream has been the standout within the energy complex. The American Energy Independence Index (AEITR) is +14% YTD. MLPs have been especially strong, with Energy Transfer (ET) +26%. The many financial advisors we talk to who own ET should be happy.

Morgan Stanley notes that energy stocks are at a 55% discount to the S&P500, 2X the average over the past decade. They are also bullish on crude oil, like most analysts, seeing Brent averaging $85 next year. There’s just not enough E&P capex to cover well depletion plus demand growth. This has been the bull thesis on oil for some time. Perhaps now it will work.

The Fed’s latest Summary of Economic Projections (SEP) includes three rate cuts next year, although Powell reminded journalists that this isn’t a plan, simply the aggregate guidance from 19 FOMC members, all but two of whom expect at least one cut. PCE inflation is expected to reach 2.1% by 2025 with unemployment historically low at 4.1%. Phillips Curve adherents will find fault with this rosy outlook, but economists and the interest rate futures market look for a “soft” landing next year, dubbed by the WSJ the “Most Crowded Trade on Wall Street.”

.avia-image-container.av-18l53wb-a6af6b38e483bb97a3a115bdf810c295 img.avia_image{ box-shadow:none; } .avia-image-container.av-18l53wb-a6af6b38e483bb97a3a115bdf810c295 .av-image-caption-overlay-center{ color:#ffffff; }

Dividend yield plus dividend growth plus buybacks is a good way to forecast cash returns, exclusive of any capital appreciation, for pipelines. Wells Fargo sees 7% + 4% + 0-1% on this metric, providing a solid 11-12% total return forecast for 2024.

Cash became a legitimate investment choice this year. With a couple of brief exceptions prior to the 2020 pandemic, the last time cash earned a positive real return of any consequence was in 2008 before the Great Financial Crisis.

CPI is currently running at 3.1% (4.0% ex food and energy). Cash was trash for so long that for a significant percentage of today’s investors that’s all they’ve experienced. But treasury bills yielding 2% or so above inflation seems like a decent choice for anyone ambivalent about committing more long term capital to stocks. Occasionally investors have questioned why midstream infrastructure yields of 7% are to be preferred over a riskless 5.25%.

The answer lies in the Fed’s apparent pivot on interest rates, since this should further highlight the sector’s yield. 5.25% treasury bill yields look increasingly temporary. If so, midstream stocks may provide some capital appreciation on top of the projected 11-12% cash return.

Vettafi, which publishes the Alerian MLP Infrastructure Index (AMZI), dropped their 12% position limit in their quarterly rebalancing last week. This avoided the reduction of positions in several MLPs, notably ET which has reached 19.5%, partly because of its acquisition of Crestwood.

Had the 12% limit been maintained, rebalancing would have resulted in over $500MM in ET shares being sold by the Alerian MLP Fund (AMLP) which tracks AMZI. XLE’s two biggest holdings, Exxon Mobil and Chevron, represent 39% of that fund. Energy investors like their bets concentrated. AMLP is adopting that model.

ET is 5% of the AEITR, more representative of its share of the sector’s market cap.

The COP28 ended with a commitment to “transition away” from fossil fuels – a pledge to phase them out failing to draw enough support. They currently provide 80% of the world’s energy.

Solar and wind are 3%. They’re not yet growing fast enough to even satisfy the world’s increasing demand for energy. The International Energy Agency reported that coal consumption reached a new record of 8.5 billion metric tonnes this year, up 1.4% from last year.

Everybody should want to see coal phased out. It’s the most prolific source of CO2 emissions per unit of energy produced, and also creates harmful local pollution. Yet India burned 8% more this year and China 5%, due to growing electricity demand and weak hydropower output.

North American LNG exports look set to double over the next four years as several new export facilities become operational. That will help to curb the emerging world’s insatiable appetite for coal.

.avia-image-container.av-n9ad0b-09c62038a0ff6491813adbc758bd16e7 img.avia_image{ box-shadow:none; } .avia-image-container.av-n9ad0b-09c62038a0ff6491813adbc758bd16e7 .av-image-caption-overlay-center{ color:#ffffff; }

We have three have funds that seek to profit from this environment:
Energy Mutual Fund

Energy ETF

Real Assets Fund


Pipelines Shed Their Oil Sensitivity

Brent crude currently trades for around $4 per barrel less than a year ago. Back then Goldman Sachs published another highly convincing research report predicting higher oil driven by increasing demand and chronic underinvestment in new supply. Since then Jeff Currie has left the firm, hopefully not because of his not yet vindicated commodity super cycle thesis. Plenty of other firms were bullish. JPMorgan was cautiously looking for prices to be $6 higher. Few were loudly negative.

It’s therefore been an opportune moment for midstream energy infrastructure, as represented by the American Energy Independence Index (AEITR) to separate itself from oil and move higher.

.avia-image-container.av-2zydld2-e8129d5e176afd884774f5f40146841e img.avia_image{ box-shadow:none; } .avia-image-container.av-2zydld2-e8129d5e176afd884774f5f40146841e .av-image-caption-overlay-center{ color:#ffffff; }

The chart shows the two started to move more synchronously in 2015. This was roughly when the global oil market woke up to the increased supply provided by the US shale revolution. Pipeline companies had increased their capex to support higher volumes. This increased their sensitivity to oil prices, exacerbated by increasing leverage.

The “toll road” model of MLPs became deeply discredited. Distribution cuts followed. Corporations fared far better than MLPs. The current quarterly distribution of the Alerian MLP ETF (AMLP) remains 41% below its 2016 peak. This distribution is also now all classified as ordinary income, rather than as a return of capital which acts as a deferral of taxes (see AMLP Fails Its Investors Again).

The pandemic brought another co-ordinated swoon in oil prices and pipeline stocks, although both soon recovered, leaving only the hapless investors in closed end MLP funds with any lasting damage since they’d had to delever at the lows (see MLP Closed End Funds – Masters Of Value Destruction).

.avia-image-container.av-2nywr9i-6df39159037ea2cf6cdf395962c06286 img.avia_image{ box-shadow:none; } .avia-image-container.av-2nywr9i-6df39159037ea2cf6cdf395962c06286 .av-image-caption-overlay-center{ color:#ffffff; }

The most recent 100-day correlation of oil and pipelines is close to the lowest in five years. Midstream earnings have been reliably good every quarter this year, with companies regularly meeting or beating expectations and offering improved forward guidance. This is what’s behind the 14% YTD return, meaningfully ahead of the S&P Energy ETF (XLE) which is –3% YTD.

Although it’s not blindingly obvious from the correlation chart, the weaker recent relationship between crude prices and pipeline stocks has coincided with declining leverage. This makes sense – stronger balance sheets are better able to withstand fluctuations in throughput. We have always believed the sector’s sensitivity to commodity prices reflected the vagaries of investor sentiment more than revised expectations of cash flows. But as Debt:EBITDA has fallen back below 4.0X to 3.5X on its way towards 3.0X, the frustrating link with oil has moderated.

.avia-image-container.av-20ov05i-a3917af2521a185ea62847ae541f6af4 img.avia_image{ box-shadow:none; } .avia-image-container.av-20ov05i-a3917af2521a185ea62847ae541f6af4 .av-image-caption-overlay-center{ color:#ffffff; }

This has been accompanied by US crude output that recently set a new record of 13.2 Million Barrels per Day (MMB/D). Consensus early this year was that US production would grow slowly given the declining quality of undrilled shale wells and continued capital discipline. But E&P companies are demonstrating improved capital efficiency, producing more per dollar of capex. Chevron CEO Mike Wirth recently made this point on CNBC when Becky Quick asked why capex was lower than in recent years in spite of the recovery in prices and Administration pleas to pump more (for now, anyway).

.avia-image-container.av-1p5tqcm-b9aaf19177d6deaef69d5283b282c7a2 img.avia_image{ box-shadow:none; } .avia-image-container.av-1p5tqcm-b9aaf19177d6deaef69d5283b282c7a2 .av-image-caption-overlay-center{ color:#ffffff; }

Investors committing capital to the sector understand that current 6-7% yields are excessive given the declining risk profile. Infrastructure assets with visible, stable cashflows have drawn buyers this year even with the Fed raising rates.

.avia-image-container.av-18cibly-c5c2b655309c5566a667e5a69aefdb42 img.avia_image{ box-shadow:none; } .avia-image-container.av-18cibly-c5c2b655309c5566a667e5a69aefdb42 .av-image-caption-overlay-center{ color:#ffffff; }

Tellurian (TELL) CEO Charif Souki was just ousted from Tellurian, the second time an LNG company he founded has given him the boot. TELL has struggled to get their Driftwood LNG facility started, in large part because Souki’s long term bullish view on global natural gas prices led to TELL retaining price risk on their liquefaction contracts. The consequent higher risk profile has made financing harder to obtain. Delays have allowed buyers to cancel contracts, further imperiling the company’s ability to raise capital.

The contrast with NextDecade (NEXT) is striking. Two years ago both companies were signing long term contracts to supply LNG and negotiating with investors for the capital to build their respective greenfield LNG terminals. Breakthroughs and disappointments caused sharp moves in both stocks. But NEXT achieved Final Investment Decision (FID) on their Rio Grande facility in the summer. The market has become steadily more skeptical that TELL will similarly reach FID on their Driftwood project.

Last month TELL warned investors there was substantial doubt about its ability to remain a going concern.

Carl Icahn figured long ago that Souki was a visionary but not the guy you want running the business, which led to Souki’s ouster from Cheniere in 2015. His compensation has been notoriously high and divorced from tangible results. He was recently paid $20 million (watch Tellurian Pays For Performance in Advance). The board finally had enough. Souki’s oversized risk appetite and compensation persuaded us and many others to invest elsewhere a long time ago.

.avia-image-container.av-s1ncme-e5258f7f71453cd0459fd9062428e7a9 img.avia_image{ box-shadow:none; } .avia-image-container.av-s1ncme-e5258f7f71453cd0459fd9062428e7a9 .av-image-caption-overlay-center{ color:#ffffff; }

We have three have funds that seek to profit from this environment:
Energy Mutual Fund

Energy ETF

Real Assets Fund


Report From Wells Fargo Conference

SL Advisors partner Henry Hoffman spent a couple of days last week at the Wells Fargo Midstream and Utilities Symposium. He had the opportunity to meet with many of our portfolio companies and drew some useful insights.

Below are Henry’s notes from the event.

Chatter at the Conference:

Throughout the one-on-one meetings, hallway conversations, and mealtime discussions, Equitrans (ETRN) was a hot topic. Everyone seemed intrigued by the article published last Friday, hinting at a possible sale of the company. Questions arose: had they received a tempting offer, prompting them to explore broader interest? And if so, who might the potential buyer be? Could a deal materialize before the Mountain Valley Pipeline project’s valves were even turned on? One CEO humorously referred to ETRN as “eye candy for anyone who looks at a map.” Speculation was rampant, with my personal favorite theory coming from an analyst at a hedge fund who suggested they might have received an offer from Energy Transfer, sparking the “leak” for Williams to swoop in as a white knight defensive bidder against ET’s potential encroachment into Williams’ territory. The conference buzzed with theories and excitement, and the possibility of a bidding war for ETRN could inject fresh energy into the midstream sector.

Editor’s Note: Wells Fargo thinks Kinder Morgan may also be an interested buyer.

Most Impressive Management of the Conference:

Cheniere’s CFO, Zach Davis, delivered a meticulously calculated approach to value creation at Cheniere. Their disciplined strategy has allowed them to offer LNG liquefaction rates at a substantial premium compared to competitors, with no trouble filling new capacity slots to the satisfaction of existing customers. Cheniere’s ability to generate surplus free cash flow provides them with significant flexibility for investments in additional trains, debt reduction, or share buybacks, all geared towards enhancing shareholder value.

.avia-image-container.av-m6vwgs-b7a06d170c8f0f40b9a6c813e774e28e img.avia_image{ box-shadow:none; } .avia-image-container.av-m6vwgs-b7a06d170c8f0f40b9a6c813e774e28e .av-image-caption-overlay-center{ color:#ffffff; }

Topic That Left Me Puzzled:

A surprising revelation at the conference was that Carbon Capture, Utilization, and Storage (CCUS) is progressing more slowly than anticipated. Despite the potential for substantial financial incentives from Congress, there appears to be a lack of urgency from the Biden administration in providing guidance and clarity. Consequently, there have been fewer Class 6 wells drilled than expected. This came as a surprise since one might have assumed that drilling vertical wells and injecting CO2 would be a straightforward geological matter, especially without the pushback from anti-fossil fuel groups, given that CCUS directly involves capturing CO2. The expected surge in CCUS activity after the Inflation Reduction Act has yet to materialize, and the industry seems to be off to a slow start.

#1 Misunderstood Story:

Ironically, the simplest narrative appears to be the most misunderstood investment opportunity in the industry. NextDecade’s (NEXT) CEO, Matt Schatzman, outlined the case for the first three trains (Phase 1) at the Rio Grande site in South Texas as laying the foundation for a massive LNG facility akin to Cheniere’s. Phase 1 brought in strategic partner Total Energies, a lending syndicate of 30 major banks, EPC partner Bechtel, and equity partners, including premier private equity infrastructure fund Global Infrastructure Partners (GIP), GIC (Singaporean sovereign wealth fund), and Mubadula (the sovereign wealth fund of the Emirate of Abu Dhabi). These partnerships enhance the certainty of additional trains, which promise significantly higher economics for NEXT.

Phase 1’s estimated cash inflow of ~$250 million for all three trains translates to roughly $83 million per train. By contrast, Trains 4 and 5 are projected to yield $700-$1 billion in cash flows or approximately $425 million per train, including the option for equity partners to participate. Furthermore, NEXT has the land available for three more trains (Trains 6-8), which are expected to offer even better economics, as they do not have the same obligations to current equity partners as options on Trains 4-5. There’s also the potential upside from their Carbon Solutions business, although this remains uncertain, as touched upon earlier.

Energized CEO Award:

Kinetik Holdings CEO Jamie Welch exuded enthusiasm for the investment case. In his distinctive Australian accent, he referred to 2024 as a “barn burner” year, anticipating a sharp drop in capital expenditure and a surge in free cash flow. He was highly optimistic about creating substantial shareholder value, to be realized when they find the right buyer for the company.

Additional Insight on M&A:

During the conference, Enterprise Products (EPD) Co-CEO & CFO, Randy Fowler, shared astute comments on M&A in the midstream sector. He believes that strategic buyers will dominate the landscape. However, Fowler emphasized the need for strategic buyers to exercise caution when considering private equity acquisitions, citing concerns about quality and downstream commitments. When you buy an asset, you really want the flexibility to control the molecule.  For a purchase to be viable for them, it must meet two key criteria: it must possess “industrial merits” and be accretive to cash flow per unit when adjusted for leverage.

We have three have funds that seek to profit from this environment:

Energy Mutual Fund

Energy ETF

Real Assets Fund