Pipeline Stocks Chart a Higher Path
Technical analysis shows that the outlook for pipeline stocks is bullish.
We rarely write on technicals, since we’re relentlessly focused on the fundamentals. But fundamental news has been light, with prices drifting irregularly lower. Investors are overwhelmingly frustrated with the failure of pipeline company stocks to reflect growing throughput volumes. The U.S. just claimed World’s Biggest Oil Producer (see America Seizes Oil Throne). Liquified Natural Gas exports are set to more than double next year (see U.S. Oil and Gas Exports: A New Weapon). In willful defiance, pipeline stocks sagged. One sell-side analyst described recent investor meetings as, “at times blurred between market discussions and therapy sessions.”
For a chartist relying on technical analysis, we think the sector is setting up for a sustained rally. We don’t make investment decisions based on charts. As a visual price history they are helpful, but our portfolio adjustments are driven by shifts in long term fundamentals. However, many investors use technical analysis as a timing aid. Some pore over charts carefully before making decisions. Absent much market-moving news, such analysis is more relevant.
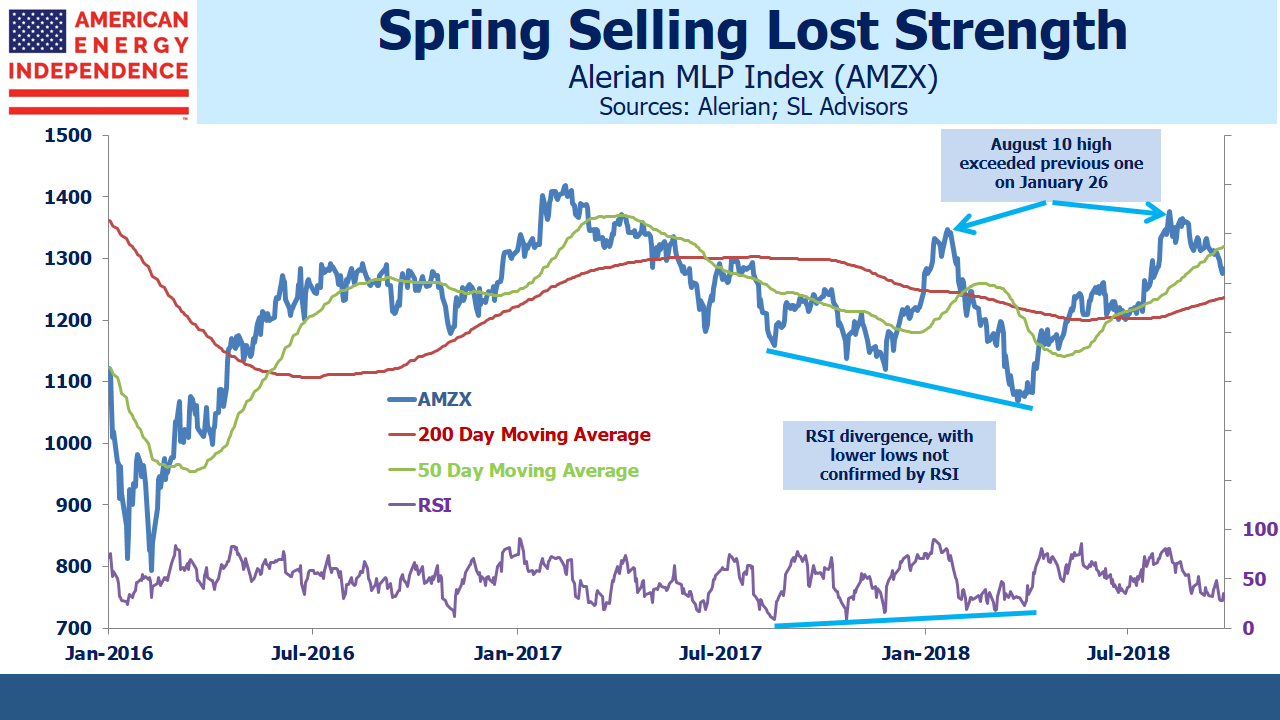
Energy infrastructure charts show three bullish patterns. The first is that the sequence of lower lows from late last year into Spring was not confirmed by the Relative Strength Index (RSI) readings. This type of divergence typically indicates weaker conviction among sellers on each successive dip, warning of a change in trend. Sure enough, the recent August high exceeded the prior one in February, revealing that a new uptrend has begun.
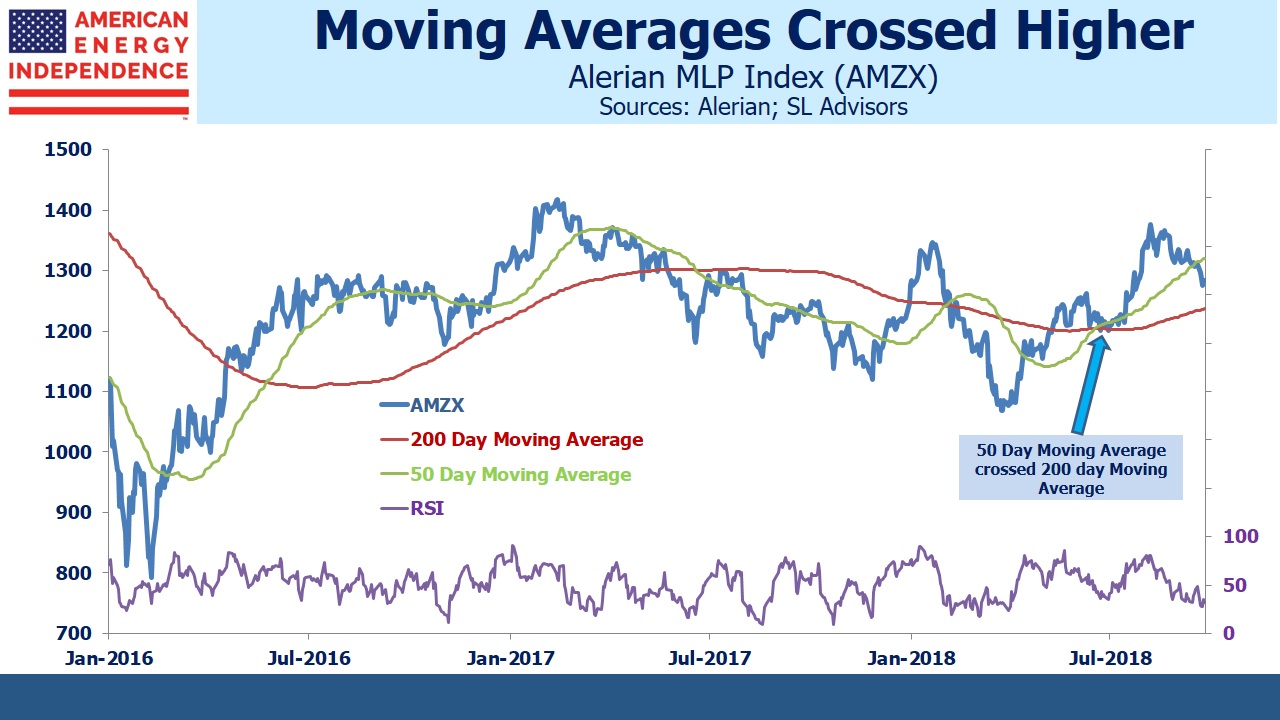
Supporting this, in June the 50 day moving average convincingly crossed the 200 day moving average, following which the sector moved smartly higher.
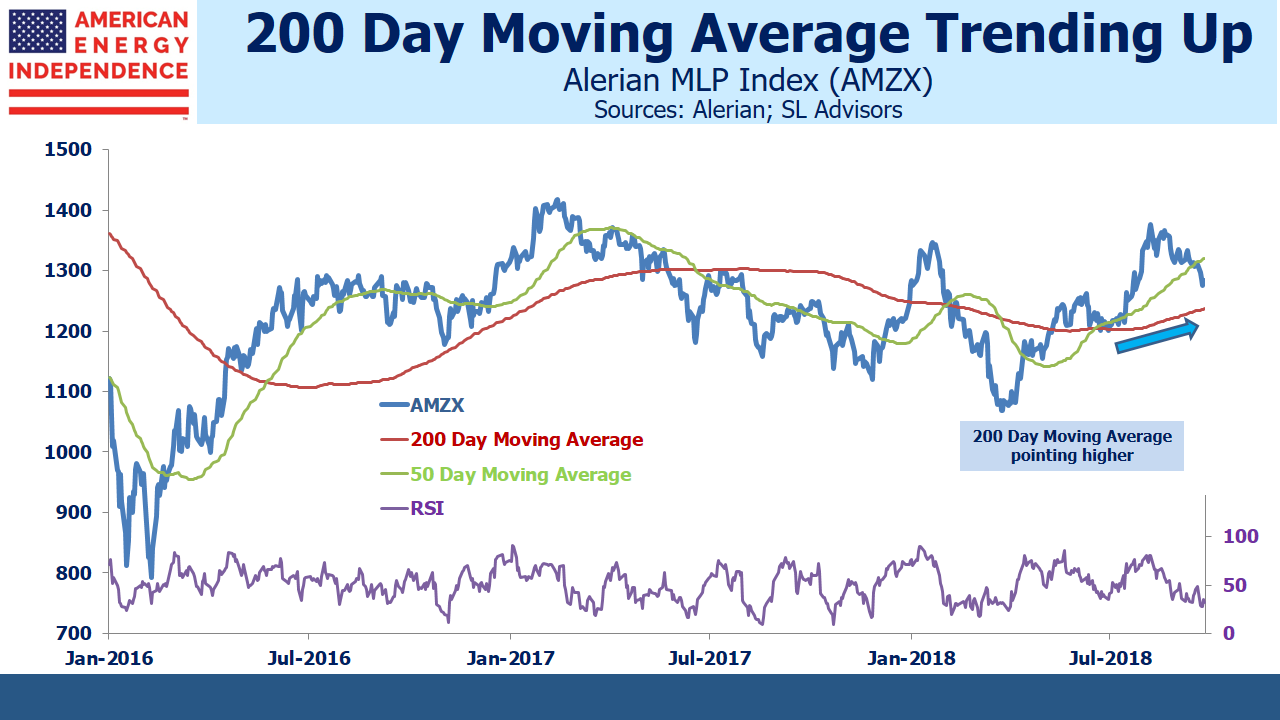
Further confirmation is provided by the clear upturn in the 200 day moving average.
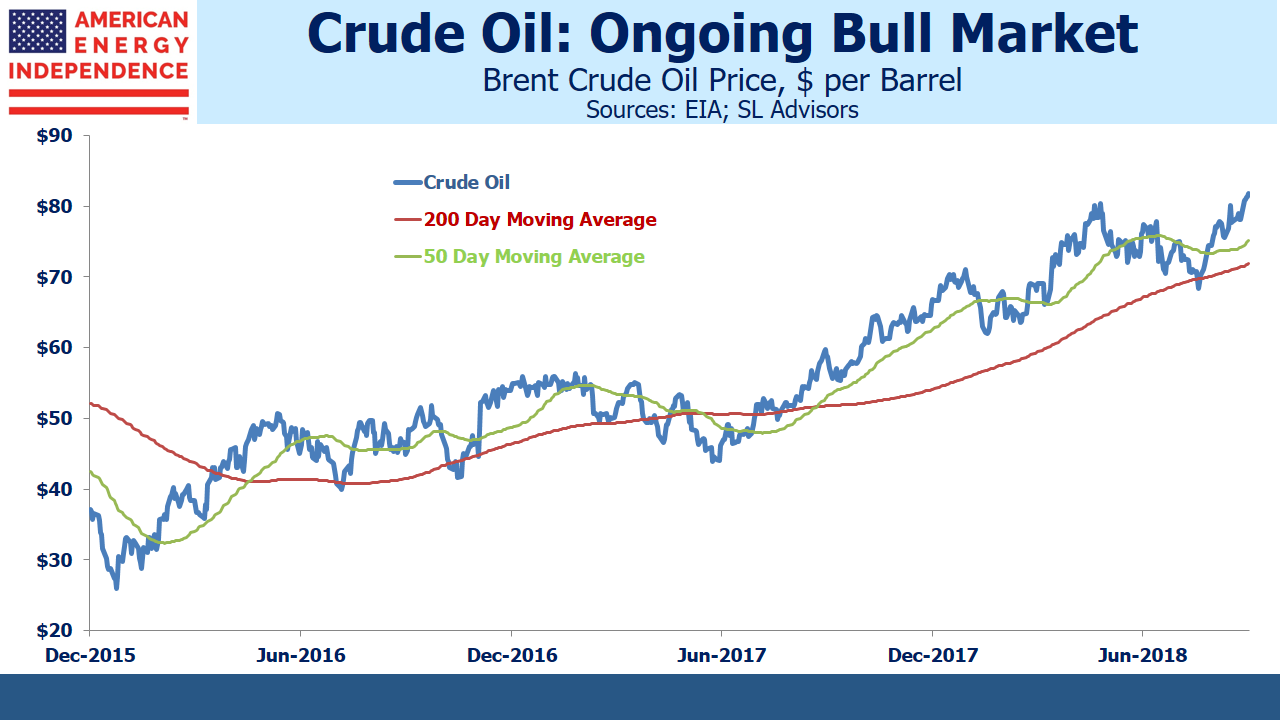
This all points to a sector in which medium term (i.e. 3-12 months) momentum is turning up, with the recent softness not that material over a longer perspective. Crude oil technical analysis shows a bull market many months old, adding to the frustration of investors in pipeline stocks who feel the two are only correlated on the downside.
Nonetheless, the sector has been weak. It might be in part because the Alerian MLP ETF (AMLP) has experienced steady outflows since June. Its shares outstanding have dropped by 8% in spite of the fact that 2Q18 earnings were generally good. Some of this is probably due to growing awareness of its flawed tax structure (see Uncle Sam Helps You Short AMLP) and shrinking pool of MLPs (see The Uncertain Future of MLP-Dedicated Funds). One reader on Seeking Alpha described it as “obsolete and tax inefficient”.
Oil and gas volumes continue to grow, which augurs well for the next earnings reports in October. Examples of infrastructure shortages abound. Natural gas at the Waha hub in west Texas trades at $0.82 per thousand cubic feet, a steep discount to the $3 Henry Hub benchmark because gas production exceeds pipeline capacity. Gas is being flared in the Permian basin.
Crude oil in Midland, TX trades at a $12 per barrel discount to Cushing, OK (the delivery point for CME futures). This similarly reflects a shortage of pipeline capacity, since tariffs on long term contracts are around $3-$5. The 2015 collapse was due to fears of pipeline overcapacity, so today’s bottlenecks ought to be positive.
Proposition 112 is the Colorado referendum question that would greatly impede future oil and gas development. Fear of it passing in November has weighed on affected stocks, such as Noble Midstream (NBLX) and Western Gas (WES). But there’s no indication that other states are considering similar moves, so its impact is limited to those with significant Colorado exposure.
We expect solid 3Q18 earnings, which will support 10% dividend growth across the sector. This might well provide the fundamental impetus needed for pipeline stocks to rally. When that happens, technical analysts can point to chart patterns that predicted it.
We are invested in Western Gas Equity Partners (General Partner of WES), and are short AMLP.


