Management Stumbles; Getting Less From Our Power Sources
Midstream earnings have been reported for the most part and generally came in at or close to expectations. Cheniere once again surprised to the upside, with 2Q EBITDA of $1.86BN versus market expectations of $1.62BN. They modestly increased full year guidance, carried out planned maintenance on their Sabine Pass facility on schedule and for the first time spent more cash repurchasing stock than on retiring debt.
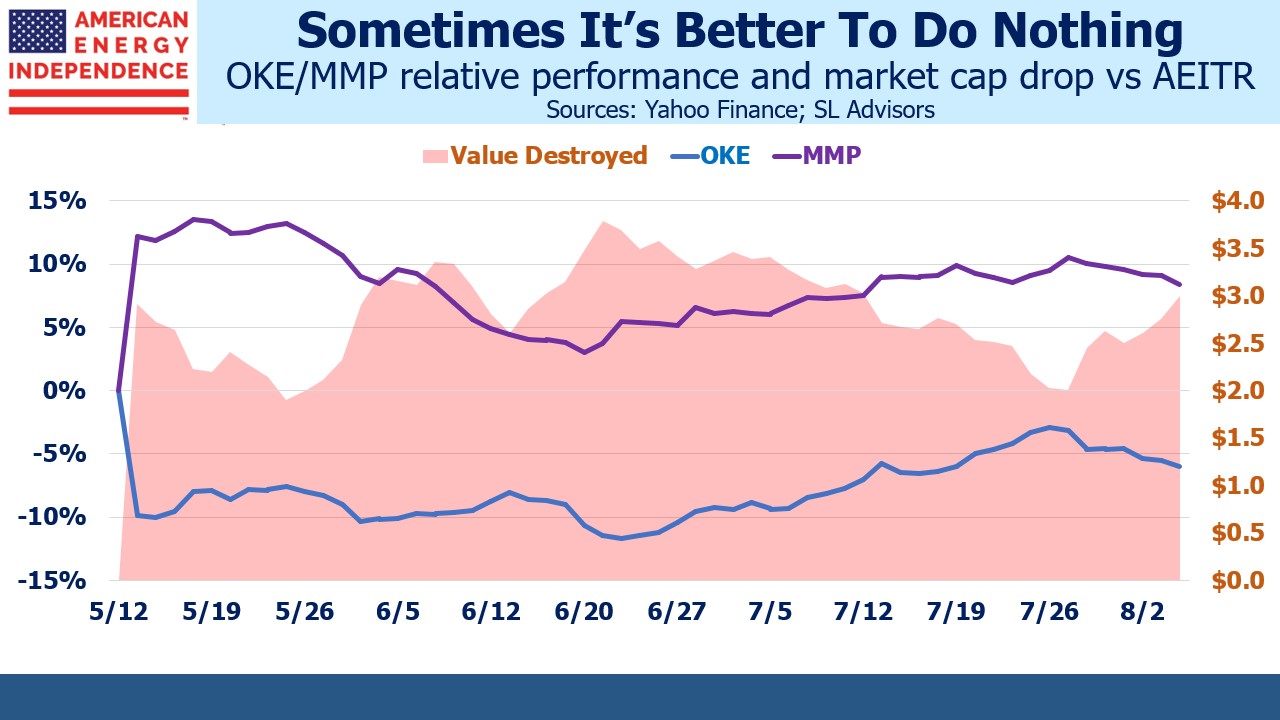
Magellan Midstream reported better than expected earnings and raised full year guidance at the same time as proxies were distributed to MMP and Oneok (OKE) investors to vote on the proposed merger. We estimate the market assigns “more likely than not” odds of shareholder approval. But it’s only a little over 50%, well short of the ringing endorsement both management teams would have liked.
We’re unhappy about the tax liability which should have been deferred at the investor’s option but will now become due this year if the deal closes (see Oneok Does A Deal Nobody Needs). We voted no twice – once for each company since we own both. We estimate that $3BN in equity value has been destroyed since the merger announcement. That’s derived from the aggregate market cap underperformance of both stocks versus the American Energy Independence Index (AEITR).
Canadian pipeline companies have long enjoyed a reputation for being conservatively run – at times reflecting poorly on their American peers. This was especially true five years ago when it seemed that the only management teams not pursuing growth at any price were north of the border (see Send in the Canadians! and Canadians Reward Their Energy Investors).
This year all three big Canadian firms (Enbridge, TC Energy and Pembina) have significantly lagged the sector. TC Energy (TRP) decided to unlock unrecognized value in their liquids business by announcing its spin-off. This announcement came a couple of days after they sold a minority interest in their Columbia Gas pipeline network to Global Infrastructure Partners at a lower multiple than many analysts had assumed it was worth. The expected 5X Debt:EBITDA leverage on the stand-alone liquids business raised eyebrows, and the market has even started to question the security of TRP’s dividend.
A yield approaching 8% reflects skepticism that TRP will manage its substantial growth capex program and execute needed asset sales flawlessly. We’ve maintained an underweight exposure for the last couple of years, and we’re not yet increasing.
A chart from the US Energy Information Administration’s (EIA) recent Short Term Energy Outlook (STEO) prompted us to examine capacity utilization by power source more carefully. Over the past decade the increase in electricity generation from natural gas power plants is greater than the additional output from solar and wind, although you’ll see few headlines on the topic.
Increases in solar and wind capacity draw attention. But because they’re weather-dependent and it’s not always sunny or windy, they generate power less frequently and unpredictably.
Among carbon-free sources of power, nuclear operates at by far the highest capacity utilization. It’s always on and represents important baseload where it’s used. Hydropower is seasonal, generally best in the spring when snowmelt swells our rivers. Solar is barely over 20%. Offshore windpower tends to be more productive than onshore, but is more expensive too.
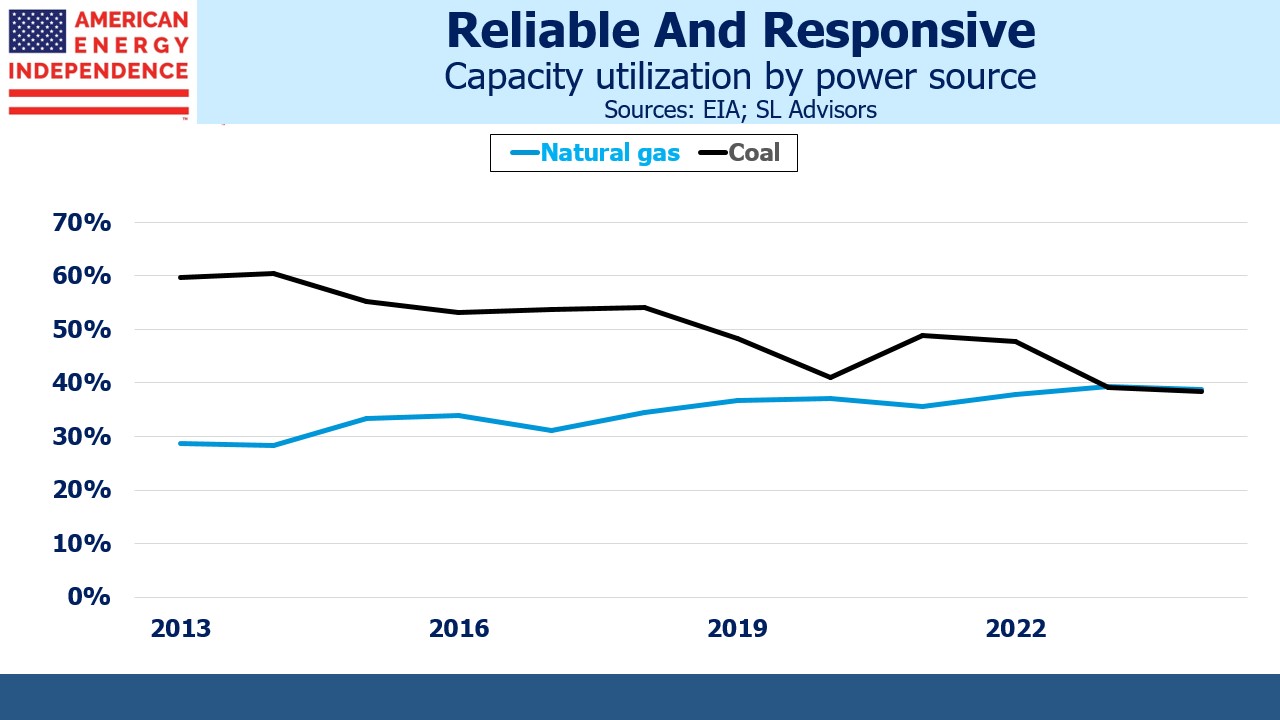
With dispatchable power, coal and natural gas are moving in opposite directions. Coal plants run less efficiently when their output is stopped and then restarted. Power generation from natural gas plants can be ramped up and down more easily. A decade ago coal provided 28% of our electricity compared with 15% today. Coal capacity hasn’t fallen as quickly, hence its reduced capacity utilization.
By contrast, the utilization of natural gas power plants has increased, in part because of their greater flexibility in altering their output up and down – either because extreme hot or cold weather raises demand, but also because increased renewables penetration has made flexible, on call power more valuable. Natural gas power plants are a natural complement to renewables, because they provide responsiveness and reliability, qualities not found in solar or wind.
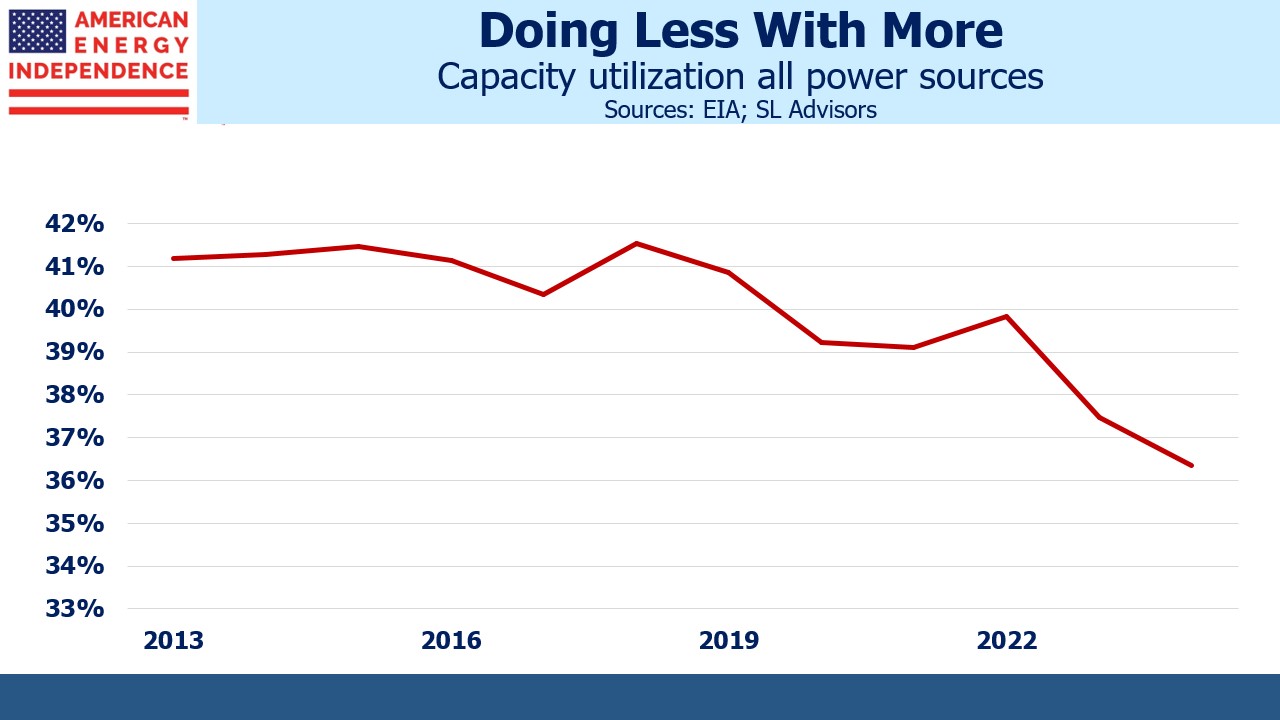
When you look across the entire US power grid, capacity utilization has fallen from 41% to 36% over the past decade. This is because we’re using more solar and wind. Poorly informed advocates for renewables promote their apparently low cost per unit of power capacity. Sometimes they implausibly criticize utilities for willfully avoiding the cheapest source of power generation. But as our falling capacity utilization shows, this is a flawed measure of the true cost. The cost of dispatchable power or battery back-up needs to be included. Power prices in America are going up as unreliable energy sources gain market share. This shouldn’t surprise anyone, and yet we’re far better off than Germany and some other EU members with their dysfunctional energy policies (see Germany Pays Dearly For Failed Energy Policy).
China emits the most greenhouse gases and these emissions continue to grow every year. So our climate will be set in Beijing, not Washington DC.
We have three funds that seek to profit from this environment:


