The Age of Oil

The Prize: The Epic Quest for Oil, Money and Power was first published 27 years ago, although Daniel Yergin added an Epilogue in 2008. It is nothing less than an economic and political history of crude oil. At 910 pages of text and footnotes it’s an epic read, but you can select sections of interest and jump around, leaving and returning to it later. The very beginnings of the U.S. oil business were about producing kerosene from “rock oil” to replace whale oil or turpentine used for light. Its illuminative qualities were deemed far superior to the alternatives and production took off in the early 1860s. The Civil War boosted demand and the oil business had begun. John D. Rockefeller became the richest man in America by selling kerosene.

.avia-image-container.av-86h56e-450b511371bfa158eaa716048e3e26be img.avia_image{ box-shadow:none; } .avia-image-container.av-86h56e-450b511371bfa158eaa716048e3e26be .av-image-caption-overlay-center{ color:#ffffff; }

During the early 1900s the internal combustion engine created a new market for gasoline, promoting oil in importance over coal as a source of primary energy and leading Daniel Yergin to dub the 20th Century “The Age of Oil”.

The 1973 Oil Shock is a distant memory for those of us old enough to have any first hand recollection. It’s therefore quite sobering to re-familiarize oneself with its history as recounted by Yergin in 1990 when its ramifications remained fresh. Iconic photos of cars lined up outside gas stations were a vivid reminder of modern society’s dependence on oil; they also exposed the western world’s sudden vulnerability to an adverse clash of politics and economics in a volatile region.

.avia-image-container.av-5oirdy-4aebf505bd3be562be108fc763b83972 img.avia_image{ box-shadow:none; } .avia-image-container.av-5oirdy-4aebf505bd3be562be108fc763b83972 .av-image-caption-overlay-center{ color:#ffffff; }

Reading about events some 44 years later, the ability of Arab oil producers to turn a spigot so as to influence U.S. policy decisions was outrageous, an affront. The history of how OPEC came to wield such power is well recounted by Yergin. From 1948-72, 70% of newly discovered proved oil reserves were located in the Middle East. This concentration of oil resources combined with western governments’ inattention to their increasing reliance on monarchs with whom their interests were not aligned created the conditions under which the Arab Oil Embargo was so effective.

Countries were placed on one of three lists (Friendly, Neutral or Unfriendly) depending on how closely their public policy statements pleased Arab oil suppliers, with deliveries modified commensurately. Europe produced very little oil and Japan virtually none. By contrast, U.S. production reached 9.5 Million Barrels per day (MMB/D) in 1973, coincidentally, a record we will soon eclipse.

Although America wasn’t self-sufficient, it wasn’t as reliant on OPEC as others. However, strong domestic demand had caused imports to almost triple over the prior six years, to 6 MMB/D, so energy independence was not a realistic objective. Over the prior quarter century the U.S. share of world production had fallen from 64% to 22% as Middle East nations ramped up their output from 1.1 MMB/D to 18.2 MMB/D.

The 1973 Arab Oil Embargo was a political and economic shock, and ever since the U.S. has paid close attention to the region. The 1990-91 Gulf War fought to eject Iran from Kuwait was arguably all about oil reserves, and the U.S. continues to maintain a large military presence in the area. Yergin’s book had the good fortune to be published in December 1990, just a month before the U.S. and its allies launched Desert Storm. There is an eight episode documentary accompanying Yergin’s book that can be found on Youtube. It was shown on PBS in 1992-93, a couple of years after the book’s publication, and provides interviews with many of the oil executives and government officials involved at that time. One U.S. oil CEO had expected public opinion to demand less reliance on imported energy following 1973, and the second oil shock in 1979 after the Iranian revolution. But diversity of supply lessened OPEC’s power, and the Gulf War showed that Middle Eastern oil reserves couldn’t be seized by an unfriendly power.

Nonetheless, I found that reliving those events through Yergin’s book and documentary provoked feelings of outrage, and a wish that we never again find ourselves so vulnerable to others.

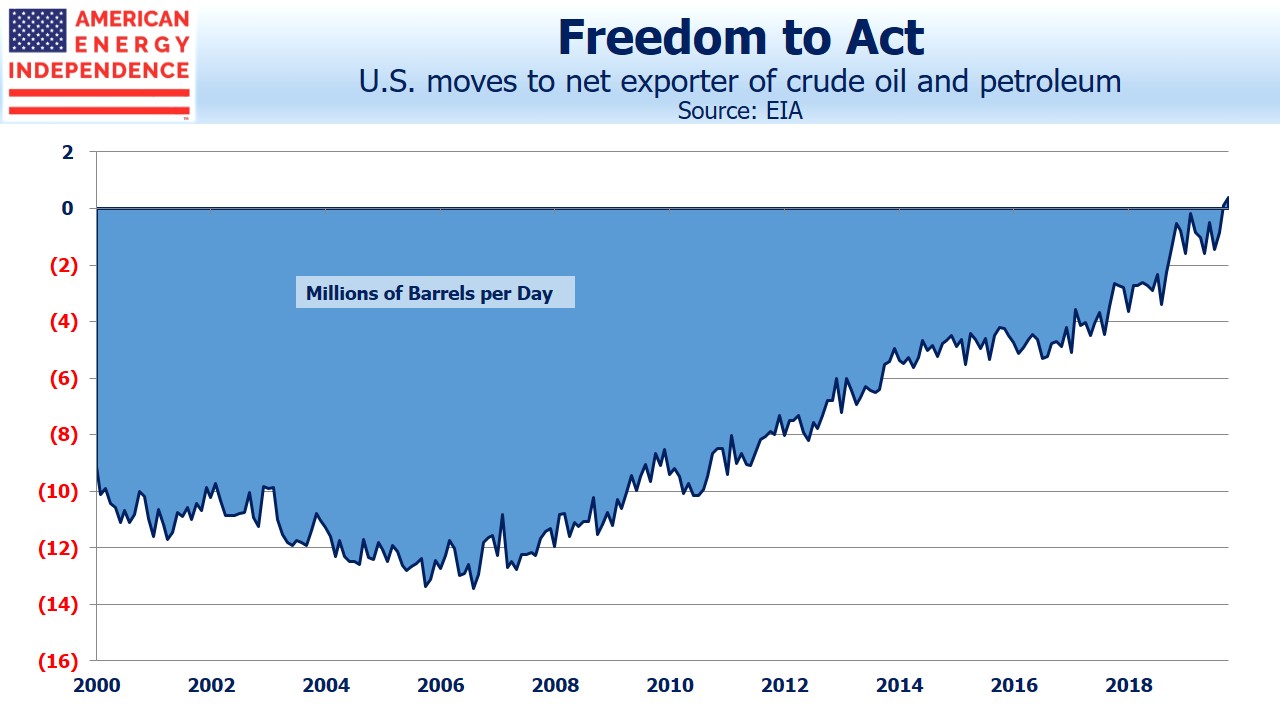
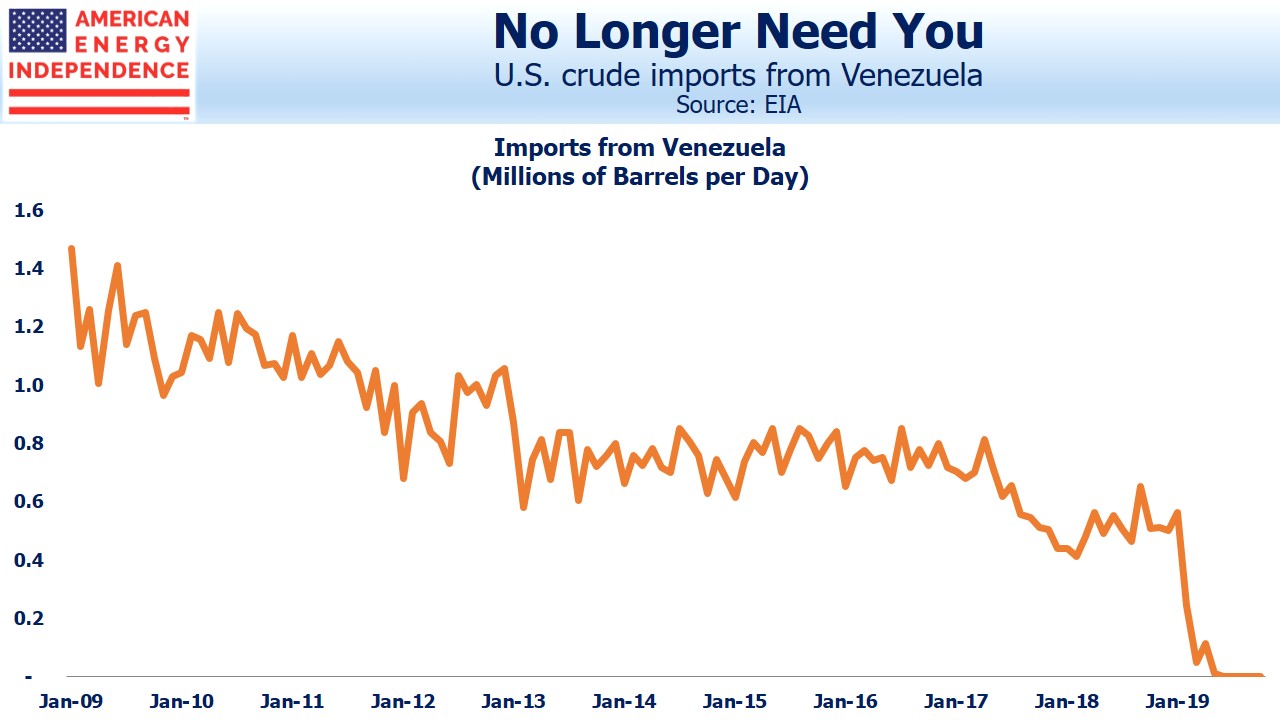
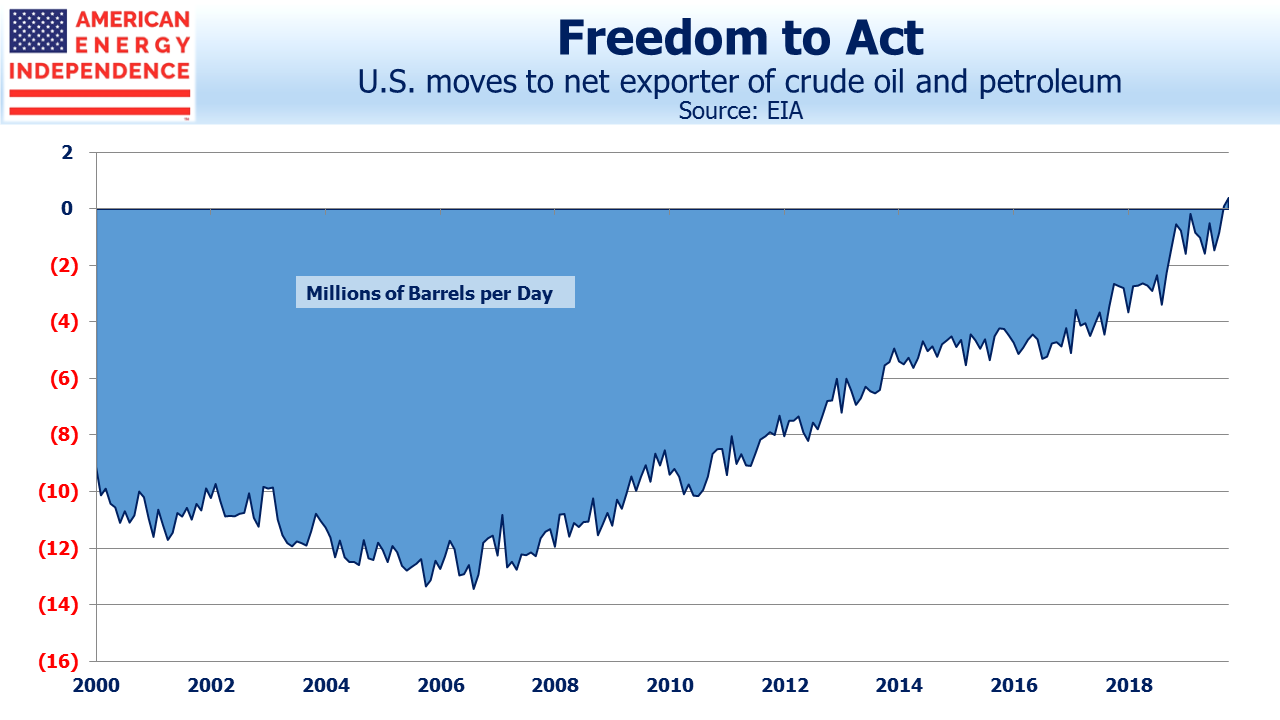
And guess what? American Energy Independence, for generations no more than an aspirational state, is clearly now in America’s future. It has multiple definitions – the Energy Information Agency (EIA) defines this as BTU independent, which means that we are a net exporter of energy in all its forms once they’re converted to their energy-equivalent, BTU content. The EIA’s Annual Energy Outlook 2017 projects that we shall achieve BTU-independence within the next decade. We recently achieved Natural Gas independence, as exports began exceeding imports over the past twelve months. Shipments of Liquified Natural Gas are set to rise substantially in coming years as new liquefaction plants become operational. We’ve long been a net exporter of coal.

.avia-image-container.av-3ux7ye-d9c909a9c93854989c669932f93c90df img.avia_image{ box-shadow:none; } .avia-image-container.av-3ux7ye-d9c909a9c93854989c669932f93c90df .av-image-caption-overlay-center{ color:#ffffff; }

Although BTU-independence is the most complete measure of our reliance on others for energy, most casual observers think simply in terms of oil independence, especially given the contemporary history recounted by Daniel Yergin. Photos of drivers sitting in gas lines remain an emotive image. The EIA makes a Reference Case forecast (its Base Case) but includes other less likely but still plausible scenarios. Their central expectation is for the U.S. to remain a net importer of petroleum products (defined as crude oil, refined products and natural gas liquids), albeit at a steadily diminishing rate, falling by two thirds within a decade.

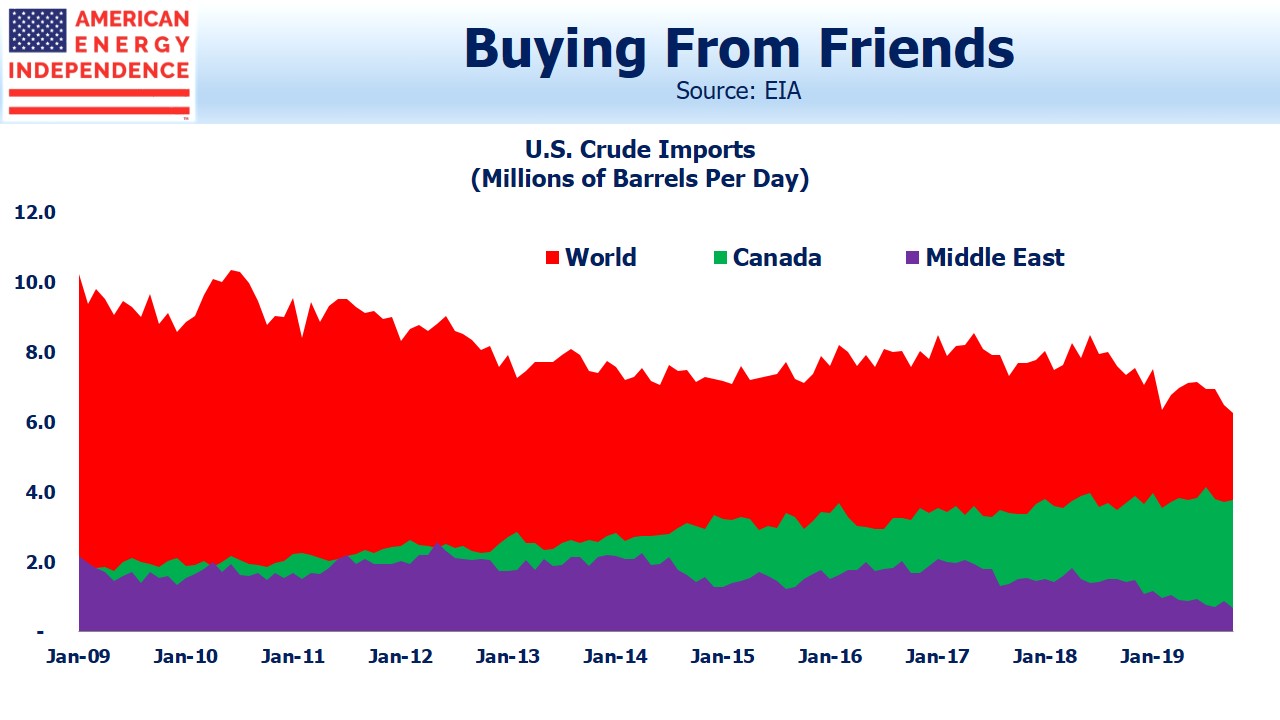
But if crude prices rise higher than they expect, or improvements in the technology driving shale oil and gas output surprise to the upside, the U.S. could become a substantial net exporter.  OPEC long ago lost its ability to call the shots and in recent years their inability to set prices has been amply demonstrated. This is the enormity of the Shale Revolution. Its impact is far more than simply economic, although in that respect it’s already substantial. Its geopolitical effects will continue to reverberate through different countries’ needs for energy security. U.S. policy in the Middle East will reflect a reduced reliance on the region’s major export, something Americans will overwhelmingly welcome.

.avia-image-container.av-10sti-67d5edac4ba70f007c9479ff52d52a12 img.avia_image{ box-shadow:none; } .avia-image-container.av-10sti-67d5edac4ba70f007c9479ff52d52a12 .av-image-caption-overlay-center{ color:#ffffff; }

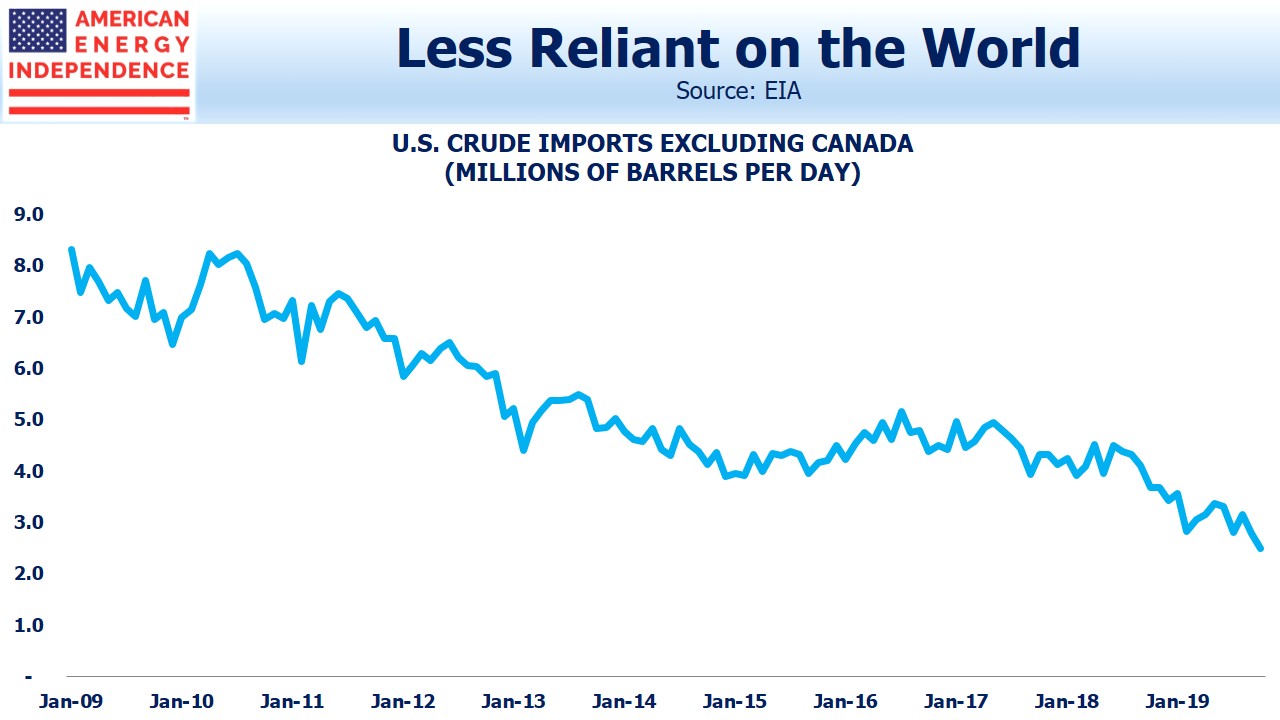
In a recent interview on the Shale Revolution, Yergin cited the sanctions imposed on Iran as an example of shifting energy power. He asserted that without the growth in U.S. oil production, the removal of Iranian oil supplies from the market would have been unworkable. Yergin has found that in discussions with foreign decision makers across Europe and Asia, there is a recognition that America’s role in the world is changing, in part because of improved security around energy supplies.

Today we’re seeing an alignment of resources, technology and public policy that together are bringing a seemingly Utopian vision closer to reality. Energy infrastructure is growing as it adapts to increased production that is supplying new markets. It may have taken half a century, but the dynamism of American capitalism is denying the ability of foreign despots or hostile governments to inflict substantial economic harm through manipulating energy exports.


Financial Discipline Among MLP Customers

Recent earnings reports suggest some moderation in the acceleration of U.S. shale drilling. The CEO of Schlumberger said that equity investors were propagating marginal activity by providing capital based on volumes rather than returns. The retiring Chairman of Halliburton, Dave Lesar, provided some wonderful quotes on his final investor call, including this assessment of the Shale Revolution:

“They are your classic American entrepreneurs, and their success should be recognized. In Silicon Valley, such a success would be greatly celebrated as another industry disruptor. The unconventional disruption is not widely celebrated beyond the energy space, but it should be. The development of US unconventional resources has been as disruptive to the global energy market as Amazon has been to Big Box Retailing or Uber to the taxi business… Made the US more energy independent, caused OPEC to react and changed the fundamental economics of offshore production.”

This is one of the reasons why America is Great.

Anadarko announced a $300MM (7%) reduction in their 2017 capex plan, noting that margins were too volatile to support their previously planned budget (some of this reduction was to non-shale, offshore projects). Halliburton’s Dave Lesar also noted a “tapping the brakes”, which the incoming CEO Jeff Miller clarified as, “going from 80 miles an hour to 70 miles an hour.” Other U.S. drillers including Hess and Sanchez similarly lowered capex. The anecdotal evidence of slower production growth supported crude prices last week, as did OPEC’s meeting in St. Petersburg at which Saudi Arabia pledged to unilaterally limit exports in a further effort to support prices.

The U.S. Energy Information Agency (EIA) publishes a monthly Drilling Productivity Report (DPR). It includes data on output and productivity from the larger shale plays across the country. Many observers including ourselves have commented on the dramatic improvements in productivity that have been taking place. It’s no exaggeration to say that advances in drilling techniques and use of improved technologies have been hugely important drivers behind the rise in U.S. production, in spite of falling prices.

However, part of the productivity improvements have been due to an increased focus on the most productive wells. U.S. producers adopted a defensive posture in 2015-16 as crude prices collapsed, and that included focusing their efforts on their best plays. Although there’s no doubt that actual productivity improved enormously, the figures are likely somewhat flattered by this focus on the best assets.

.avia-image-container.av-2aiedf-4c23df14d275d35c4a91ff34402a1d10 img.avia_image{ box-shadow:none; } .avia-image-container.av-2aiedf-4c23df14d275d35c4a91ff34402a1d10 .av-image-caption-overlay-center{ color:#ffffff; }

One measure of productivity is initial output per well (Initial Production Rate, or IPR), and in some plays (notably including the Permian), this statistic has been declining modestly for about a year. It’s still higher than at any time prior to 2016, and enhancements such as multi-well pad drilling, longer laterals and new fracking techniques have been critical to success. Output continues to grow even while initial production rates are flattening out. It’s a consequence of drillers moving beyond their most productive plays, best rigs and most skilled crews. While they played defense successfully, operating efficiencies were achieved and are being applied more broadly. Although crude oil production from shale plays is likely to keep growing in the current economic environment, the flattening of IPRs is a sign of limits on unconstrained growth. A study from MIT concluded that productivity gains were being overstated by insufficiently considering “sweet-spotting”, the tendency to focus on the best acreage.

Recent earnings reports as well as the IPR data noted above suggest that, while U.S. output will continue to grow, there are visible limits on that growth. Furthermore, after seeing annual declines in breakeven prices of 20% in 2015 and 29% in 2016, Rystad Energy forecasts breakevens are poised to rise 7% in 2017. Nonetheless, productivity remains high enough and costs low enough to gain market share, but perhaps not enough to further depress prices.


What Kinder Morgan Tells Us About MLPs

Kinder Morgan (KMI) reported earnings last week, including a long expected dividend hike and a pleasantly surprising stock buyback. In many ways the stock performance and corporate finance moves of KMI reflect the Master Limited Partnership (MLP) sector as a whole.

Pre-Shale Revolution, Kinder Morgan Partners (KMP) had rewarded investors with steady distribution growth and modest (for their size) investments in new projects. Their investor presentation included a slide labelled “Promises Made, Promises Kept” with a table showing these consistently higher payouts.

.avia-image-container.av-7n8ua3-3be274164a796953c9b8cee546909e86 img.avia_image{ box-shadow:none; } .avia-image-container.av-7n8ua3-3be274164a796953c9b8cee546909e86 .av-image-caption-overlay-center{ color:#ffffff; }

Not all companies make old investor presentations available on their website – since it allows users to compare statements across years, it can be embarrassing. To KMI’s credit, they do. Consequently, we’re able to delve back several years and recall the world MLPs used to inhabit. This was a time of attractive, stable distributions with modest growth and an occasional need for growth capital. The Shale Revolution was not widely regarded as the energy sector game changer it became. Wealthy U.S. investors tolerant of K-1s liked the mostly tax-deferred distributions. MLPs were an income-generating asset class.

KMP, which was at the time the main operating entity, noted that from 1997 to 2011 it had invested $24BN in new projects and acquisitions. As was the norm, most of that growth had been financed by issuing debt and equity, since KMP paid out most of its Distributable Cash Flow (DCF) in distributions. Over the next two and a half years as infrastructure demand grew, they invested $20BN in growth projects & acquisitions for a total of $44BN over 17 years. The chart below on the left includes $2.3B of organic capex budgeted for 2H14 to total 46.5B by YE2014.

.avia-image-container.av-iw8cb-f5e2164a347e5a65f5756637c8f542ec img.avia_image{ box-shadow:none; } .avia-image-container.av-iw8cb-f5e2164a347e5a65f5756637c8f542ec .av-image-caption-overlay-center{ color:#ffffff; }

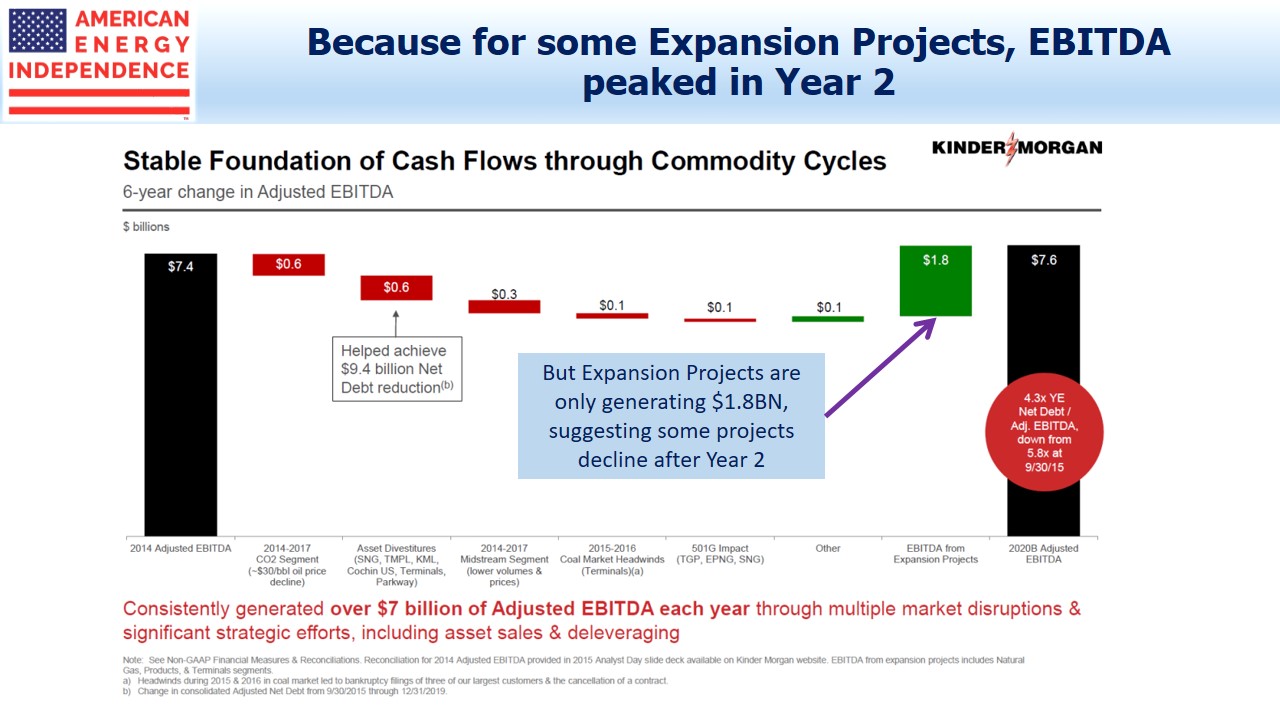
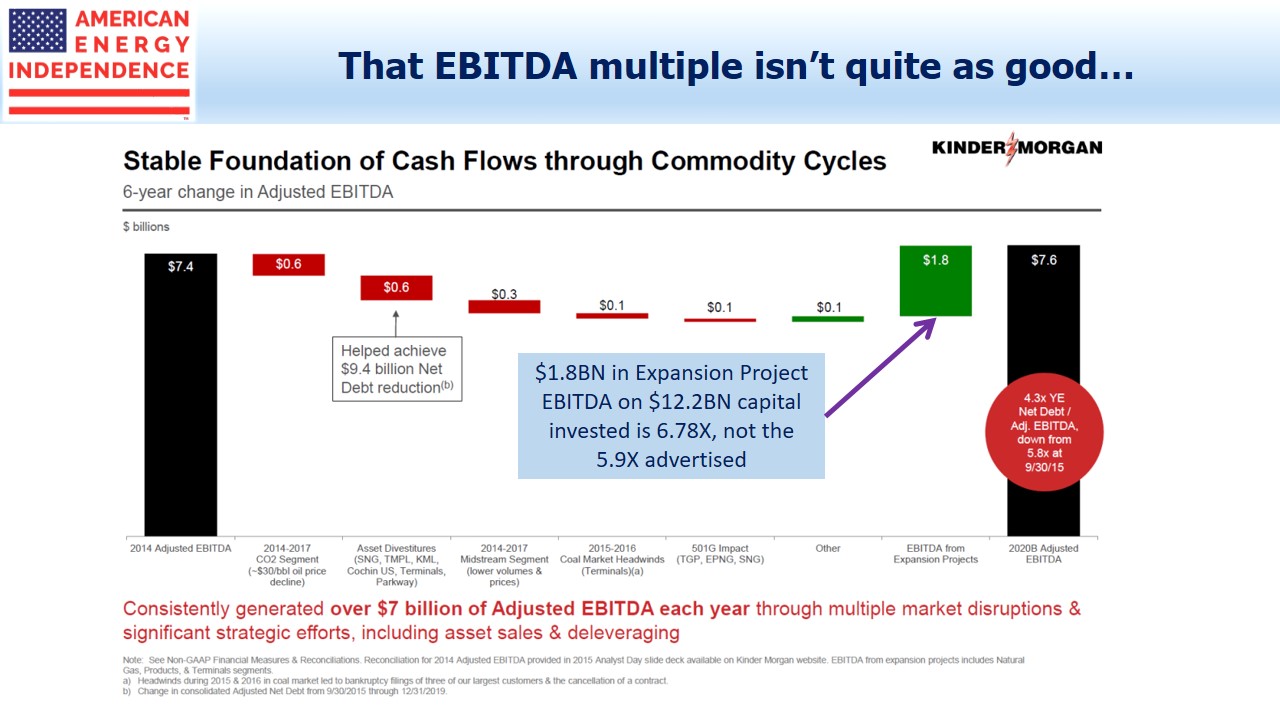
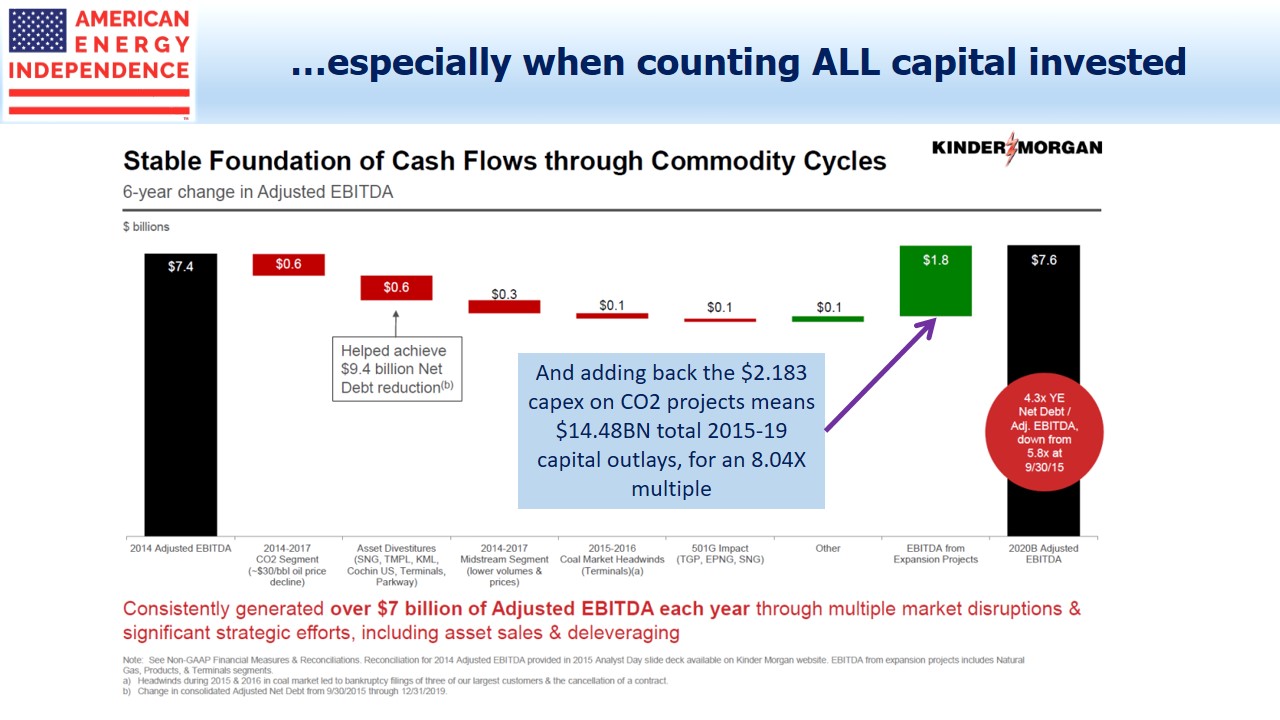
By mid 2014 KMI had concluded that the MLP investor base was too small to finance its growth. The 2014 presentation heralding the combination of KMI with KMP to create one integrated entity identified $17BN of organic growth projects over the next five years. Since 1997, $20BN of the $44BN had been invested in greenfield & expansion projects, with the balance being acquisitions. So the $17BN five year projected figure was analogous to the $20BN from the prior 17 years, since future acquisitions (the other source of growth) are generally very hard to forecast.

This is how the Shale Revolution manifested itself to big energy infrastructure companies. There was suddenly the need for lots more investment in attractive assets to meet new flows of hydrocarbons. But MLP investors weren’t big enough to provide the capital. KMI concluded this as the yield on their KMP units edged up, driven higher in order to attract the equity capital that their regular secondary offerings demanded. The 2014 KMI/KMP combination was intended to provide cheaper financing.

MLPs exist because of the tax code. Owning pipelines (or MLPs for that matter; see Some MLP Investors Get Taxed Twice) in a C-corp structure makes them taxable at the entity level, whereas MLPs largely don’t pay tax. But the universe of eligible MLP investors is limited to U.S. taxable K-1 tolerant investors, a small segment of all the global institutions who buy U.S. equities. As KMI found, if you need $Billions every year, MLP investors will start charging you more. Although folding KMP’s assets into KMI might have been expected to make them taxable, KMI’s clever advisers structured the deal to not be taxable for many years (see The Tax Story Behind Kinder Morgan’s Big Transaction). KMI could now fund its growth plans from the global equity market, not just MLP investors.

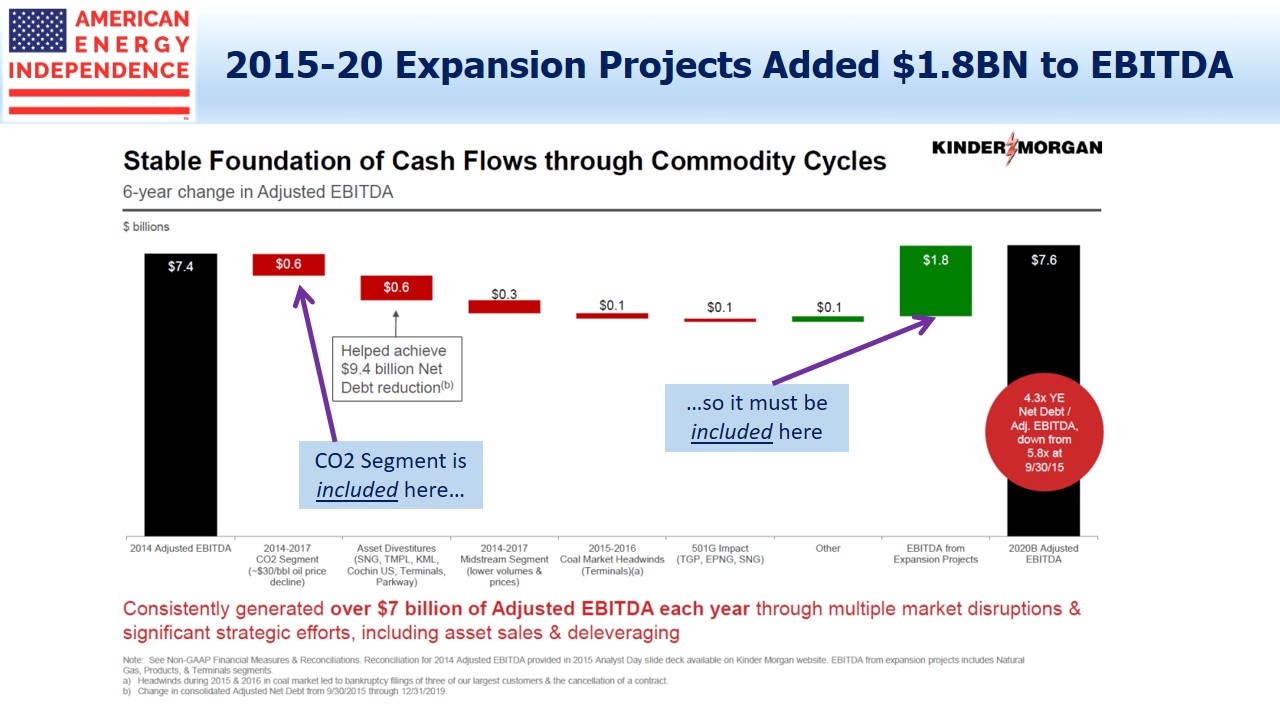
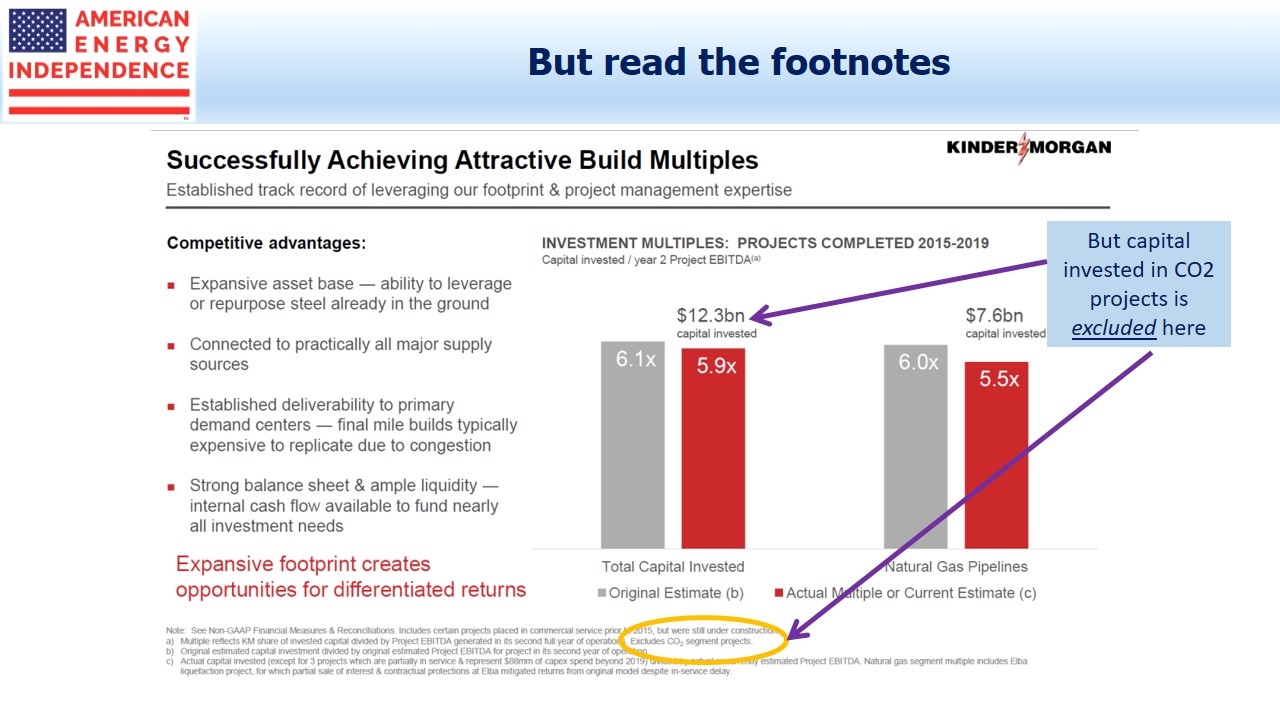
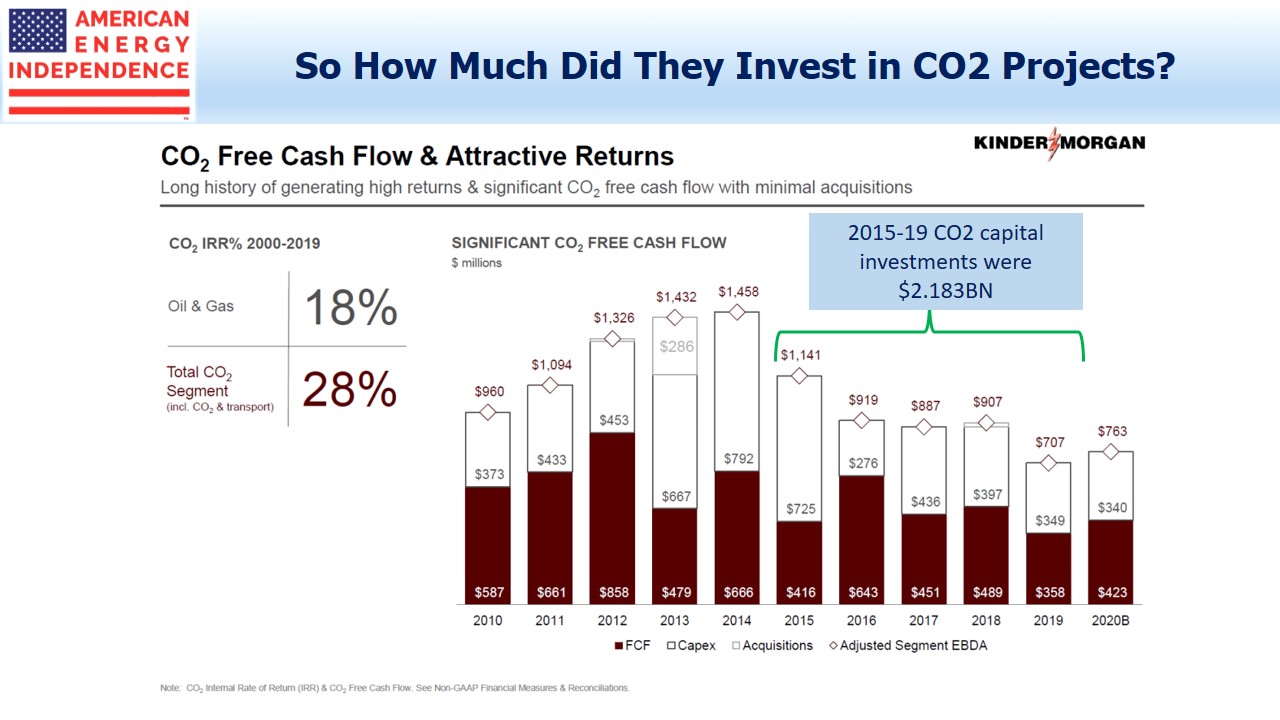
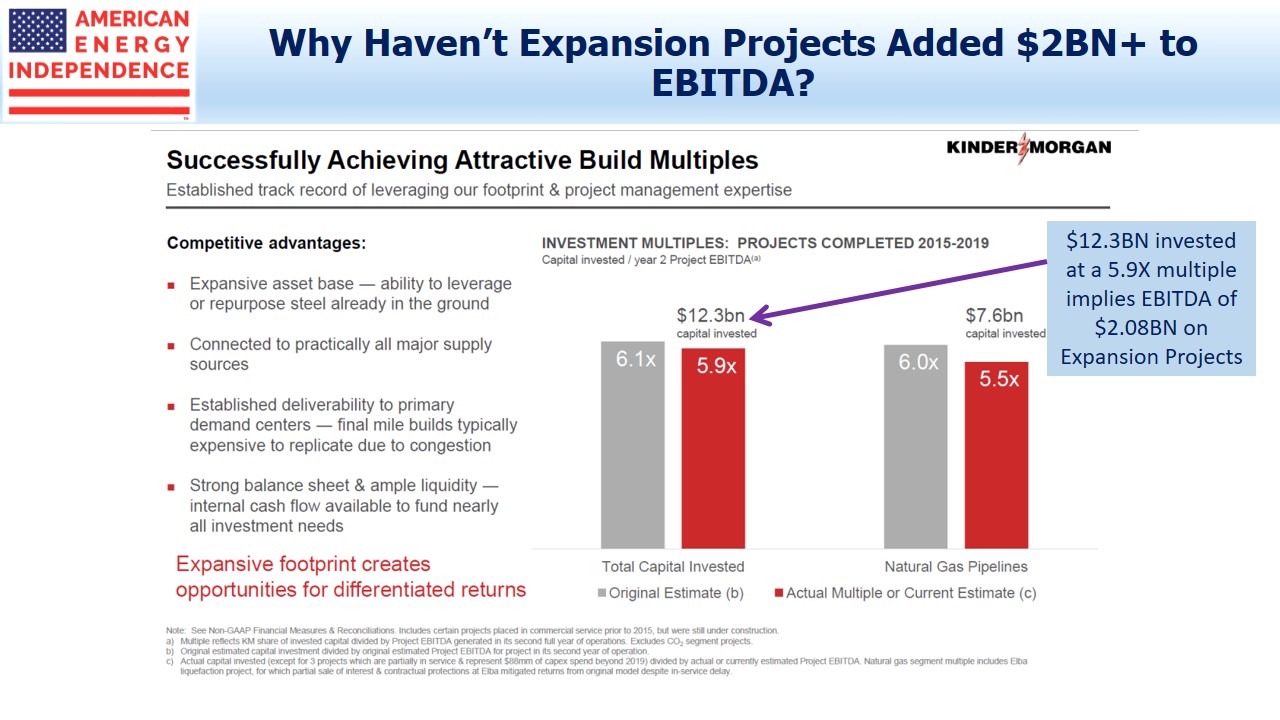
Their big mistake was to continue to think and act like an MLP. So they still planned to pay out most of their free cash flow in dividends, concurrently issuing new equity to get back most of it for growth. But corporations on average pay out a third of their profits in dividends, not 100%. Generating $4.5BN in DCF, paying $4BN in dividends and raising $2-3BN in equity looks a bit odd, albeit attractive to equity underwriters.  So the market priced KMI accordingly, driving up its yield. As it rose above 10% the idea of handing cash earned from existing assets out and getting it back to invest in new assets looked increasingly absurd, so they cut the distribution.

.avia-image-container.av-gihx7-01efae7d18abb1fa05877d67f6ded774 img.avia_image{ box-shadow:none; } .avia-image-container.av-gihx7-01efae7d18abb1fa05877d67f6ded774 .av-image-caption-overlay-center{ color:#ffffff; }

Notice that all of these issues were corporate finance ones. They all related to the liability side of KMI’s balance sheet. It was all about how best to finance future assets. The collapse in crude oil in 2015 affected KMI only modestly, because their cashflows are overwhelmingly from natural gas. Assets were mostly performing as expected, but their mis-steps were a combination of financing strategy and amount of growth. They certainly had the choice to cut their backlog of expansion projects, which would have lowered their need for new financing. But they chose as they did, and the 75% dividend cut created enough cash to eliminate the need for external funding. Had they opted for less growth they would have been able to maintain their original payout.

.avia-image-container.av-2c8c9n-e022a3a94b84a4e4b4f360e4aaa62a82 img.avia_image{ box-shadow:none; } .avia-image-container.av-2c8c9n-e022a3a94b84a4e4b4f360e4aaa62a82 .av-image-caption-overlay-center{ color:#ffffff; }

The growth backlog is declining as some projects (notably the $6BN North East Direct project, which was to improve natural gas distribution in New England) were cancelled and others completed. The excess cash is being used to reduce debt and starting in 2018 will be returned through higher dividends and a buyback. Other big MLPs merged their GP and MLP like KMI, reduced growth plans or did both. Leverage rose because new assets are built and financed before they generate EBITDA. As those projects are put into service, leverage is coming down.

Price history will show that KMI and the MLP sector endured a terrible operating environment during the 2015 crash in crude oil. Most investors even today regard the worst bear market in the sector’s history (see The 2015 MLP Crash; Why and What’s Next) as an oil-induced fall in operating results. The reality for KMI was that growth plans driven by the Shale Revolution exceeded the financing capacity of a specialized investor base. This is pretty much the case for midstream in general. It’s not obvious from a price chart, but if you followed developments real time it’s the real story.

We are invested in KMI


Oil Forecasters Have to Work Harder

Those in the oil industry who take a long view increasingly worry about insufficient new supply. It’s hardly today’s problem, with crude oil back to the mid $40s as OPEC’s production cuts are offset by increased shale output. But depletion of existing fields is generally believed to take 3-4 Million Barrels a day (MMB/D) off the market every year and demand continues to increase by 1-1.5 MMB/D annually. As a result, 4-5MMB/D of new supply is required annually to balance the market. Global production is currently around 97 MMB/D.

Last week Amin Nasser, chairman of Saudi Aramco, noted that the 20 MMB/D of new production thus needed over the next five years is unlikely to be forthcoming from U.S. shale, or indeed anywhere else. The International Energy Agency (IEA) offered a similar outlook.

The short-cycle nature of shale is likely impeding new development. In the past, the supply response function of crude was quite slow in reacting to demand changes, which contributed to some extreme price volatility. Since bottoming 18 months ago crude has been more stable. The ability of shale producers to alter production in just a few weeks or months is contributing. It also means that backers of a new, conventional project have to consider the impact on their returns from a repeat of the 2015 oil collapse, since much of the U.S. shale industry was able to protect itself by reducing output.

In the competition between short-cycle and long-cycle, the former’s flexibility represents a significant advantage. It means some projects that might ultimately turn out to be profitable aren’t getting approved.

This is one of the reasons that JBC Energy forecasts an extra 1MMB/D of shale oil output by the end of next year. This would take overall U.S. crude output over 10 MMB/D, to around the same level as Saudi Arabia.

The U.S. Energy Information Administration (EIA), agrees, recently projecting 9.9 MMB/D of average output next year which would correspond with JBC Energy’s 10 MMB/D 2018 exit rate. This will be the highest annual average production in U.S. history, surpassing the previous record of 9.6 MMB/D set in 1970. It’s worth noting that one year ago the EIA was forecasting a decline of 0.4 MMB/D to 8.2 MMB/D for 2017 production, while they’re now projecting a 0.6 MMB/D increase to 9.3 MMB/D. The size of the 1 MMB/D revision over twelve months reflects the dramatic improvements in productivity across the industry (and maybe, ahem, poor forecasting).

.avia-image-container.av-326u87-6b49b561a84d89ec12898b5cc133ec08 img.avia_image{ box-shadow:none; } .avia-image-container.av-326u87-6b49b561a84d89ec12898b5cc133ec08 .av-image-caption-overlay-center{ color:#ffffff; }

A recent example is Devon Energy’s record breaking well drilled in Oklahoma which produced 6,000 barrels a day equivalent of oil and gas during its first 24 hours of operation.

U.S. shale output is set to grow and is becoming the swing producer, quickly responding to price signals and as a result keeping oil prices in a fairly narrow range. Prices may be lower than producers globally would like, but they’re high enough to stimulate increased domestic production, which is what the owners of midstream infrastructure care about. Impressive as these gains are, they’re not going to meet the supply shortfall that Saudi Aramco’s Nasser and others see on the horizon. But it’s hard to see how that problem can be anything but good for the U.S. and MLPs.


In the Sweet Spot of Economics and Public Policy

The shift from natural gas importer to exporter has occurred in the U.S. over a remarkably short period of time. We’ve periodically written about this (see U.S. Natural Gas Exports Taking Off and The Global Trade in Natural Gas). Only a few years ago Cheniere Energy (LNG) was investing in facilities to import Liquified Natural Gas (LNG), anticipating that the U.S. would need to rely on foreign suppliers such as Australia and Qatar. The Shale Revolution changed all that, and the conversion of planned regasification plants to liquefaction began.

The story of how this shift occurred is only complete when the role of Cheniere’s founder Charif Souki is included. Greg Zuckerman’s wonderfully absorbing 2013 book, The Frackers paints colorful portraits of several key protagonists, and Souki is among them.

A Lebanese immigrant to the U.S., Souki’s early career was with a small U.S. investment bank where he raised  money for deals in the Middle East, relying initially on his father’s contacts in the region. He was quite successful but eventually became tired of the deal making and travel. For several years he and his family lived in Aspen where he ran a restaurant. The relaxed lifestyle was a welcome change, and he enjoyed the regular visits of stars such as Jack Nicholson and Michael Douglas. However, the restaurant business wasn’t lucrative and eventually with his savings low he decided to shift directions again.

.avia-image-container.av-moc0d-0aec3357cfa9c6219d62abf3bd9441b2 img.avia_image{ box-shadow:none; } .avia-image-container.av-moc0d-0aec3357cfa9c6219d62abf3bd9441b2 .av-image-caption-overlay-center{ color:#ffffff; }

Given this background, Charif Souki was an unlikely energy pioneer. However, he applied his deal-making skills to the energy business and eventually wound up running tiny E&P company Cheniere Energy. The best part of the coverage of Souki in The Frackers describes how he convinced other investors to back him in developing LNG import facilities, only to subsequently have to raise more capital to convert them for export. It must have taken all his sales and deal-making skills to follow up one compelling vision with another, but he did.

Having brought Cheniere to the point at which it could start exports, Souki was forced out of the company by Carl Icahn. Souki’s substantial risk appetite had eventually paid off, but by then his shareholders were looking for rather less excitement. With $BNs in capital invested and contracts lasting 20+ years, the owners were looking for steady, reliable progress to realizing promised returns. Charif Souki was not that type of corporate leader.

I was reminded of all this the other day when perusing company presentations from a recent Energy Information Administration (EIA) conference. This year U.S. LNG exports at times have exceeded imports, driven in no small part by Cheniere. EIA projections through 2040 show the U.S. quickly becoming a substantial exporter.

.avia-image-container.av-4filot-d6b5df36e5b6a8beb6f1191f6467d2f9 img.avia_image{ box-shadow:none; } .avia-image-container.av-4filot-d6b5df36e5b6a8beb6f1191f6467d2f9 .av-image-caption-overlay-center{ color:#ffffff; }

Much of the shift to U.S. exports is well known to those who follow the industry closely. What’s less appreciated is how Cheniere is aligning itself with Federal policy. The President clearly likes to promote America when he travels, and be associated with deals. On his recent trip to Poland he was pushing LNG exports. There’s no doubting the energy security benefits across Europe from diversifying their supplies of natural gas so as to be less reliant on Gazprom. Energy exports and armaments will be part of the dialogue in virtually every Presidential trip abroad, as U.S. foreign policy promotes buying energy from a stable democracy and (for NATO members) spending more on their own defense.

.avia-image-container.av-36xg71-e08a6a8fa8d32eab5e63d08bf98092c0 img.avia_image{ box-shadow:none; } .avia-image-container.av-36xg71-e08a6a8fa8d32eab5e63d08bf98092c0 .av-image-caption-overlay-center{ color:#ffffff; }

But Cheniere also understands the importance of domestic politics, as this slide shows. What could resonate more effectively with the White House than exporting domestically produced energy security around the world? Cheniere isn’t the only company to understand that they’re in the sweet spot of alignment between corporate profitability and public policy objectives.

We are invested in Cheniere Energy (LNG)


Falling Dominoes

“Rusty” Braziel runs RBN Energy, a firm that provides very useful research on production trends in U.S. hydrocarbons. Their website maintains a regular blog and also offers deeper analysis on specific topics. They reach over 20,000 industry executives, and we find many useful insights in their work.

.avia-image-container.av-6bvdn9-5ddcb3087a09528b464300ab4cd3a032 img.avia_image{ box-shadow:none; } .avia-image-container.av-6bvdn9-5ddcb3087a09528b464300ab4cd3a032 .av-image-caption-overlay-center{ color:#ffffff; }

The Domino Effect: How the Shale Revolution is Transforming Energy Markets, Industries and Economics was published early last year, coincidentally just a few weeks prior to the low in the energy sector’s bear market that was largely due to U.S. hydrocarbon output. Like his blog posts, Rusty’s book is well researched and highly engaging. He describes events as dominoes falling against one another in a seemingly inevitable sequence. The first domino was caused by improvements in technology that drove significantly enhanced returns from shale-sourced natural gas production. The consequent abundance drove the price of natural gas lower, inducing Exploration and Production (E&P) companies to switch to more profitable Natural Gas Liquids (NGLs), which were often found with or nearby “dry” natural gas. Lower prices followed for NGLs, and activity then shifted to crude oil. The resulting increase in U.S. production drew the world’s attention to the Shale Revolution as crude slumped in 2014-15.

The dominoes continued, creating a resurgence in U.S. petrochemical investments funded by cheap inputs such as ethane, an NGL. Liquefied Natural Gas (LNG) import facilities were converted to export, since U.S. natural gas prices fell to among the lowest in the world. The book’s explanation of events as inevitably linked provides a compelling framework with which to examine huge shifts in world energy markets.

There is some interesting history; in 1942 the success of German U-boats at sinking oil tankers traveling from the Gulf Coast to New York harbor prompted the rapid construction of pipelines from Texas up to Philadelphia and New York. One of those pipelines, dubbed “Big Inch” because of its 24 inch diameter (double the diameter of the largest to date), was converted from a crude line after the war to carry natural gas. Today it is the TETCO pipeline operated by Enbridge (ENB). Another, smaller pipeline from the same era named Little Big Inch carried refined products. It’s now the Products Pipeline System (formerly known as TEPPCO) and is run by Enterprise Products Partners (EPD). These represent compelling examples of the longevity of pipelines, showing that properly maintained infrastructure that’s still in demand can steadily appreciate in spite of GAAP accounting that allows for depreciation.

Pipeline operators handle the differing quality of crude oil and mixed NGLs from their many customers by operating a “quality bank”. This values the difference between what a specific customer puts into the pipeline versus the “common stream” of mixed products, creating offsetting debits and credits that allow more efficient utilization. Because natural gas pipelines typically require a fairly pure input with limited impurities, these operate differently. The homogeneity of natural gas makes it fungible, allowing a shipper to put produced gas into a network and receive immediate credit for it at the other end without waiting for the actual molecules to travel the distance.

A handy comparison of the different volumes of natural gas and crude oil consumed in America every day calculates how many times they would fill the Empire State Building. Natural gas (in the gaseous state in which it’s typically moved) would fill that space 1,917 times, compared with only 2.4 times for crude. We often write that energy infrastructure is primarily a natural gas business.

We have written about the Rockies Express (REX) gas pipeline now owned by Tallgrass Energy Partners (TEP; see Tallgrass Energy is the Right Kind of MLP). The Domino Effect recounts the original construction of REX by Kinder Morgan (KMI), completed in 2009, as it moved natural gas from the Rocky Mountains to the gas-starved (as it was then) northeastern U.S. One of many consequences of the Shale Revolution has been TEP’s successful reversal of REX to supply Midwestern customers with natural gas from Pennsylvania and Ohio. Pipelines typically resolve regional price differentials caused by relative abundance and scarcity. Prior to REX, Rockies natural gas languished as low as $0.05 per thousand cubic feet (MCF) before leaping to $9 in 2009 when connected to other markets.

Coming after the book’s publication but consistent with the domino theme, OPEC conceded the inevitability of continued U.S. crude production late last year when they agreed on production cuts (see OPEC Blinks). Recent developments appear increasingly inevitable as presented by Rusty, and he provides a solid foundation for those who believe that the cheap, secure resources unlocked by American know-how are unambiguously good.

.avia-image-container.av-hssk5-9517cb144d042f33c4f8fd3b6d38980c img.avia_image{ box-shadow:none; } .avia-image-container.av-hssk5-9517cb144d042f33c4f8fd3b6d38980c .av-image-caption-overlay-center{ color:#ffffff; }

This interpretation of recent history combines easily with very useful explanations of how hydrocarbons are extracted, moved and refined. Readers get the macro analysis along with an understanding of the basics of drilling. One helpful picture (see above) reveals the main difference between a conventional well and a shale one. Hydrocarbons originate in porous rock, and have historically been extracted where they migrate underground to an open subterranean cavity where a vertical drill can reach them. The Shale Revolution taps directly into the original porous rock, allowing access to reserves that were previously known but inaccessible. Moreover, certain formations such as the Permian consist of multiple layers, allowing pad drilling with multiple wells which has led to dramatic improvements in efficiency.

The final three chapters look ahead to the geopolitical implications of the Shale Revolution. America is the clear winner. The most obvious losers are the members of OPEC, whose oil revenues are destined to be substantially lower even while they also cede market share through reduced exports to North America. It’s quite possible that the U.S. will be less engaged in the Middle East as our energy reliance subsides, a development that most Americans will cheer.

Europe stands to benefit from U.S. LNG exports which will reduce reliance on Russia, where pipeline maintenance is synchronized with political objectives. But the U.S. petrochemical industry is likely to benefit at Europe’s expense from cheap, local NGL feedstocks. The decline in European oil production will probably accelerate. Crude oil and natural gas get the headlines, but NGLs are an under-appreciated success story too. For example, exports of propane (what fuels your barbecue) have jumped well over tenfold since 2010.

.avia-image-container.av-2tn9ol-0a03fabd9dfb7a6fc2532dd5f035aa3c img.avia_image{ box-shadow:none; } .avia-image-container.av-2tn9ol-0a03fabd9dfb7a6fc2532dd5f035aa3c .av-image-caption-overlay-center{ color:#ffffff; }

Russia will increasingly find the U.S. is a competitor in energy markets, exposing that country’s relatively undiversified economy (60% of Russian exports are oil and gas).

A minor quibble is Rusty’s assertion that America invented representative democracy (“another global revolution”) around 240 years ago. This overlooks the Greek origin of the word as well as that history didn’t start in 1776. But we’ll forgive the Texan hyperbole because there’s so much else in the book that’s worth reading for anybody interested in the Shale Revolution.

We are invested in ENB, EPD and Tallgrass Energy GP (TEGP, the GP of TEP)


Political and Energy Independence

As we all take a break to celebrate America’s political Independence, it’s worth contemplating how Energy Independence has become attainably within sight over only the past couple of years. In 2015 oil production and energy sector prices were falling as many worried OPEC would bankrupt large swathes of domestic production. In October 2016 the pain of lower prices became too much (see OPEC Blinks). They abandoned their strategy of low prices in favor of production cuts, and altered the future of the U.S. energy sector.

It reminds of past titanic struggles; the 1940 Battle of Britain, when the German Luftwaffe gave up trying to destroy the RAF’s airfields because of persistent aircraft losses. Or even the end of the Cold War when America’s economic might supported military spending beyond the capability of the Soviet Union to keep up, leading to its collapse. Capitalism, technological excellence, relentless productivity improvements and a drive to win are all American strengths that were tested by OPEC and found more than up to the challenge. There may not have been a ticker tape parade down Broadway to mark the victory, but it will turn out to be as consequential for America as some past military exploits. We have much to celebrate, and add the Shale Revolution to that list.

MLPs performed unusually well last week. Our volume of nervous incoming calls peaked with the incidence of bearish crude oil comments in the media. The chart below shows sentiment visually reaching an extreme. No amount of typing by this blogger can shake the solid relationship between crude oil and energy infrastructure. It may be a volume driven, gas-focused industry, but holders of AMLP often think like oil traders which becomes self-fulfilling. Consequently, an over-abundance of bearish stories predictably caused a recovery. MLPs didn’t dissociate from crude, they rebounded with it.

.avia-image-container.av-2y9t1f-c82d9e9c77af681005ba62c046068972 img.avia_image{ box-shadow:none; } .avia-image-container.av-2y9t1f-c82d9e9c77af681005ba62c046068972 .av-image-caption-overlay-center{ color:#ffffff; }

We naturally watch crude movements closely since some client discussions involve tactical thinking, but there were other sources of research and news that were more interesting last week.

John Mauldin’s widely read blog Outside the Box featured an interesting piece on the geopolitical consequence of American energy independence (see Shale Oil: Another Layer of US Power). It includes some startling estimates, such as that the U.S. now has the world’s largest recoverable oil reserves (Rystad Energy), or that 60 percent of all crude reserves that are economically viable at $60 per barrel or less are located in U.S. shale reserves (Wood Mackenzie). Acknowledging the substantial improvements in productivity, the blog notes, “A shale oil driller in the United States, moreover, doesn’t need to be more profitable than Saudi Arabia to drill new wells; the driller just needs to fetch a sufficient return on invested capital. When prices are low, drillers simply forgo exploration and concentrate on the completed wells that produce enough oil to justify their existence.” This last point refers to “short-cycle” projects, which are the essence of shale production. Capital invested is returned within several quarters with output hedged. There’s less focus on Exploration and more on Production.

Saudi Arabia and Russia both require oil prices at least $25 per barrel higher to balance their budgets. It’s unclear how this Math will resolve itself, but it’s likely to highlight America’s strengthening energy position, through higher prices or the benefits of energy security.

Goldman Sachs also produced some thoughtful research. They expect shale production to continue increasing over the next decade before peaking in the late 2020s. They note the benefits of mergers between Exploration and Production (E&P) companies with adjacent fields as such combinations allow for longer laterals that straddle previous separately owned acreage. EQT’s recent acquisition of Rice Energy is an example. There is increasing use of Machine Learning and Artificial Intelligence to optimize drilling techniques. Many private companies unheard of outside the energy industry provide vital services relying on new technology. Biota, a biotechnology start-up founded in 2013, applies DNA sequencing to microbes in the earth’s subsurface. The analysis helps identify sweet spots for drilling. Welldog supplies a fiber optic down-hole monitoring system. Spitfire provides software tools for faster data analysis. EOG has been collecting real time data on every rig and well they control so as to make it available to decision makers in the field. Public policy is solidly behind Energy Independence. On Thursday, the President said, “The golden era of American energy is now underway.”

These are some of the reasons that in Shale, America is the only game in town.

Enjoy Independence Day weekend.


MLPs: This Time Is Different

It’ll be no surprise to MLP investors that the correlation of our asset class with crude oil has been rising. Falling crude in 2015 led MLPs to drop 58.2% from high to low, a figure we won’t soon forget. That same institutional memory among investors is imposing a similar relationship today. Last time, lower oil led to lower U.S. production, posing challenges for midstream infrastructure businesses with surplus capacity. This time, higher U.S. production is leading to lower crude prices. In This Time Is Different, Reinhart and Rogoff take readers through the many financial disasters that befell investors who thought it was different. And yet, with due deference to the aforementioned luminaries, we think it is.

Last week we received more questions than usual from investors reviewing the mark-to-market damage inflicted by their MLP allocations. One investor noted that MLPs were responsible for fully all of the YTD losses in one model portfolio they run. If you’re wondering whether the relentless sellers possess an insight you’re missing, you have plenty of company. Higher production of hydrocarbons in the U.S. is bad for lots of players including OPEC, but it’s hard to fathom why it’s bad for the domestic infrastructure that supports the Shale Revolution. American shale oil output is on track to grow by 1 Million Barrels a Day (MMB/D) annually. Shale output of 5.4 MMB/D is now more than half of total U.S. oil production of 9.3 MMB/D, in a global oil market that’s producing 98 MMB/D.  Furthermore, the fact that U.S. shale producers are growing production at ever lower costs is more likely bad for the other 95% of global producers.

The market is failing to differentiate U.S midstream energy companies that benefit from this growth in market share from the rest of the global energy losers.  At the annual MLPA Conference in Orlando a few weeks ago, MLP managements were similarly puzzled by the weakness in their stock prices. But they were far less worried than most investors, because they generally don’t need to tap the capital markets much to finance their growth plans.

.avia-image-container.av-6jjfve-cecce50a1c4f27a4ed1f8bacaf239c7d img.avia_image{ box-shadow:none; } .avia-image-container.av-6jjfve-cecce50a1c4f27a4ed1f8bacaf239c7d .av-image-caption-overlay-center{ color:#ffffff; }

It’s hard to find research that is bearish on MLPs, which is not especially comforting from a contrarian standpoint. The most negative case is probably the view that crude is going to $30 and will take MLPs lower with it. Before ascribing some additional insight to sellers, remember that over $40BN of retail money accesses the asset class inefficiently via taxable, C-corp funds such as AMLP (see Some MLP Investors Get Taxed Twice). Our investors, self-selected as they are, are an intelligent bunch. But they (you) are not representative of an investor base that includes those who accept a 35% corporate tax drag on their returns. Investment insight is going to be rare among this subset, and based on published fund flows they are responsible for some portion of the recent selling.

For those who enjoy analyzing statistical qualities of returns, the chart below compares the correlation of MLPs with crude oil and subsequent performance. It turns out that following periods of high MLP/crude correlation, MLPs do rather well. The 30 day correlation is 0.61, so the 90 day correlation used in the chart below is most assuredly heading higher over the next few weeks. A high 90 day correlation is typically followed by a good 90 day return. The correlation of this relationship is 0.63. It’s been said that if you torture the data enough it’ll tell you whatever you like, and some may believe that’s what’s going on here.

.avia-image-container.av-431csq-b2f081f97a66e68ca8efe5ae21022dc0 img.avia_image{ box-shadow:none; } .avia-image-container.av-431csq-b2f081f97a66e68ca8efe5ae21022dc0 .av-image-caption-overlay-center{ color:#ffffff; }

On the other hand, MLPs and crude oil shouldn’t move together nearly as much as they do, so when they dance too closely perhaps nervous sellers create an opportunity. In researching the components of the Alerian MLP Index, we calculate that only 25% of the cashflows are derived from crude oil. Some large MLPs have very little crude exposure, including Enterprise Products (EPD) at 17% and Williams Partners (WPZ) with 5%. Others such as Oneok Partners (OKS) and EQT Midstream (EQMP) have 0%. And this is the percentage of their cashflows derived from volumes of crude passing through their systems, which are only loosely affected by the price of crude. Natural Gas Liquids (mostly Ethane, Propane, Butane, Iso-butane and Pentane) are most commonly separated from the natural gas (Methane) with which they’re extracted. NGL prices tend to move with crude oil, but together these still represent less than half the cashflows of the Alerian index. As with crude, volumes are the principal driver of NGL-related cashflows, with their prices being of secondary importance. Nonetheless, MLP prices move with crude oil, reinforcing the understandable fixation MLP investors have with oil even though it’s hard to justify based on underlying fundamentals. In our fund we have an overweight to crude oil-oriented infrastructure businesses, but we estimate this at around 32%, so 7% higher than the index.

.avia-image-container.av-2slbwa-44e413bb800df72276d03b0ee39df8ec img.avia_image{ box-shadow:none; } .avia-image-container.av-2slbwa-44e413bb800df72276d03b0ee39df8ec .av-image-caption-overlay-center{ color:#ffffff; }

On another topic, last week we fielded a few questions from holders of Rice Midstream Partners (RMP). EQT recently acquired RMP’s General Partner (GP) Rice Energy (RICE). RMP slumped, because it highlighted a theme of our investing, which is that you don’t need to own an MLP to control it; owning the GP is sufficient. RMP investors have few rights, and the supply of accretive dropdowns they were expecting from their GP will now be redirected to EQM, a loss of future value over which RMP investors have little recourse. It’s why we invest in GPs (see MLPs and Hedge Funds Are More Alike Than You Think).

We are invested in EPD, EQGP (GP of EQM), Oneok (OKE, GP of OKS) and Williams Companies (WMB, GP of WPZ).


MLPs and Hedge Funds Are More Alike Than You Think

It usually pays to invest with management. In the hedge fund industry that has rarely been possible. Although most hedge fund managers invest in the fund they run, their wealth has come from owning the hedge fund General Partner (GP), which manages the fund. Opportunities to invest in hedge fund GPs are rare; they don’t need your capital and have little desire to share the lucrative economics.

In 2012 I wrote The Hedge Fund Mirage; The Illusion of Big Money and Why It’s Too Good To Be True. The book pointed out what most hedge fund managers know – that hedge funds have been a great business and a lousy investment. Fees have eaten up virtually all the investment profits. Money still flows to hedge funds, because there are and always will be some good ones. But the farther you stray from a unique, specialized strategy the more prosaic your returns. The book drew some nice reviews and provoked few critics, because most industry insiders preferred to minimize awareness of the lopsided split of investment returns. Being controversial turned out to be great fun, and caused us to think differently about another asset class.

.avia-image-container.av-9kaox5-da83b7ad0ee763d5f6eac93fbea487ec img.avia_image{ box-shadow:none; } .avia-image-container.av-9kaox5-da83b7ad0ee763d5f6eac93fbea487ec .av-image-caption-overlay-center{ color:#ffffff; }

Master Limited Partnerships (MLPs) look like hedge funds. Although they own actual infrastructure assets rather than stocks, bonds and currencies, they share their organization as partnerships with hedge funds and private equity. MLP investors, like Private Equity (PE) fund investors, have limited rights. They’re called “Limiteds”, because Limited Partners (LPs) have little recourse once they’re invested (see The Limited Rights of Some MLP Investors).

.avia-image-container.av-87yxqx-254b196f23425b29df41a6e83cc1cc14 img.avia_image{ box-shadow:none; } .avia-image-container.av-87yxqx-254b196f23425b29df41a6e83cc1cc14 .av-image-caption-overlay-center{ color:#ffffff; }

.avia-image-container.av-5i14qh-0dd428df8d512a0e5af925835b8a3d89 img.avia_image{ box-shadow:none; } .avia-image-container.av-5i14qh-0dd428df8d512a0e5af925835b8a3d89 .av-image-caption-overlay-center{ color:#ffffff; }

Not all MLPs have a GP, but many do and given how well hedge fund managers have done it’s no surprise that the people who run MLPs prefer to invest in the GP. The issue doesn’t receive much attention, but research we’ve done shows that in a select group of MLPs (i.e. those we care about) management has 25X as much money invested in GPs versus LPs.

.avia-image-container.av-4m8dbd-1a3c259cb3f536feb1dbc13e8377aa1f img.avia_image{ box-shadow:none; } .avia-image-container.av-4m8dbd-1a3c259cb3f536feb1dbc13e8377aa1f .av-image-caption-overlay-center{ color:#ffffff; }

Hedge funds and PE funds classically pay their GP “2 & 20”. This 2% management fee and 20% of the profits means, for example, that an 8% return after fees required a 12% return before fees. The 4% difference goes to the manager. MLPs pay their GPs Incentive Distribution Rights (IDRs), which direct a portion of the MLP’s Distributable Cash Flow (DCF) to the GP. The DCF split typically starts low but goes up to 50%, so the GP’s share can tend towards half.

The power of this becomes clear when you consider the financing of a new pipeline. GPs direct their MLPs to do something, the same way a PE manager directs his PE fund. A new pipeline is designed, planned, built and operated by an MLP on instructions from its GP, who then receives his share of the additional DCF created. Asset growth for PE managers is invariably beneficial, and it’s generally true as well for MLP GPs.

The best time to own hedge fund, PE or MLP GPs is during periods of asset growth. The Shale Revolution (see America Is Great!), with its growing output of crude oil, natural gas liquids and natural gas, is driving the need for more infrastructure assets. Recognition of this is behind the 25X statistic noted above.

.avia-image-container.av-8sxjd-aed4d5bc7f5a953bc4e17c98455be8d8 img.avia_image{ box-shadow:none; } .avia-image-container.av-8sxjd-aed4d5bc7f5a953bc4e17c98455be8d8 .av-image-caption-overlay-center{ color:#ffffff; }

It’s not a perfect analogy. For example, hedge fund investors have in aggregate done rather poorly, whereas 10 year MLP returns of 7.2% are better than REITs, Utilities and Bonds. Since MLP’s generally only raise equity from taxable U.S. investors tolerant of a K-1, they are limited to this relatively small portion of the global equity market. Those MLPs whose growth plans required several $BN have given up the lucrative GP/MLP structure in favor of being conventional corporations. But, as the 25X table shows, a decent number find the MLP structure still works.

At the MLPA Conference in Orlando a few weeks ago, questions usually concerned near term fluctuations in demand for one asset or another. We think the big trade here is America’s Path to Energy Independence, and owning GPs that benefit from continued infrastructure development. Conference chatter as well as attractive valuations show that it’s not yet a crowded trade.


Same Data, Different Conclusion

We’re not the first MLP investors to be puzzled by sector weakness in the face of growing oil and gas production. This was visible most clearly on Wednesday, when a sharp drop in crude following inventory numbers caused similar drops in many MLPs. Crude prices are weak precisely because of the success of technology in lowering costs, most obviously in the Permian in West Texas where most of the growth in output is occurring. Higher than expected U.S. production is mitigating the impact of OPEC’s production cuts. This ought to be bad for producers of conventional crude oil elsewhere in the world, and good for the owners of U.S. energy infrastructure handling greater volumes. So far, that hasn’t been the case.

.avia-image-container.av-5odm1u-7c151f9e70a9c58df4c88d9c5d81fd0f img.avia_image{ box-shadow:none; } .avia-image-container.av-5odm1u-7c151f9e70a9c58df4c88d9c5d81fd0f .av-image-caption-overlay-center{ color:#ffffff; }

Moreover, Permian-exposed Exploration and Production (E&P) companies are faring better than the MLPs that service them. This year MLPs with Permian exposure have lagged the Alerian Index. With rising output depressing prices, one might conclude that investors regard any increased utilization of infrastructure assets as temporary. Low crude will eventually feed through to reduced production and commensurately less need for pipeline and storage capacity. At odds with this view, the U.S. Energy Information Administration recently raised its 4Q18 forecast of output to 10.2 Million Barrels a Day (MMB/D), up from their 9.4MMB/D forecast of only four months earlier.

.avia-image-container.av-3j9c2a-747dd71364a0795535010a4f9ffdab29 img.avia_image{ box-shadow:none; } .avia-image-container.av-3j9c2a-747dd71364a0795535010a4f9ffdab29 .av-image-caption-overlay-center{ color:#ffffff; }

MLP investors may not believe this will happen. And yet, within the  E&P sector, those E&P companies with significant exposure to the Permian are outperforming the E&P index. Pioneer Resources (PXD) is outperforming all three MLPs we’ve highlighted, while Plains GP Holdings (PAGP) is underperforming all but one of the E&P names.

It seems that MLP investors and E&P investors are drawing sharply different conclusions from the same set of data on oil production. Or more precisely, potential MLP investors are declining to commit capital because they assess the outlook differently from E&P investors. At some point these views will have to reconcile, which we expect will result in higher MLP prices.

.avia-image-container.av-2vqpo2-3546b4dc5549d7415ad86457f405fe06 img.avia_image{ box-shadow:none; } .avia-image-container.av-2vqpo2-3546b4dc5549d7415ad86457f405fe06 .av-image-caption-overlay-center{ color:#ffffff; }

There’s a similar divergence with bonds. Since the low in the energy sector on February 11th last year, the High Yield E&P sector and MLPs have roughly kept pace with one another. Over the last few months they have diverged, with MLPs underperforming. Since E&P companies are generally MLP customers, it’s odd for the prospects of the customers to be improving without a positive knock-on effect for MLPs. But for now, that is what’s happening. The same data on output is supporting different conclusions by various investor types.