ETFs and Behavioral Finance

There are over three million stock indices in the world, more than 70 times as many as actual stocks. Before learning this startling fact in the FT the other day, I might have guessed wildly at 1% of this figure, thinking it way too high.

Although the growth in Exchange Traded Funds (ETFs) is not solely responsible for this index explosion, it’s certainly helped. The move away from active management has spurred the creation of indices into which passive funds can invest. At SL Advisors we recently made our own modest contribution to this thee million number by launching the investable American Energy Independence Index, in partnership with S&P Dow Jones Indices. Launching an index involves substantial work, but unlike an IPO there’s no 6% underwriting fee. Starting an index is cheaper than floating a stock.

The Shale Revolution has transformed America’s term of trade in energy, and created substantial opportunities for the infrastructure businesses who will help us towards Energy Independence. We identified a gap in the marketplace, since none of the available investment products offer exposure to this theme. A new index and associated ETF soon followed.

So it was that your blogger was at the Inside ETFs conference in Hollywood, FL last week. It’s an enormous event with (so we were told) a record 2,300 attendees. It’s a tangible measure of the growth in ETFs, marked by the S&P500 ETF (SPY) conveniently breaching the $300BN market capitalization threshold. The global ETF industry is over $4TN.

Non-investment luminaries such as Serena Williams and General Stan McChrystal added star power to the long list of finance experts giving presentations all day. We didn’t see any of them, because Inside ETFs is an enormous networking event. It’s become the can’t miss date of the year for everybody in the industry. Meetings with business partners and clients took up much of our planned schedule before arriving, and unexpected encounters filled the rest. You really can sit in the convention center lobby and enjoy serial, chance meetings with familiar faces.

The chatter is of success; of funds that generated strong early returns and have grown quickly. Of hot areas (Smart Beta), and underserved sector (European fixed income, believe it or not). It is Behavioral Finance in action. Positive results generate confidence, attracting more assets and more confidence. The winners keep winning. There’s no care for the unloved ETF. Efficient markets proponents hold that there ought to be no serial correlation in returns – in other words, no momentum. Prices reflect all available information, so short term moves are random. In the real world, rising prices attract more buyers, and falling prices draw more selling. This is why markets exhibit momentum, because like-minded people congregate to create a positive feedback loop.

Energy infrastructure endured the inverse of this for much of last year, as the growing divergence against almost all other sectors became self-reinforcing. Until late November, when the last frustrated tax-loss sellers exited stage left, signaling the beginning of a new trend.

In other news, U.S. crude output is set to reach an all-time record in 2018. You’d think it’d be hard to turn this into bad news, unless you’re a Russian oil producer/ But apparently there is a Dark Side of America’s Rise to Oil Superpower, according to Bloomberg BusinessWeek. Problems include the high quality of shale oil, which is lighter than the heavy crudes it’s displacing from countries such as Venezuela. This means it needs less refining. Although refineries may find certain expensively built processes no longer needed, ultimately producing refined products from it is cheaper. This is bad? Sounds like fake news; maybe the Russians planted the story.

The investable American Energy Independence Index (AEITR) finished the week +2.0%. Since the November 29th low in the sector, the AEITR has rebounded 15.0%.


AMLP’s Tax Bondage

Tax Freedom Day is that point in the year when you’ve figuratively earned enough to pay all your taxes. For the rest of the year you can feel as if your income is your own. Naturally, it can never come soon enough. Investors in the hopelessly tax-burdened ETF, the Alerian MLP Fund (AMLP) face the contrary prospect: the point at which their investment returns are taxed at the fund level before anything is paid out. If the opposite of freedom is bondage. AMLP investors recently passed Tax Bondage Day.

This comes about because AMLP is not a conventional ETF, but is a tax-paying C-corp. Anecdotally, it’s clear few investors realize this, because most ETF’s are RIC-compliant and therefore not taxable at the fund level. Conventionally, you don’t stop to consider whether the ETF you own is taxed like a corporation. But AMLP is a C-corp, paying taxes on its earnings before paying out what’s left to holders.

The weakness in energy infrastructure last year wiped out unrealized gains for AMLP and many other tax-burdened MLP funds. Since you don’t owe taxes on losses, AMLP’s Deferred Tax Liability (DTL) was eliminated. However, the sector has been recovering since late November, and probably the only negative consequence of the rebound is that AMLP now has unrealized gains once more. Therefore, it has begun to owe corporate taxes again. As of January 16th it owed $93MM, a cost in addition to and approximately equal to their annual management fee. As the market rises, so will their DTL.

.avia-image-container.av-4p09w8-7d6380113ec2bb52f6bc2ace8a9c4f8c img.avia_image{ box-shadow:none; } .avia-image-container.av-4p09w8-7d6380113ec2bb52f6bc2ace8a9c4f8c .av-image-caption-overlay-center{ color:#ffffff; }

You can find further detail on this issue from past blogs. Hedging MLPs explained how AMLP is useful as short position, because the tax drag will limit its appreciation to 79% of the market’s whereas it can still fall 100% of the market. Some MLP Investors Get Taxed Twice and Are You in the Wrong MLP Fund both examine the implications of a tax-paying C-corp for investors.

The reduced corporate tax rate means the tax drag is less than it used to be – and it’s been substantial. Since inception, AMLP has returned less than half its benchmark, largely because of tax expense. The reduced corporate tax rate will help, but it’ll still represent a serious drag on returns. Many investors are expecting strong performance over the next couple of years. Valuations are attractive, and energy lagged the market substantially in 2017. Seeing your fund hand over 21% of a double digit return before paying distributions will represent a substantial cost, and an unnecessary one because there are correctly structured energy infrastructure ETFs around that aren’t subject to corporate tax. It is possible to invest in the sector via a RIC-compliant vehicle.

On a different topic, the U.S. Energy Information Administration confirmed its forecast of record hydrocarbon production in 2018. Natural gas and natural gas liquids broke records in prior years, but this year crude oil production will also breach a previous high. Moreover, the mix of hydrocarbons should please almost everybody because it’s moving heavily away from coal and towards cleaner-burning natural gas. America’s emissions are moving in a better direction, thanks to the Shale Revolution.

.avia-image-container.av-2vut60-816184d2466149cc9d68377b996a5604 img.avia_image{ box-shadow:none; } .avia-image-container.av-2vut60-816184d2466149cc9d68377b996a5604 .av-image-caption-overlay-center{ color:#ffffff; }

The investable American Energy Independence Index (AEITR) finished the week -1.5%. Since the November 29th low in the sector, the AEITR has rebounded 12.8%.

We are short AMLP


Rising Rates and MLPs: Not What You Think

Five years ago my book Bonds Are Not Forever; The Crisis Facing Fixed Income Investors argued that interest rates were likely to stay lower for longer. Excessive debt led to the 2008 Financial Crisis, and our thinking was that low rates were part of the necessary healing process, allowing the burden of debt to be managed down.

Rates have indeed remained low, helped by the Federal Reserve’s very measured steps to “normalize” the Federal Funds rate with periodic hikes. Most forecasters, including the rate-setting members of the Federal Open Market Committee, have consistently expected rates to rise faster than they have.

Nonetheless, ten year treasury yields have been drifting up and recently touched 2.6%. Unemployment remains very low if not yet inflationary. GDP growth and corporate profits are strong. The recent tax changes are fiscally stimulative. Bill Gross has declared that we’re in a bond bear market, and Jeffrey Gundlach sounds equally cautious. It’s likely that this will be an increasing topic of conversation among investors.

We have no view on the near-term direction of bond yields, beyond noting that current yields are too paltry to justify an investment. It’s been a long time since bonds looked attractive. As we noted in our 2017 Year-end Review and Outlook, interest rates are what make stocks attractive. The Equity Risk Premium (S&P500 earnings yield minus the yield on ten year treasury notes) favors stocks, but if rates rose 2% bonds would offer meaningful competition. Although a 4-4.5% ten year treasury yield is a long way off, the historic real return (i.e. yield minus inflation) going back to 1928 is 1.9%.  So 2% above an inflation rate of 2% that’s rising wouldn’t be historically out of line.

Energy infrastructure investors will begin considering how rising rates might affect the sector. Traditionally, MLPs were categorized as an income-generating asset class along with REITs and Utilities. Rising bond yields have in the past represented a headwind for all these sectors, although MLP cashflows are not that sensitive to rate movements. Debt is predominantly fixed rate, and certain elements of the business, such as pipelines that cross state lines, operate under highly regulated tariffs which include annual inflation-linked increases.

.avia-image-container.av-2bxuyk-57c366aed123f5fca9023954ed72fcd3 img.avia_image{ box-shadow:none; } .avia-image-container.av-2bxuyk-57c366aed123f5fca9023954ed72fcd3 .av-image-caption-overlay-center{ color:#ffffff; }

Fairweather Friends

But energy infrastructure has undergone substantial changes over the past three years. Although yields are historically attractive, the volatility of 2015-16 was inconsistent with the stable, income-generating asset class investors had sought. As we’ve noted before (see The Changing MLP Investor), the Shale Revolution created growth opportunities that upset the business model and led many MLPs to “simplify,” their structure, which in practice meant they cut distributions in order to finance new investments. Consequently, the path of U.S. hydrocarbon production growth is more important than in the past.

The long term relationship between MLPs and treasury yields is not a stable one. The correlation between rate changes and MLP returns has fluctuated over the years, reflecting that there’s a weak economic connection between the two. Initial moves up in rates have often led to short term weakness in energy infrastructure, probably due to competing fund flows as noted above with REITs and Utilities. However, recent bond market weakness has led to the opposite result. The correlation is becoming negative.

.avia-image-container.av-23qi8s-577dca4bd6f1058ddc93bb24fe2f46a4 img.avia_image{ box-shadow:none; } .avia-image-container.av-23qi8s-577dca4bd6f1058ddc93bb24fe2f46a4 .av-image-caption-overlay-center{ color:#ffffff; }

This is likely because the strengthening economy, which is driving up rates, is improving the outlook for the energy sector as well. Energy infrastructure is more sensitive to volume growth, since this increases capacity utilization of existing facilities as well as the likelihood of further growth. A stronger economy will, at the margin, consume more energy. The 12 month rolling correlation (through December 2017) is the most negative it’s been since the sector peaked in August 2014. In January this relationship has persisted, with rates and MLPs both moving higher. So far, the economic forces that are causing weaker bond prices have been positive for energy infrastructure.

The investable American Energy Independence Index (AEITR) finished the week +1.9%. Since the November 29th low in the sector, the AEITR has rebounded 13.9%.


An Expensive, Greenish Energy Strategy

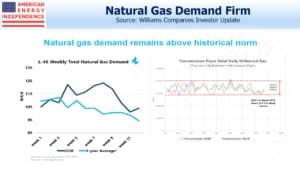
Most of the U.S. has been unseasonably cold – enduring twelve consecutive days of sub-freezing highs in New Jersey while owning a home in SW Florida is your blogger’s self-inflicted wound. The pain is only slightly ameliorated by news of record natural gas consumption of over 140 Billion Cubic Feet (BCF), almost twice the annual daily average.

You’d think that would be enough to satisfy demand, but the extended cold weather has exposed gaps in New England’s energy strategy. The region’s desire to increase its use of natural gas for electricity production is not matched by enthusiasm for infrastructure to get it there. Consequently, prices reached $35 per Thousand Cubic Feet (MCF) recently, roughly ten times the benchmark. Even at that price sufficient quantities weren’t available where needed, with the consequence that burning oil was the biggest source of electricity generation during this period.

.avia-image-container.av-3p19hb-d097d5fc5b0300dc44af677f2a74439c img.avia_image{ box-shadow:none; } .avia-image-container.av-3p19hb-d097d5fc5b0300dc44af677f2a74439c .av-image-caption-overlay-center{ color:#ffffff; }

In many cases, environmentalists’ views on natural gas are self-defeating. As a replacement for coal it surely reduces harmful emissions, and the widespread switching of coal-burning power plants for gas-burning ones represents a great success for environmentalists — for all of us. U.S. electricity generation is cleaner than in Germany (see It’s Not Easy Being Green). The New England Independent System Operator (ISO) has increased natural gas usage from 15% of electricity generation in 2000 to where it’s the most used fuel (other than very recently).  They correctly note that natural gas supports increased use of renewables, since wind and solar power are intermittent.

It should be a good story, except that the ISO’s increasing reliance on natural gas is opposed by environmentalists blocking the necessary additional infrastructure. In the last couple of years Kinder Morgan (KMI) and Enbridge (ENB) both cancelled projects that would have improved natural gas distribution and storage in the region. This was because of adverse court rulings, and regulations that dis-incentivize utility customers from making the necessary long term purchase commitments, without which infrastructure doesn’t get built.

As well as enduring the highest natural gas prices in the country, Massachusetts also imports Liquified Natural Gas (LNG). New England relies on LNG for 20-40% of its natural gas needs during winter. The Jones Act is a Federal law which requires intra-U.S. shipping to be carried out on U.S. owned, built and crewed ships. It’s expensive, and although this point is not the fault of Massachusetts, it means they’re importing LNG from Trinidad, even though the U.S. exports some of the cheapest LNG in the world. There’s little natural gas storage in the region, because the geology doesn’t support underground storage and opponents have prevented construction of above-ground facilities. Consequently, LNG is imported to Boston when needed in the winter, as long as a winter storm doesn’t disrupt shipping.

.avia-image-container.av-2w7gdb-6a06c86020dad3cbc2036ef671edf4f5 img.avia_image{ box-shadow:none; } .avia-image-container.av-2w7gdb-6a06c86020dad3cbc2036ef671edf4f5 .av-image-caption-overlay-center{ color:#ffffff; }

The high prices for natural gas in New England aren’t the only problem though. The recent jump in oil use for electricity generation is hardly consistent with lowering emissions. Meanwhile, New England’s ISO is warning that infrastructure development is inadequate, which risks the reliability of the electricity supply and in extreme cases may result in “controlled power outages”. The U.S. Bureau of Labor Statistics reported that in November 2017 the Boston area paid 57% more for electricity than the U.S. average, compared with only 28% more five years ago. It’s not just a winter problem. For 2017 (through November) Boston prices were 175% of the national average. New England is a wonderful region of the U.S., but its residents are poorly served by a dysfunctional energy strategy.

On a different topic, global auto sales exceeded 90 million units for the first time last year. China was 25% of the total. 2018 is likely to be another record. This is why the International Energy Agency is forecasting a 1.3% increase in crude oil demand this year.

The investable American Energy Independence Index (AEITR) finished the week +2.7%. Since the November 29th low in the sector, the AEITR has rebounded 12.4%. For most of 2017 the strength in Utilities contrasted with energy infrastructure weakness. However, this relationship has sharply reversed, with the Utilities Sector SPDR ETF (XLU) falling 9.3% since the late November low in AEITR. In mid-November we highlighted the poor relative valuation of the Utility sector (see Why the Shale Revolution Hasn’t Yet Helped MLPs). As the Administration announced plans to open up most of the offshore U.S. for oil and gas exploration, Interior Secretary Ryan Zinke declared, “We’re going to become the strongest energy superpower.”

We are invested in ENB, LNG and KMI.


MLP Distributions Through the Looking Glass

Alerian’s page showing annual distribution growth for the Alerian MLP Index (AMZ) contains their most popular chart (it’s the 4th one down under “Figures and Tables”). It’s no wonder – the steadily growing distributions it portrays should be enough to calm any income seeking, excitement-averse investor. Since it’s their most viewed page, many investors must have drawn comfort from the reliability it presents. The turmoil endured by MLP investors since 2014 appears incongruous when such steady growth in payouts is considered.

Oddly, investors who hold securities linked to the index (such as the JPMorgan Alerian MLP Index ETN: AMJ) have not enjoyed the distribution growth presented by the index. It’s because of Alerian’s curious method of calculation.

The components of the index are updated periodically based on criteria set by Alerian. The growth figure they calculate takes the index members at the end of the year, and looks back to calculate the year-over-year growth rate they experienced. Some of those names may not have been in the index over the prior two years, and perhaps more importantly those names that have been dropped (often because they cut their payout) are excluded.

.avia-image-container.av-47w1tj-746035276d2e42420145b429c7842f4c img.avia_image{ box-shadow:none; } .avia-image-container.av-47w1tj-746035276d2e42420145b429c7842f4c .av-image-caption-overlay-center{ color:#ffffff; }

The distribution growth rate therefore reflects what today’s index members are growing at. This may be useful information, but it’s not the same as calculating the growth rate of distributions received by investors in the index. Moreover, it creates an upward bias to the calculation, because poorly performing names who cut their payouts are dropped while recently IPO’d high fliers are included. During the 2015-16 MLP collapse Alerian relaxed the requirement that any AMZ member cutting their distribution be excluded, probably because it would have led to an overly concentrated index.

“When I use a word,” Humpty Dumpty said, in rather a scornful tone, “it means just what I choose it to mean—neither more nor less.” It’s Growth Through the Looking Glass.

.avia-image-container.av-2j69jr-04027609d1f59eaf1bdb8931bddbcac5 img.avia_image{ box-shadow:none; } .avia-image-container.av-2j69jr-04027609d1f59eaf1bdb8931bddbcac5 .av-image-caption-overlay-center{ color:#ffffff; }

The distribution history of AMJ, which is benchmarked to AMZ, shows that actual payouts have been falling since 2015. MLPs have been cutting payouts. Investors know this. The miserably tax-burdened ETF AMLP (seven year since inception return 2.8%, roughly half its index benchmark. See Some MLP Investors Get Taxed Twice), cut its distribution by 15.6% in 2017 following a 13.8% cut in 2016. AMJ’s 2017 dividends are 8% lower than the prior year. The AMZ distribution growth chart suggests a more positive history, and will presumably show better 2017 growth versus its linked investment products when it’s updated.

“But have distributions been growing or shrinking?” asked Alice. “Yes”, replied Humpty Dumpty.

Alerian is very open about their process. In February 2016 Alerian’s Karyl Patredis explained the procedure behind the chart. I know Alerian’s CEO Kenny Feng. He’s smart and has built a fine business. I’m sure there’s absolutely no intent to mislead people.

But this look-back methodology is not intuitive. It clearly doesn’t align with how investors actually experience dividend growth. If investors infer from the chart that MLP distributions have been growing steadily, they’re more likely to buy an Alerian-linked product such as AMJ or AMLP.

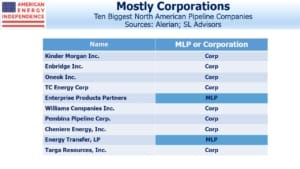
MLPs are redirecting more of their cash flow into new projects, and many of the larger ones have become C-corps so as to access a far wider set of investors. As a result, MLPs represent a shrinking piece of the energy infrastructure sector. To be a pure MLP investor today is to miss out on many of the biggest companies that are supporting America’s drive to Energy Independence.

This is why we created the American Energy Independence Index (up 6.5% in December), and its investable ETF, to better reflect what’s happening in energy infrastructure. As we’ve noted before (see The Changing MLP Investor), yield is less relevant to today’s investors. Stable businesses are reinvesting for growth, which is attracting total-return buyers. MLP payouts have been falling to allow for reinvestment back in their businesses and to reduce leverage. To believe MLP distributions have been growing is to follow a white rabbit down a hole.


MLPs Glimpse Daylight

Tromso, Norway, sits 215 miles inside the Arctic Circle. It is one of the planet’s most northerly human settlements. Around January 25th at lunchtime, its inhabitants drop what they’re doing and gather outside for their first glimpse of the sun in two months. It’s only visible for four minutes, but the first natural shadows after interminable darkness are a welcome confirmation of Spring’s approach. One resident told a visitor, “If you haven’t lived through a winter like ours you can’t imagine what it’s like.”

This Fall our church welcomed a new rector. He’s English, which allows us to discuss Premier League football at a depth inaccessible to other congregants. His beautifully written sermons are delivered with humor and grace. A recent homily opened with Tromso’s dawn, and led to a discussion of maintaining religious faith during spiritual darkness. I hope our rector isn’t disappointed that for me, emerging from Tromso’s dark winter also evoked the secular feelings of an MLP investor maintaining conviction in the profitable path to American Energy Independence. If you haven’t lived through a bear market in energy when stocks are making new highs all year, you can’t imagine what it’s like. Sunlight can’t be far away. Even in Tromso, winter ends.

At their darkest, MLP fund outflows during 4Q17 were comparable to the worst of late 2015 and drove valuations relentlessly lower, creating a negative feedback loop. As income-seeking investors left the sector (see The Changing MLP Investor), the consequent selling has tested the conviction of others. Some just gave up – the relentless slipping of prices during a rip-roaring bull market in almost everything has eroded the confidence of many.

However, it’s looking as if December may be the dawn for battered energy infrastructure investors, with the late-year seasonal pattern once again playing out (see November MLP Fund Flows Overwhelm Fundamentals). The most recent data shows that the fund outflows have virtually finished. Taxes are probably the catalyst. In November (often the weakest month), uncertainty about what the GOP tax bill would ultimately mean for MLPs further damaged already fragile sentiment. Bloomberg’s  The Senate Tax Plan Sets a Trapdoor for MLPs in late November epitomized the concerns some had about adverse tax changes.

Tax-loss selling has been another big influence. Most investors have realized gains this year and selling energy losers offers a way to reduce taxable gains. Moreover, winners are more plentiful than losers, leaving investors with few places to find losses other than among their energy infrastructure holdings.

But taxes also provided support more recently, because the final legislation was beneficial to MLPs. The tax-deferred portion of distributions is typically taxed at ordinary income rates, but that will now benefit from the 20% discount for pass-through businesses. There was some further good news for General Partners (GPs), in that Incentive Distribution Rights payments will also receive preferential pass-through treatment rather than being taxed as ordinary income. In spite of initial concerns, given a few days to assess the final bill it’s clear it provides a welcome boost to the after-tax income of both MLP and GP investors. Bloomberg’s trapdoor wasn’t triggered. The table below reflects the final legislation passed by Congress last week.

.avia-image-container.av-2esy9r-e04fc0f4c333c5ec689557a3f3457374 img.avia_image{ box-shadow:none; } .avia-image-container.av-2esy9r-e04fc0f4c333c5ec689557a3f3457374 .av-image-caption-overlay-center{ color:#ffffff; }

The American Energy Independence Index (AEITR) is +4.5% so far in December. After a torrid few months, MLP returns are improving. Although the sector is still negative for the year, the AEITR has bounced +7.3% since the late November Bloomberg story mentioned above. For investors, it just might signal the start of sunny days once more.


Hedging MLPs

It’s not easy to hedge energy infrastructure stocks or MLPs. The relationship with crude oil is unreliable. There’s no MLP futures contract, and if you think the K-1s that come with owning MLPs are onerous, try shorting one and see how complex the tax reporting can be.

The past few months has been a time when hedging such exposure would have reduced a lot of angst. For those interested in protecting against short term adverse price moves without completely foregoing upside, shorting the Alerian MLP ETF might make sense.

We’ve written before about the tax drag that faces owners of AMLP (see Are You in the Wrong MLP Fund and Some MLP Investors Get Taxed Twice). This comes about because AMLP is a C-corp, rather than a Regulated Investment Company (RIC). Most ETFs and mutual funds don’t owe corporate tax, but AMLP does, at least when it makes money. When it’s down, its taxes owed are reduced. If it’s +1% pre-tax, its NAV will move up 1% less taxes owed. If it’s -1% pre-tax, its NAV will fall less than 1% because it’ll get a credit for owing less in tax.

This makes AMLP less volatile than its index (the Alerian MLP Infrastructure Index) most of the time, since the taxes owed rise and fall with the market. However, it’s generally bad for owners because the taxes have contributed to AMLP lagging its index by 2.6% annually since inception in 2010, a cumulative 31%. It does best in a falling market, but since the point of owning it is to profit from the sector rising, the tax drag hurts. AMLP probably has the worst track record in the history of passive ETFs.

.avia-image-container.av-av_image-ad1ee0e6209d2c8f7fa87a26e3cc82e4 img.avia_image{ box-shadow:none; } .avia-image-container.av-av_image-ad1ee0e6209d2c8f7fa87a26e3cc82e4 .av-image-caption-overlay-center{ color:#ffffff; }

There’s an added wrinkle though, which is that taxes are only owed on unrealized gains. When the market falls enough to wipe those out, the tax issue temporarily disappears. Unrealized losses don’t create any tax benefit, so AMLP just roughly follows its index with similar volatility. What’s interesting is we’re close to an inflection point, in that we estimate AMLP’s unrealized losses will swing to unrealized gains with 5-6% further rally in the sector. As it crosses the line from losses to gains, AMLP will once again be subject to tax drag. So we’re close to a point at which it falls with the market but rises less than the market.

Hedge funds were widely believed to be using AMLP to short the sector in just this fashion two years ago.

This asymmetry could make it an interesting short position today. Its $9.5BN market cap means it isn’t hard to borrow. It could be used to hedge an existing portfolio of energy infrastructure securities, or even paired with a RIC-compliant

fund

not subject to corporate tax. The lower corporate tax rate will not alter AMLP’s taxable status, but will reduce its magnitude. Its future volatility will also rise closer to that of its index. Its value as a short position highlights its poor use as an investment, so if you’re simply long AMLP, the chronic history of underperformance will continue to work against you.

We are short AMLP


American Energy Security

This morning CNBC had ClipperData’s Matt Smith as a guest. He noted that U.S. net imports of crude oil and petroleum products are below 3.44 Million Barrels a Day (MMB/D), a level last seen in February 1985.

OPEC, the International Energy Agency (IEA), and the U.S. Energy Information Administration are all forecasting U.S. crude oil production to increase next year: 1.05 MMB/D (OPEC),  1.1MMB/D (IEA) and 0.8 MMB/D (EIA) respectively. All three forecasts would mean record U.S. oil production.

.avia-image-container.av-3rqkel-3b47ff8df7c328866aae189ea07bfdbe img.avia_image{ box-shadow:none; } .avia-image-container.av-3rqkel-3b47ff8df7c328866aae189ea07bfdbe .av-image-caption-overlay-center{ color:#ffffff; }

As a result, the U.S. is becoming a more significant exporter of both crude oil and natural gas. It’s worth remembering that a substantial portion of global supplies of hydrocarbons come from countries that are far less reliable trade partners. The closure of the Forties oil and gas pipeline in the North Sea has contributed to a spike in UK natural gas prices. One consequence is that the UK is preparing to welcome imports of Liquified Natural Gas (LNG) from a Russian LNG export facility even while the U.S. and EU  have imposed sanctions designed to impede the financing of such projects. American Energy Independence is to our benefit but will increasingly help extend energy security to others.

.avia-image-container.av-s8pp-dcf7a1b8c7ff80aefe845389514cf677 img.avia_image{ box-shadow:none; } .avia-image-container.av-s8pp-dcf7a1b8c7ff80aefe845389514cf677 .av-image-caption-overlay-center{ color:#ffffff; }


Falling Taxes and Valuations Boost Energy Infrastructure Outlook

Tax reform removed the uncertainty surrounding treatment of MLPs, in that both House and Senate plans provide some additional benefit. Although the final bill will require negotiations to reconcile the different Senate and House versions, we’ve updated the table below to reflect a 22% corporate tax rate and the Senate treatment of pass-through income for MLP investors, which is less attractive than the House. Investors in both C-corps and MLPs will be better off, and if the House’s pass-through treatment prevails MLP investors will benefit further.

.avia-image-container.av-60ql7h-f79c14ecbb23d14b2bbc9f45811c9afb img.avia_image{ box-shadow:none; } .avia-image-container.av-60ql7h-f79c14ecbb23d14b2bbc9f45811c9afb .av-image-caption-overlay-center{ color:#ffffff; }

The 2017 Wells Fargo Pipeline and Utility Symposium held last week included the slide below. Energy infrastructure investors need little reminder – 2017 is turning out to be a forgettable year, which has reduced valuations to the levels shown in the chart. Tax loss selling continues, since most investors have substantial investment gains and unloading some energy losers mitigates the tax bill. There’s little other justification for such moves.

.avia-image-container.av-4t50kt-8153dae5867c13e9959fd243547c6bd5 img.avia_image{ box-shadow:none; } .avia-image-container.av-4t50kt-8153dae5867c13e9959fd243547c6bd5 .av-image-caption-overlay-center{ color:#ffffff; }

People often associate breakthroughs in energy research with electric vehicles (EVs) and use of renewables to provide power. But traditional energy businesses are also the subject of considerable research and development. NET Power, based in Houston, TX, has built a pilot power plant that uses natural gas but captures the resulting CO2. They claim to have built a zero-emission natural gas power plant. Investors have provided $150MM to develop the business. It’s obviously early, but if the technology turns out to be successful on a large scale, given the abundance of natural gas in the U.S., it could be a significant solution to fossil-fuel based carbon emissions. It could even provide a legitimate clean energy alternative to windmills and solar panels. It would represent yet another dimension to the benefits to America of the Shale Revolution. New technology is often exciting, and interesting energy research isn’t limited to wind and solar.

.avia-image-container.av-2xl6a5-a41caa172b442c0a20b6a4186dd9f934 img.avia_image{ box-shadow:none; } .avia-image-container.av-2xl6a5-a41caa172b442c0a20b6a4186dd9f934 .av-image-caption-overlay-center{ color:#ffffff; }

The “Duck Curve” represents the demand for electricity during a typical day. The version from California’s Independent System Operator (ISO) highlights that peak electricity demand occurs at breakfast time when people are getting ready for work or school, and at dinner time when they return home. Although solar-generated electricity is growing, it’s worth noting that demand is highest when the sun is low in the sky or it’s dark. Therefore, traditional power plants such as natural gas are critical to providing power when it’s most needed. A speaker at a recent conference organized by R.W. Baird noted the potential problem this presents for the green credentials of EV owners, in that the obvious time to charge them is in the evening when renewables are less likely to be the source of electricity.

Regular readers will not expect us to be bullish on Bitcoin. Its recent take-off has been spectacular to watch, rather like a rocket that will inevitably crash even while its ascent is riveting. We’re reaching the stage where comparative valuations are startling: on Wednesday aggregate crypto-currency valuation exceeded the market capitalization of JPMorgan for example. CEO Jamie Dimon has called Bitcoin a fraud. You could own all the bitcoins that exist, or approximately half the publicly held energy infrastructure in the U.S. The correct choice isn’t obvious to everyone. The CME and CBOE’s proposed Bitcoin futures contracts must be the strongest evidence yet that parts of the U.S. finance industry have completely lost the plot, oblivious to their ostensible role of helping savers fund retirement in favor of creating gambling products.

What receives less attention than Bitcoin’s price is the energy consumed to “mine” new units. The computing power required to solve the increasingly complex algorithms that allow cryptocurrency units to be manufactured now consumes 29 Terrawatt Hours of electricity annually. This is more than the consumption of 159 countries. One analyst estimates that this costs $1.5BN, based on using cheap electricity in places such as China. Using recent growth rates, by next Summer crypto-currency production will consume the equivalent of America’s electricity output, and by 2020 the entire world’s. Somewhere, something will give. We’ll be spectators.


November MLP Fund Flows Overwhelm Fundamentals

In a single week in mid-November, from 15th to 22nd, $317MM flowed out of MLP mutual funds. It was an extraordinary exit over such a short period, second only in recent history to the first week of December 2015, when $340MM bolted. That was a time when every seller was motivated while buyers were scarce. Within two months the sector bottomed and began the glorious 2016 rally.

Nonetheless, the collective mutual fund exit in mid-November represented fully 1.5% of the $20BN in such funds.  In its way it was a run on the bank, punctuated by the apparent absence of a crisis anywhere else. Over that same time period, the S&P500 rose 0.7%, the S&P Energy Sector ETF (XLE) rose 0.5% and the Oil Services ETF (OIH) rose 1.5%. MLPs underperformed all of these, as they usually did in November, dropping 0.2%. For the month as a whole, redemptions totaled $473MM, more than 2% of the assets held by MLP mutual funds.

Earnings season had passed. Big fundamental news was sparse. Oil jumped from $55.50 to $58 on hopes of an extension to OPEC’s production cuts, further confusing MLP investors who learned to fear oil’s moves when it was falling and find the recent rally especially galling. Most notable that week was the announcement by Norway’s $1TN sovereign wealth fund of plans to divest from oil and gas stocks by the end of 2018 – a wholly sensible idea given the source of their wealth is natural gas. Most parts of the energy sector rose in the days following this announcement, whereas MLPs reacted as if Norway’s entire divestiture was going to fall on them. For this and other reasons, 1.5% of the capital in MLP mutual funds saw enough to exit. Oil and energy stocks were higher but MLPs weren’t, challenging equity analysts to explain the inexplicable. Understanding the 2017 performance of energy infrastructure stocks so clearly lies with the investors, not the operating companies.

Some investors are selling to create tax losses with which to offset gains elsewhere in their portfolios – it’s been a good year if you’ve had any kind of diversification away from energy. The progress through Congress of tax reform has created some uncertainty. With little sensitivity to PTSD-suffering MLP investors, Bloomberg ran an article unhelpfully titled The Senate Tax Plan Sets a Trapdoor for MLPs. Corporate taxes are coming down; while Congress deliberated, it was unclear whether MLP investor tax liabilities might benefit from pass-through treatment (a lower rate), or  not. But there never was a plan to increase taxes paid by MLP holders, although Bloomberg had a good headline.  Nevertheless, for much of November MLPs faced some uncertainty about their ultimate tax treatment. Such is current sentiment that many potential buyers were inclined to wait for clarification while sellers often opted for immediate action. In this sector but few others, those holding securities hold greater conviction about their disposal than do holders of cash about its deployment. Late Friday night, Republicans passed the Senate Tax Bill and included a 23% deduction for pass-through entities. With a big pass-through cut in the House bill as well, MLP investors can now be optimistic they’ll receive a favorable tax outcome.

MLPData had some interesting figures supporting the gradual exit of traditional MLP investors from the sector. They report that last year 9MM K-1s were issued, down from 11.1MM in 2009. Moreover, in 2016 only 27% of those went to individuals compared with 33% the prior year. There are fewer MLPs as we’ve noted before (see The American Energy Independence Index), since most of the big ones have concluded they’re not a good source of growth capital. Increasingly, energy infrastructure is owned by regular corporations (“C-corps”).

Some people interpret this shift as demonstrating greater institutionalization of MLP ownership via ETFs and mutual funds. But we disagree – the money those funds are investing is still largely retail. These funds widened the investor base by providing MLP exposure without a K-1, albeit usually with dreadful tax inefficiencies (see Some MLP Investors Get Taxed Twice). The big difference is that 1099 investors don’t possess the long term perspective of a K-1 investor, because ’40 Act funds don’t come with the same tax deferral opportunity. The resulting broader investor base is less tax-motivated, and therefore more inclined to trade their positions. Energy infrastructure used to be the exception – the transition away from traditional, K-1 tolerant investors with long holding periods has created one of the market’s most volatile sectors.

If you need to experience extreme schadenfreude before buying, energy infrastructure provides a target-rich environment. The rally late last week was long overdue and shows some signs of improving sentiment although valuations remains depressed. The positive fundamentals are exceptionally well known to current holders, starting with America’s march to Energy Independence powered by the Shale Revolution (see Energy Production Supports MLP Outlook). It represents American capitalism at its very best (see America Is Great!). Fundamentals are improving, leverage is coming down and valuations reflect excessive pessimism. Many current investors are confused. It was a volume business but higher volumes no longer help. It became a crude-oil linked business until oil rose.  OPEC uncertainty, pass-through tax treatment concerns, MLP seasonals, tax loss harvesting, price technicals, and fund flows all weighed on sentiment. For quite a few in mid-November, confusion overwhelmed conviction. Those sales looked smart at the time. As tax loss selling abates, the calendar turns and the U.S. breaks more records in hydrocarbon production, the good feelings will be fleeting.  Aleviating concerns, on Thursday, OPEC extended production cuts until the end of 2018 and signaled a strong commitment to cooperation among leading members. Passage of tax reform has further provided much improved clarity as well as a boost to after-tax returns. Sentiment and prices have every reason to continue improving.