Energy Policy Meets Reality

Public policy is becoming more important to energy investors. Democrats now own the climate change issue. The desire of progressives to advance a world of solar panels and windmills is confronting pragmatists who’d like to keep the lights on. Rising oil and gas prices are helpful to the energy transition, by improving renewables’ competitiveness. But $4 gasoline would have political repercussions. So the spirit of St. Augustine prevails (“Give me chastity, just not yet”). Last week U.S. Energy Secretary Jennifer Granholm reported “a productive call with Saudi Energy Minister Abdulaziz bin Salman al-Saud” to “ensure affordable and reliable sources of energy.”

The Administration’s proposed $2TN infrastructure plan is likely to rely on reconciliation to get through the Senate, which means it has to look like a tax/spending plan rather than new laws. Eliminating the filibuster would allow more expansive policies, including on climate change, to be passed with a simple majority rather than the 60-vote filibuster-proof margin.

West Virginia Senator Joe Manchin’s (D) power stems from his less than perfect fealty to Democratic ideals. He is against changing the filibuster, which limits the prospects for new laws including on energy. Manchin wants to, “…usher a new era of bipartisanship where we find common ground on the major policy debates facing our nation.” Hence, Congress can spend money on building an electric vehicle charging network, but can’t impose a carbon tax, even though it’s supported by the American Petroleum Institute.

The Administration’s desired path is to show progress without imposing visible costs, since numerous polls show voter concern about climate change stops once the monthly cost competes with their Starbucks budget. Hence the call to the Saudi oil minister.

Energy investors should welcome the increased political debate. It forces the shrill rhetoric of climate extremists to confront reality. For example, the Texas legislature is considering passing the costs of windmill intermittency back to windmill operators. Texas has enjoyed great success in using more windpower, but the grid’s vulnerability to calm days increases with dependence on wind.

Berkshire Hathaway Energy helpfully showed what intermittency costs, by offering to invest $8BN to build ten natural gas power plants. The proposed Texas Emergency Power Reserve would normally remain idle but could meet any plausible power shortfall by ramping up within ten minutes. The cost of ensuring reliable power would be passed on to customers.

Texas state senator Shelly Hancock (R) has argued that renewable energy providers should instead pay the cost of these natural gas power plants whose main purpose would be to provide back-up power for wind. It’s a reasonable suggestion, but is opposed by renewables operators whose investments were based on a socialized approach to the cost of compensating for intermittency.

The power outages Texas endured last month were caused by multiple failures, including of natural gas plants (see Why Texas Lost Power). But wind and solar power plants are chronically intermittent, with typical utilization of only 20-30%. Despite the outages, natural gas was the only source of power in Texas whose output rose. Renewables often get a free ride by providing power opportunistically with no penalty for unreliability.

.avia-image-container.av-prwfin-4696a7f364e01061ec73022afdd7bdbd img.avia_image{ box-shadow:none; } .avia-image-container.av-prwfin-4696a7f364e01061ec73022afdd7bdbd .av-image-caption-overlay-center{ color:#ffffff; }

Although CO2 emissions are a global problem, OECD countries aren’t making it worse. All the growth is coming from developing countries, notably China and India. Climate change is supposedly a bigger threat to those less able to afford mitigation. While this ought to make poorer countries big supporters of lowering emissions, raising living standards is a higher priority. The most vulnerable nations don’t share rich world goals aimed at protecting them from rising sea levels.

India’s Energy Minister Raj Kumar Singh offered an articulate summary, “The developed world has occupied almost 80% of the carbon space already. You have 800 million people who don’t have access to electricity. You can’t say that they have to go to net zero. They have the right to develop. They want to build skyscrapers and have a higher standard of living. You can’t stop it.” In other words, it’s their turn to pursue a western standard of living. Until emerging countries acknowledge the problem, it’ll be hard to induce rich world voters to pay for solutions.

The increased political debate is good news for all except the climate extremists still clinging to purist impracticality. Climate change is all about politics and economics. The technology already exists for carbon capture, hydrogen sourced electricity and other zero-emission solutions. They’re just expensive. The diminishing likelihood of extreme policy responses (see The Bovine Green Dream) is removing the always low-probability existential risk faced by parts of the energy sector.

The components of the American Energy Independence Index yield 7% on a market cap weighted basis, and announced buybacks add a further 2%. This helped the index to a 20% return in the first quarter. Past performance is not indicative of future returns.

We are invested in all the components of the American Energy Independence Index via the ETF that seeks to track its performance.


Reaction To Our Goldman/Archegos Post

Our blog post on Sunday, Why Goldman Unsurprisingly Avoided Archegos Losses drew a wide range of comments, both on social media and via direct emails to me. Many observers dislike Goldman – their continued success and adept avoidance of mistakes made by others leads to grumbling of sharp practice. I recounted an experience of my own from 1998 when hedge fund Long Term Capital Management (LTCM) collapsed. Former colleagues with whom I’ve remained friends recall that episode similarly. But it was a long time ago and is only one event.

.avia-image-container.av-tf282o-e4ae11877ecaca2f5edb0daef0f3295a img.avia_image{ box-shadow:none; } .avia-image-container.av-tf282o-e4ae11877ecaca2f5edb0daef0f3295a .av-image-caption-overlay-center{ color:#ffffff; }

Another former JPMorgan colleague, lamenting the lost code of honor that he recalls existed in banking, described being the victim of a collateral grab of dubious legality later in his career at another firm. The perpetrator was JPMorgan. Reputations vary among big banks, but they’ve all written hefty checks for regulatory or legal failings.

While there’s a popular cynicism towards Wall Street with Goldman regularly in its crosshairs, finance professionals who have done business with them hold a more nuanced view. Some will report a negative personal experience, but grudging admiration is more common. One recalled Goldman “breaking norms” when he was liquidating bond positions related to the Drexel Burnham bankruptcy in 1990, but also regrets not accepting a job there almost two decades later. I suspect the vast majority of critics would jump at the chance to work at Goldman.

My intent with the blog post was to highlight Goldman’s skill in extricating themselves from a situation far more elegantly than their peers. The previously estimated $3-4BN loss at Credit Suisse has turned out to be $4.7BN. Several senior executives have lost their jobs as a result. Avoidance requires good systems to understand the exposures, but also good judgment on what to do. Goldman has both.

“Any sufficiently advanced technology is indistinguishable from magic.” was the comment from one individual better informed than most on this episode. Maybe to Credit Suisse and Nomura that’s how it looked. Another comment was that when a client doesn’t return calls asking for margin, it should be clear what to do next. Not all risk management is high tech.

Most controversial was the suggestion that Goldman is willing to take some legal or regulatory risk depending on the circumstances. This resonated with many outside observers.

Warren Buffett once said that if you follow anyone around all day long you’ll eventually find them doing something wrong – even if it’s failing to completely stop at a stop sign. I have been pulled over for this in Naples, FL, but was let off with a warning by a typically friendly Naples patrolman. I maintain that it’s simply an excuse to search for drugs or guns, whereas my wife thinks I should drive properly.

One respondent in a position to know rejected my suggestion that Goldman regards taking legal/regulatory risk as sometimes acceptable depending on the upside. He believes they are more conservative than most, and is better placed to know than I am. My view is based on years of observation, but not derived from direct experience other than in 1998. Just as technology can look like magic, perhaps astute judgment can appear to exploit regulatory grey areas.

In any event, the most important part of the story is that Goldman didn’t lose $4.7BN, or indeed anything material. They’re too good for that. Archegos exposed a gulf in competence between Goldman and some others. Perhaps the best judgment was exercised at my old firm JPMorgan, by avoiding the whole sorry mess.  

We are invested in all the components of the American Energy Independence Index via the ETF that seeks to track its performance.


Why Goldman Unsurprisingly Avoided Archegos Losses

Goldman almost always sidesteps trouble. That’s one of the conclusions from the Archegos blow-up that is estimated to have cost the firm’s lenders as much as $10BN.

Imagine the discussion among Credit Suisse, Nomura, Morgan Stanley, Goldman Sachs, UBS and Wells Fargo as they considered an orderly liquidation of the hemorrhaging Archegos portfolio. It was a mismatch of men and boys – according to reports, Goldman warned that the market would quickly realize the scale of the problem, depressing the prices of what they were trying to sell and leading to a very disorderly liquidation.

.avia-image-container.av-u7a64u-14dee6e63fbe2bb8821029606d676023 img.avia_image{ box-shadow:none; } .avia-image-container.av-u7a64u-14dee6e63fbe2bb8821029606d676023 .av-image-caption-overlay-center{ color:#ffffff; }

It seems so obvious. Some Wall Street firms are sharper than others. Goldman and Morgan Stanley, who had sensibly adopted the role of observers not participants, evidently relied on this subtle distinction to immediately sell the Archegos collateral they held once they understood the scale of the problem. Nomura and Credit Suisse, in a high stakes version of the Prisoner’s Dilemma, thought time was on their side. They just forgot that Goldman wasn’t.

Goldman Sachs is full of street smart, talented people. In the 1980s and 1990s when I was trading interest rate swaps at JPMorgan, if Goldman was your counterparty to a trade it was worth taking a second look. They rarely seemed to be forced participants – often they’d identified a mis-pricing or arbitrage opportunity. Whenever I found Goldman on the other side of my trades, I often traded less than my full position while I figured out what could be driving their decision to go the other way. Pausing rarely cost the opportunity – markets moved their way more often than not.

In 1998, when hedge fund Long Term Capital Management (LTCM) was blowing up, their biggest swap counterparties gathered to discuss an orderly liquidation. LTCM was our biggest counterparty, but then LTCM was everybody’s biggest counterparty. Their abundance of PhDs and egos had created a colossus that generated tens of millions of dollars a month in profits for the banks trading with them.

I was running interest rate derivatives for Chase Manhattan (later merged into JPMorgan). I received a phone call late one night from a colleague informing me that LTCM was collapsing due to many highly leveraged bets going awry simultaneously. The following morning, our head of credit summarized the exposures we and the other big counterparties had to LTCM. As with Archegos, an orderly liquidation of positions looked to be the best option. But the economic incentives were similar to a cartel – each member was incentivized to secretly cheat.

The LTCM bank group was apparently sworn to secrecy. The information I had been provided made me an insider – it was obvious what trades should be done to generate immediate profits (“pay fixed in ten year swap spreads”) but I respected the rules and waited. Goldman didn’t. I saw them trading on the information they possessed about LTCM’s portfolio.

Goldman never got in trouble. Maybe what they had wasn’t inside information under a strict legal definition – interest rate swaps were bilateral agreements, not SEC-registered securities. Maybe they understood the information sharing agreement to be loose enough to allow trades to be done. What I do know is that they acted differently than we did. David Pflug, the patrician head of credit at Chase, was a man of his word who would never have resorted to legalistic identification of loopholes. Not trading on the information we had required no further explanation. We passed up a hugely profitable trading opportunity – but LTCM had been a money spigot for years.

Derivatives traders use the Greek alphabet (delta, gamma, theta) to identify portfolio risks. David Pflug later commented on the glittering mathematicians of LTCM, “for all their knowledge of Greek, they didn’t understand the meaning of hubris.”

I’ve always felt that Goldman regards legal and regulatory risk as just another risk alongside credit, rate, FX and equity risk. They all offer a risk/return trade-off. Most banks, including the one I worked at, put legal and regulatory risk off limits. There was no such thing as acceptable legal risk. Having watched Goldman over decades, I believe their culture incorporates a highly sophisticated assessment of legal/regulatory risk that allows them to consider the upside of a transgression against the possible penalty. They are very good at it, which is why they so rarely mis-step. The 1MDB disaster is one of the few.

It looks as if Goldman used the Archegos discussions to obtain a clear view of the group’s exposures while retaining the freedom to act. They would have considered their market risk as well as any legal/reputational downside from moving quickly. As skilled risk managers, they quickly decided that your first loss is your best one and sold. Credit Suisse and Nomura discovered they were playing poker at the wrong table.

Credit Suisse is estimated to have lost $3-4BN, and Nomura $2BN. As Warren Buffett has said, if in a poker game you don’t know who the patsy is…

Last Tuesday, Goldman downgraded Nomura’s stock. They noted, “market concerns around risk management issues may persist.” It’s unlikely Nomura will find cause to reciprocate.

We are invested in all the components of the American Energy Independence Index via the ETF that seeks to track its performance.


Why You Can’t Trust Reported Inflation Numbers

We recently bought a summer house for our family on the Jersey shore. This was not a unique impulse on our part – it is a seller’s market in the worst way imaginable. Having begun our search calmly with no intention of being rushed, we were soon in a bidding war which we “won” — by exhibiting less financial self-discipline than anyone else involved. Within weeks and before we’d closed, our realtor reported that we could assign our contract to another buyer for almost a 10% gain over our price. Bedrooms had already been assigned and additional beach equipment purchased. A quick taxable gain wasn’t enough to counter the prospect of long family faces. Suburban real estate outside New York and many other cities is hot.

.avia-image-container.av-w6o1jj-b864770b1ad4dd0f0a728810914ef9dc img.avia_image{ box-shadow:none; } .avia-image-container.av-w6o1jj-b864770b1ad4dd0f0a728810914ef9dc .av-image-caption-overlay-center{ color:#ffffff; }

Naturally my thoughts turned to Owners’ Equivalent Rent (OER) — the quixotic means by which the government measures housing inflation. Historically, around two thirds of U.S. households own their home (it’s currently 65.8%). Around a quarter of consumer pre-tax income is spent on housing (either owned or rented). Measuring rental inflation is done by surveying actual rents, but for owner-occupied housing, the Bureau of Labor Statistics (BLS) conducts a phone survey in which they ask, “If someone were to rent your home today, how much do you think it would rent for monthly, unfurnished and without utilities?” This is OER.

A house (or an apartment) is a physical asset that provides a service (shelter). The BLS wants to measure the value of the service not the cost of the asset. It’s a sound theory — except that few homeowners spend much time considering the rent they could charge if they vacated their home. OER is a theoretical concept – the only element of the inflation statistics not supported by actual prices.

These are familiar criticisms for those who have studied the issue. BLS statisticians argue that OER reflects all the costs of home ownership, including property taxes, mortgage expense and maintenance, just as the rental cost of an automobile or airplane does. They also argue it’s also not easy to identify an alternative – an index that included mortgage expense and property taxes would incorporate the cost of financing an asset, which they’re not trying to measure.

No cash changes hands based on OER and if it rose sharply, therefore driving inflation higher, would it even matter? The Fed would likely dismiss it as unimportant, a non-cash item. And they’d be correct to. Hiking interest rates because perceived rental income was rising even though nobody was paying those higher rents would seem ludicrous. But since conventional inflation statistics omit the actual cost of shelter incurred by homeowners, the result is that inflation in the biggest portion of consumption expenditures for two thirds of U.S. households is not picked up.

In recent years, OER has lagged the Case-Shiller U.S. National Home Price NSA Index (C-S). Prior to 2000, OER supporters could argue that since OER was tracking C-S it was working, even if their close relationship seemed coincidental given their different methodologies. But since 2000 OER and C-S have deviated, and the gap has steadily widened, as noted in this blog post. Prior to the 2008 financial crisis, OER didn’t show any housing inflation even while actual home prices soared and then slumped. Through December (most recent C-S data), house prices are up 10% year-on-year nationwide, while OER has registered only 2%, less than the five-year average. The most recent OER for February showed a 2% year-on-year increase. Over the last decade, house prices have risen more than twice as fast as OER.

OER doesn’t work.

Most households obtain shelter through buying a home. It’s obvious that house and apartment prices determine the cost of shelter for most of the population, even if buying shelter also requires buying an asset. For the past three decades, the U.S. home ownership rate has remained between 64% and 69%. It’s not that sensitive to prices – many households deem ownership as the only acceptable way of obtaining shelter. Although the BLS statisticians would like us to think of shelter (a service) as separate from an asset (a house or apartment), that isn’t how Americans think. The BLS simply isn’t measuring the cost of shelter in a meaningful way. OER is a flawed concept.

The cost of shelter has risen far more than the 2% suggested by OER over the past year. Using house prices, inflation is really 1% or so higher than reported, even using the Fed’s preferred Personal Consumption Expenditures (PCE) index, which weights OER at 15%. CPI, with a higher OER weighting, would be at least 2% higher. A more representative index would confirm what we already know — inflation is rising.

Because it would make sense to ignore a rise in OER, as it’s a theoretical non-cash expense, and since the Fed doesn’t consider actual home price inflation that affects two thirds of households, it means that inflation in the cost of shelter never impacts monetary policy. A housing bubble led to the 2008 financial crisis, so this is a serious omission that has had negative consequences before. It may again.

It’s often suggested that the government has an incentive to under-report inflation – many transfer payments including social security are indexed. The return on TIPS relies on inflation. Higher inflation automatically drives increased Federal outlays, worsening the fiscal outlook. A government conspiracy to manipulate the numbers is implausible – but it’s also easy to imagine that a junior economist at the BLS contemplating a paper on the weakness of OER might conclude better career moves are available.

Today’s inflation numbers don’t fully reflect the experience of most Americans. It’s time the BLS adopted a more realistic approach.

We are invested in all the components of the American Energy Independence Index via the ETF that seeks to track its performance.


Europe’s Nascent Hydrogen Industry

The inaugural ESG Day is becoming more common. Enterprise Products Partners (EPD) held theirs in early March. Pipeline companies are quite rightly asserting their role in combating climate change. EPD noted the beneficial effects of natural gas in limiting coal consumption.  SVP Tony Chovanek also discussed the growing interest in clean-burning hydrogen. Every energy company that can is talking up hydrogen on their earnings calls, although EPD’s plain spoken CEO Jim Teague noted on their 3Q call in October that, until it’s cheaper to produce, …” this one is going to take a while to develop.”

.avia-image-container.av-q9eknh-80ce7489e78cb7b7ec68550697af75c2 img.avia_image{ box-shadow:none; } .avia-image-container.av-q9eknh-80ce7489e78cb7b7ec68550697af75c2 .av-image-caption-overlay-center{ color:#ffffff; }

As a fuel, hydrogen’s most appealing quality is that when combusted, it generates heat and water. The technology to produce it is well understood, although the cost makes it higher than conventional fuels. Hydrogen is well suited to be moved and stored through existing pipeline infrastructure, which is why today’s energy infrastructure companies are increasingly talking about it if not yet making large scale investments.

The vast majority of hydrogen is produced from natural gas or coal, in an energy-intensive process that produces around 830 million tonnes of CO2 annually. In the color-coded world of hydrogen production, this is known as “grey”. “Blue” hydrogen relies on the same inputs but captures the CO2 emitted in its production. “Green” hydrogen is produced using renewables and offers the potential for emission-free energy if costs can be brought down substantially.

Green hydrogen is produced using electrolysis powered with solar or wind – hence no emissions. It separates the hydrogen molecules from water. It’s currently less than 1% of produced hydrogen, becayuse it’s expensive. The EU’s 2030 Hydrogen Strategy seeks to create a new “green hydrogen” industry producing 40 Gigawatts (GW) of hydrogen by 2030 (versus 0.1 GW now), and 500 GW by 2050. Electrolysis is an energy hog. Goldman Sachs, in a report called Green Hydrogen, noted that at least 2GW of power is required for each 1GW of hydrogen produced. This only makes sense if power is free, or nearly so.

The EU’s hydrogen initiative envisages enormous scale. Goldman Sachs estimates that green hydrogen production could eventually double Europe’s electricity consumption, becoming the region’s largest electricity customer.

Solar and wind are both weather-dependent and unresponsive to demand shifts. Using solar for example during the middle of the day, when the sun’s high and electricity demand dips between the peaks of breakfast and dinner time, could be a good way to store energy that would otherwise be wasted. In the EU, Spain and Portugal would be attractive candidates for using solar to produce hydrogen, as would the SW U.S.

An Italian utility, Snam, has estimated that a hydrogen pipeline from sunny North Africa to Italy could deliver energy at just 13% of the transportation cost of an ultra-high voltage power line.

A U.S. pipeline investor who bears the scars of the increased investment caused by the Shale Revolution might pause at this point. Although the U.S. has no equivalent to the EU’s 2030 Hydrogen Strategy, the Biden administration is surely working on one. In some regions such as southern California, hydrogen is being blended into the natural gas supply.

The last thing U.S. midstream energy infrastructure investors want is another period of increased growth capex. In the EU, a group of gas transport operators estimated that modifying natural gas pipelines to move hydrogen would require €40BN of investment over 20 years, or $2.4BN p.a. In 2018 the U.S. industry spent $45BN on growth capex, so this seems manageable.

Pipeline investors will be relieved to know that hydrogen is well suited to move through natural gas pipelines, though some modifications would be needed.  Hydrogen has nearly twice the energy density of methane, but less than half the energy content by volume, because it’s so light. So more cubic feet of hydrogen are needed to deliver the same energy as natural gas.

Hydrogen burns with an almost invisible flame, by contrast with the familiar blue flame of natural gas. Prolonged exposure to hydrogen can make the steel used in pipelines brittle, although companies like EPD already supply hydrogen to industrial customers so are familiar with that problem. America’s has 1,600 miles of hydrogen pipelines already, with the biggest network located in Texas. Perhaps most interesting is that hydrogen molecules (H2) are small enough to leak through metal if stored for an extensive time. This creates challenges with long term storage, although salt caverns can be repurposed from holding natural gas to hold hydrogen.

In Utah, Intermountain Power Project (IPP) burns coal to generate electricity for southern California. It plans to convert to a 70/30 blend of natural gas (methane) and hydrogen by 2025 and expects to be 100% hydrogen by 2045, aided by hoped for improved technology. The plant is conveniently located atop a vast salt cavern which will be used to store hydrogen. Natural gas power plants can be modified to run on a methane/hydrogen blend, adding further to their clean energy credentials.

The EU’s 2030 Hydrogen Strategy is going to jumpstart a new industry. The existing European pipeline network will be key to European plans for reduced emissions. North American pipeline companies should be well situated for a similar initiative here.

There was some additional clean energy news last week — NextDecade (NEXT), which plans to deliver Liquified Natural Gas (LNG) while capturing the CO2 produced during liquifaction (see Making LNG Cleaner) announced an agreement with Oxy Low Carbon Ventures (a unit of Occidental) to transport and permanently store CO2. Solar panels and windmills are far from the only story in the energy transition.

We are invested in all the components of the American Energy Independence Index via the ETF that seeks to track its performance.


It’s Lonely At The Fed

A series of recent client meetings in south east Florida was good news in two respects – both as evidence that in-person meetings are slowly returning, and because people want an update on the new momentum sector, pipelines. Although in truth all these clients would have extended friendship at any and all times in the past.

Focused as we are on the cheapest sector in the market, one financial advisor revealed that many of his clients are nervous. Stocks look expensive, and bonds more so. Very little seems to offer an attractive long-term return versus risk, although plenty of quick trades are there for the opportunistic.

The message of rising free cash flow and increasing global energy demand resonated (see Pipeline Cashflows Continue Higher). Democrat policies impede pipeline construction and promote higher energy prices, creating a happy alignment of interests between the country’s leaders and energy investors (see Is Biden Bullish For Pipelines?). Dividend yields of 7% suggest stress, although dividends are stable and, in some cases, rising. Buybacks equal to around 2% the sector’s market cap provide further support.

.avia-image-container.av-2x6ro1j-9f2c4aa3c04eb12249510cb31d43bb3f img.avia_image{ box-shadow:none; } .avia-image-container.av-2x6ro1j-9f2c4aa3c04eb12249510cb31d43bb3f .av-image-caption-overlay-center{ color:#ffffff; }

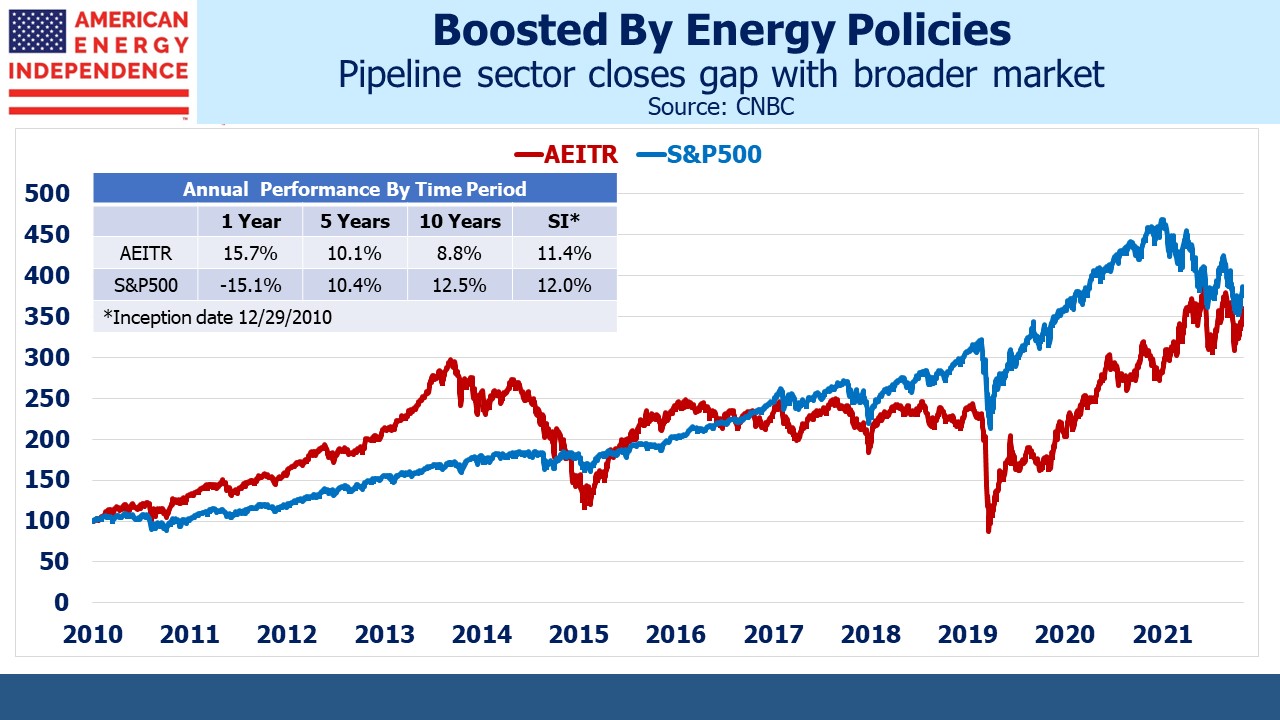
It’s a year since the American Energy Independence Index (AEITR) and other MLP indices made their low. At least closed end funds, one of the causes, destroyed enough capital to lose any future potency (see MLP Closed End Funds – Masters Of Value Destruction). The rebound since then has been breathtaking, with the AEITR returning 182% since March 18, 2020.

.avia-image-container.av-2hhkvh3-195c08006fbc675086a1a5fdc689582d img.avia_image{ box-shadow:none; } .avia-image-container.av-2hhkvh3-195c08006fbc675086a1a5fdc689582d .av-image-caption-overlay-center{ color:#ffffff; }

Even the perennially lagging Alerian MLP Infrastructure Index (AMZIX), tracked by the much-maligned Alerian MLP ETF, has rebounded 153% from its low. The superior return from c-corps versus MLPs is increasingly apparent, since the AEITR (80% c-corps/20% MLPs) is ahead of AMZIX (100% MLPs) over the past one, three and five years. Investors have spoken.

.avia-image-container.av-1x9m647-b96b909218c7a222501d136fa0388489 img.avia_image{ box-shadow:none; } .avia-image-container.av-1x9m647-b96b909218c7a222501d136fa0388489 .av-image-caption-overlay-center{ color:#ffffff; }

It’s increasingly clear that the March 2020 collapse was an aberration. Most of the biggest pipeline corporations reported 2020 full year EBITDA close to guidance they provided before the pandemic. These businesses are more stable than last year’s sellers.

.avia-image-container.av-1ov3tnb-728ebff5ab48c66e8ac70fa3b7485308 img.avia_image{ box-shadow:none; } .avia-image-container.av-1ov3tnb-728ebff5ab48c66e8ac70fa3b7485308 .av-image-caption-overlay-center{ color:#ffffff; }

Some clients are feeling concerned about inflation, although not yet making wholesale portfolio changes. Investments that offer protection are few – on this score, pipelines that are tracking the ten-year year yield higher are one of the better ones. For now it’s the reflation trade, but it may transpose into the inflation trade later this year.

.avia-image-container.av-13e0gmv-c2de7dc206e0d2caf90735952bd1f66a img.avia_image{ box-shadow:none; } .avia-image-container.av-13e0gmv-c2de7dc206e0d2caf90735952bd1f66a .av-image-caption-overlay-center{ color:#ffffff; }

Fed chair Jay Powell is increasingly alone with his equanimity about the inflation outlook. On Monday the National Association for Business Economics (NABE) released their Economic Policy Survey which revealed that almost half the NABE panelists expect the Fed to hike rates next year. A majority sees elevated inflation risk.

Eurodollar futures are more reflective of the NABE outlook than the Fed’s, demonstrating investors’ scant regard for the Fed’s forecasting ability. Jay Powell’s repeated assertions that higher inflation will be temporary and not of concern reflect growing frustration with the market’s dismissive response.

The Fed is simply one more forecaster, and not a good one. But their power over monetary policy is absolute. They can determine whether December 2022 eurodollar futures incorrectly suggest a hike late next next year by holding short term rates steady indefinitely. However, a graceful exit from $120BN of monthly bond purchases becomes harder to envisage as yields move steadily higher.

.avia-image-container.av-sq45rr-504eda1c340d399b0e8fe6053a5857bb img.avia_image{ box-shadow:none; } .avia-image-container.av-sq45rr-504eda1c340d399b0e8fe6053a5857bb .av-image-caption-overlay-center{ color:#ffffff; }

The ECB has responded to rising yields by increasing its bond purchases. The Fed may yet do the same if they feel financial conditions are becoming too restrictive. This starts to look like a central bank defending a currency peg – usually doomed to failure, except that in this case the analogous effort is to prevent the currency going too high.

A central bank trying to cap its currency should always win – after all, they can provide an unlimited supply of it. Similarly, there’s no theoretical cap on the Fed’s capacity to buy bonds. As Modern Monetary Theory (MMT) teaches, a central bank’s balance sheet to finance its own sovereign’s debt is unlimited (see Modern Monetary Theory Goes Mainstream).

It therefore seems unwise to expect interest rates to move higher than the Fed wants (although they may). It’s more sensible to bet on inflation staying higher than they would like. The Fed can’t control inflation, and their efforts to buy the bond market’s silence mean inflation will go higher than it otherwise would.

Right on cue, news leaked of the White House plan to launch a $4 trillion infrastructure/climate change/jobs initiative. This should dispel any lingering doubts that MMT is government policy. If you need further convincing, check out Stephanie Kelton’s The Deficit Myth, the playbook on current fiscal policy. We reviewed it here.

With fiscal and monetary policy synchronized to produce inflation, this is the path of least resistance. Inflation-sensitive assets, of which energy pipelines are a good example, are becoming indispensable to everyone’s portfolio.

We are invested in all the components of the American Energy Independence Index via the ETF that seeks to track its performance.


Making LNG Cleaner

In November, Engie, a French utility, pulled out of discussions with NextDecade Corp (NEXT) to import up to $7BN of Liquified Natural Gas (LNG). It was a big blow to NEXT, which is seeking partners to underwrite its construction of an LNG export facility in Brownsville, TX. Engie concluded that the natural gas sourced by NEXT would be tainted by its involvement in fracking, methane leaks and flaring. It wasn’t consistent with their energy transition goals.

Last week, NEXT launched a new business, NEXT Carbon Solutions (NCS). Their intention is to use Carbon Capture and Sequestration (CCS) to keep 90% of the CO2 generated by their proposed LNG plant as it chills methane in preparation for transfer onto an LNG tanker.

It’s a natural response to the market. Engie’s decision was a wake-up call. Natural gas has a clear edge over coal when it’s burned to generate electricity. But the flaring and methane leaks that are part of natural gas production worldwide are a consideration for some buyers.

Liquifaction of natural gas uses a lot of energy. NEXT plans to use natural gas to power this process, and then capture and store the resulting CO2 emissions in former gas wells. The geology of south Texas is well suited to this. By installing the CCS equipment when the LNG liquifaction facility is built, there are substantial savings compared with adding CCS to an existing facility. NEXT intends to make the clean credentials of its product a competitive advantage.

.avia-image-container.av-4gejii-da6428366bf52d08fd4335c20e2eede1 img.avia_image{ box-shadow:none; } .avia-image-container.av-4gejii-da6428366bf52d08fd4335c20e2eede1 .av-image-caption-overlay-center{ color:#ffffff; }

Interestingly, the added cost is modest, maybe 2% of the price of natural gas based on its U.S. benchmark once tax credits are added. It’s less than 1% of its ultimate delivery cost to European buyers

NEXT is going further, by planning to use Responsibly Sourced Gas (RSG). This will be natural gas whose production has been independently certified as not associated with routine flaring and reliant only on electricity from renewables.

Their goal is to deliver natural gas to customers in Europe and Asia that has generated almost no Global Greenhouse Gases (GHG) on its way to the LNG tanker. Will it make a difference? NEXT is convinced it will.

It’s a logical development. The world has a huge opportunity to substantially reduce emissions by phasing out coal in favor of natural gas. Reducing the emissions involved in producing natural gas makes it even more compelling. NEXT is betting that gas produced with lower GHGs will attract environmentally motivated buyers, presumably an increasing portion of the market.

Over the next couple of years, U.S. GHG emissions will be moving in the wrong direction (see Emissions To Rise Under Democrats). This is partly an unavoidable result of comparisons with last year’s Covid slump in economic activity. But we’ll also be increasing coal consumption relative to natural gas, reversing a very positive trend that has lowered emissions for the past decade. Higher natural gas prices are the reason, since prior coal-to-gas switching by U.S. power plants has been driven by favorable economics.

This will be an uncomfortable result for a Democrat administration that campaigned on reducing emissions. Promoting coal to natural gas switching should become a more visible part of their strategy, both here and overseas.

.avia-image-container.av-uyfj9m-806afe3330fa3386d547c6490d431f38 img.avia_image{ box-shadow:none; } .avia-image-container.av-uyfj9m-806afe3330fa3386d547c6490d431f38 .av-image-caption-overlay-center{ color:#ffffff; }

NEXT includes an interesting slide comparing CO2 emissions that result from the RSG they plan to ship with competing sources. Nord Stream 2, the natural gas pipeline from Russia to Germany, is already controversial. Trump asked why the U.S. maintains troops in Germany to protect against Russia when Germany plans to increase its energy dependence on this potential adversary. There’s no good response to this question, and the Biden administration is similarly opposed to the pipeline’s completion.

Although geopolitics is a strong enough reason for Germany to buy its natural gas elsewhere (such as from the U.S.), the chart above from NEXT’s presentation suggests that different sources of gas come with a different climate impact. Maybe Climate Czar John Kerry can use such data in his discussions with other countries about lowering emissions.

NEXT is a tiny company with big plans. Their latest move may be a last, desperate attempt to sign up enough customers to finance the construction of their LNG facility. Or it may be an important step in the energy transition. If other established companies, such as Cheniere, make similar plans it’ll confirm that NEXT is on to something.

We are invested in all the components of the American Energy Independence Index via the ETF that seeks to track its performance.


Is Biden Bullish For Pipelines?

The Trump presidency was unequivocally good for investors. The S&P500 returned 14.9% p.a. during his four-year term. There will be strong opinions on either side, and we’ll leave that debate for others. But it’s fair to say that this beat the expectations held by many when he was elected.

Energy executives cheered the loudest when Trump won in 2016. This is an industry where Republican views dominate. Few energy investors were expecting such a miserable subsequent four years. Even before Covid decimated crude oil demand, the American Energy Independence Index (AEITR) had returned 3% p.a., versus 16% for the S&P50 through 2019. On the day voters elected Biden, the numbers for Trump’s term were –4.9% and +14.9% respectively.

.avia-image-container.av-2n9nvdh-d9f953d77dbdb06111f87506c6fe189c img.avia_image{ box-shadow:none; } .avia-image-container.av-2n9nvdh-d9f953d77dbdb06111f87506c6fe189c .av-image-caption-overlay-center{ color:#ffffff; }

Trump’s policies were energy-friendly – he eased regulations, pulled out of the Paris climate agreement and promoted American “energy dominance”. The problem was energy executives. They over-invested, over-produced and, in the case of some pipeline companies, overbuilt. The lesson for energy investors is that when management teams get what they want, look out!

.avia-image-container.av-839m9h-a81ab0fff699302ebaa99859366e6942 img.avia_image{ box-shadow:none; } .avia-image-container.av-839m9h-a81ab0fff699302ebaa99859366e6942 .av-image-caption-overlay-center{ color:#ffffff; }

It’s still early to assess the Biden impact on pipelines, but the signs are encouraging. Democrats are naturally anti-fossil fuels, but the ones in power recognize that keeping the lights on is important to staying in office. The energy transition is a long one. We’re not yet fully reliant on intermittent solar and windmills and should hope we never are. Democrat policies are oriented towards constraining the supply of what they dislike, not demand.

.avia-image-container.av-1fs8uid-4ca596ffd3d3eb6e8643801e7312a372 img.avia_image{ box-shadow:none; } .avia-image-container.av-1fs8uid-4ca596ffd3d3eb6e8643801e7312a372 .av-image-caption-overlay-center{ color:#ffffff; }

This is turning out to be investor-friendly. Every energy company has a few ESG slides in their presentation. They all discuss the energy transition. Some are even investing in solar and wind, although wouldn’t unless the IRR on such investments was supplemented by the benefits of a greener image. On their recent earnings call, Energy Transfer (ET) co-CEO Mackie McCrea revealed that, “… we’re struggling with wind quite honestly, it’s hard for us to figure out how to make that work. And we’re not going to do anything that doesn’t make good economic sense for unitholders.” He then added, “I don’t know if we’ll ever get involved as far as investing in a solar project because the returns are …so much less than what we can achieve with other opportunities we have.”

Financial discipline is acting as a constraint against boldly leaping into renewables. At the same time, traditional pipeline projects on a large scale are becoming too risky to contemplate. When Biden canceled the Keystone XL, he reversed a prior executive order approving it and gave scant attention to our ally Canada’s need to find export routes for its crude. TC Energy (TRP) had already brought in the province of Alberta as a partner in case a Democrat president canceled the project. Alberta’s CS1.5BN investment is likely to be lost.

Kinder Morgan (KMI) similarly offloaded the Trans Mountain Pipeline project to the Canadian federal government in 2018 when they tired of navigating Alberta and British Columbia’s conflicting views on its completion (see Canada’s Failing Energy Strategy). Enbridge’s Line 3 Replacement is also at risk from U.S. government opposition, although most expect it to be completed.

Pipeline construction risk has become almost unquantifiable, because Democrat leaders are willing to over-turn previous approvals. Court challenges from environmental extremists can add substantial delays. Renewables projects advance PR objectives, but low IRRs limit their scope. The result is pipeline companies’ assessment of new investments reflect economic and political realites. Democrats have achieved something that long eluded investors, which is to limit growth capex. Smaller projects are still being done. The Energy Information Administration (EIA) yesterday noted new gas pipelines with 4.4 billion cubic feet per day of capacity entered service between November and January.

Reduced capex among upstream companies is constraining oil and gas supply, which is contributing to rising prices. Although pipeline companies have limited direct economic exposure to commodity prices, they reflect sentiment and overall economic activity. High energy prices are good for energy investors.

.avia-image-container.av-uq9w9h-017c8656bed60d54181a3888fe94afe9 img.avia_image{ box-shadow:none; } .avia-image-container.av-uq9w9h-017c8656bed60d54181a3888fe94afe9 .av-image-caption-overlay-center{ color:#ffffff; }

Gasoline prices are well above the $2.57 per gallon average of the Trump presidency and are on the verge of exceeding the range of his four-year term. Since the Administration felt compelled to provide a $1.9TN fiscal boost to the economy, it’s likely that gasoline prices are headed higher. The EIA expects domestic oil production to recover slowly, and for the U.S. to revert to being a net importer of crude next year.

.avia-image-container.av-1bdiomt-817e6606fb2319cd997a165420423ca8 img.avia_image{ box-shadow:none; } .avia-image-container.av-1bdiomt-817e6606fb2319cd997a165420423ca8 .av-image-caption-overlay-center{ color:#ffffff; }

The pandemic dominated energy prices last year and has permanently impacted production. Maybe U.S. output would be on the same modest growth path if Trump had won re-election.

Nonetheless, Democrat policies are oriented towards less spending and higher energy prices, both very pro-investor policies. With the emphasis on impacting supply not demand (i.e. no carbon tax), these trends are likely to continue. They’re consistent with efforts to combat climate change. They’re also good for the energy sector. The Biden administration has become an unwitting friend of pipeline investors.

We are invested in all the components of the American Energy Independence Index via the ETF that seeks to track its performance.

We have three funds that seek to profit from this environment:

Energy Mutual Fund

Energy ETF

Inflation Fund


Pipeline Cashflows Continue Higher

Covid accelerated a trend already in place in the U.S. energy sector, which is to grow Free Cash Flow (FCF) rather than production. Chevron’s Investor Day last week promised 10% annual increase in FCF through 2025. This return to shareholder-friendly metrics is attracting investors – including recently Berkshire Hathaway.

Midstream energy infrastructure has grasped this as readily as their upstream E&P customers. Full year 2020 earnings have been reported. The companies in the American Energy Independence Index, the best representation of the North American pipeline industry, grew FCF to $25BN last year. This is almost three times their 2019 performance, a result that seemed implausible a year ago when Covid drove panic selling.

Continued reductions in growth capex are the reason – Distributable Cash Flow (DCF), equivalent to cash from operations minus maintenance capex, was flat last year. Pre-Covid, DCF was expected to increase from $54BN to $60BN, but Enbridge (ENB), Enterprise Products Partners (EPD), Kinder Morgan (KMI) and TC Energy (TRP) each came in $1BN or more below target. However, capex reductions were widespread during the year, and these largely offset the drop in DCF which is why FCF came in around target.

The result is the bridge chart shown below, which continues to track a path towards higher FCF for the industry. On current trends we should exit 2021 with a FCF yield of over 10%, more than twice the S&P500. Having rallied so far, one might conclude that the sector’s mis-valuation prevailing last year has been eliminated. The FCF yield shows this isn’t the case.

.avia-image-container.av-19hvuaq-6b3c1cbd375ee4a84759d4b9cb768ba0 img.avia_image{ box-shadow:none; } .avia-image-container.av-19hvuaq-6b3c1cbd375ee4a84759d4b9cb768ba0 .av-image-caption-overlay-center{ color:#ffffff; }

The biggest single variable in the industry’s capex figures is Enbridge’s planned replacement of Line 3. This is a 1,000 mile crude oil pipeline oroginally built in the 1960s that runs from Edmonton, Alberta to Superior, Wisconsin. Canada has long struggled to find economic ways to get its crude oil to market. The proposed new pipeline will more than double capacity, from the current 370 thousand barrels a day (MB/D) to 760 MB/D. ENB recently raised the estimated total cost of this project by almost $1BN, to $7.3BN.

Predictably, environmental extremists are opposing the pipeline, although it’s a safe bet that they drive regularly, including to their protests. With Biden having canceled the Keystone XL project shortly after his inauguration, the Line 3 Replacement (L3R) has become a new target. So far, ENB and most analysts expect the project to proceed. Our estimate of 2021 growth capex for the industry is $4.5BN higher than we forecast in December; $3.5BN of this relates to L3R.

For 2022 and beyond, the pipeline sector is on track to further reduce growth capex.

Energy executives provided quarterly updates over the past few weeks, which included updating their capex guidance. On the energy transition, typically they acknowledge it and have plans to reduce their company’s carbon footprint. The prevailing view is that global energy consumption will increase for all forms of energy, including oil and gas.

Consider the following: China’s oil consumption is about two thirds the U.S. But China’s per capita consumption is only 15% of the U.S. Its population is growing at around 0.4% p.a., versus about 0.6% for the U.S. China’s per capita consumption of crude is growing at 4.3%, and total consumption at 4.7%.

.avia-image-container.av-llkh5u-75cf2cb5b7d73bd33eada6b5436ad035 img.avia_image{ box-shadow:none; } .avia-image-container.av-llkh5u-75cf2cb5b7d73bd33eada6b5436ad035 .av-image-caption-overlay-center{ color:#ffffff; }

If China’s per capita oil consumption grows over the next decade at the same rate as it has for the past five years, China would be consuming more than the U.S. if we kept consumption flat. If the U.S. wanted to lower consumption to offset China’s growth, our per capita consumption would need to fall by almost 10% p.a. Currently it’s growing at 0.9%.

Even in this implausible scenario, crude oil consumption is unchanged – it’s simply shifted from the U.S. to China.

This is the daunting math that confronts efforts to reduce emissions. Electric vehicle penetration is higher in China, and they drive around a quarter as many miles as Americans. But 1.4 billion Chinese striving for western living standards is going to require a big adjustment from 330 million Americans, if crude oil consumption and emissions are to fall.

There are many more variables to consider, but this simple example illustrates why Exxon Mobil and Chevron think oil still has a future.

We are invested in all the components of the American Energy Independence Index via the ETF that seeks to track its performance.


Electric Vehicles Are Picking Up Speed

Last month saw U.S. Electric Vehicle (EV) sales up 40% year-over-year. Every Tesla owner I know loves their car – although the February jump was helped by the launch of Ford’s Mustang Mach-E. EV market share (which includes hybrids as well as all-electric vehicles) rose from 1.8% to 2.6% in February. Nonetheless, EV sales fell last year due to Covid, from 331K to 296K.

Forecasts of booming EV sales are so common as to scarcely be news anymore. It’s possible to go back and find old forecasts that were way off. This one from 2011 looking ahead to 2020 includes a few the authors would like us to forget. Deutsche Bank’s forecast of U.S. sales was off by 2X. However, McKinsey’s global estimate was only slightly high.

David Victor recently published Energy Transformations in association with Engine No. 1, the activist investor pushing for Exxon Mobil to respond more quickly to the energy transition. The chart below is from his report – the small chart in the inset is a 1992 forecast from Shell on EV sales which has turned out to be wildly inaccurate. But the point of the main chart is that sales really are going to take off over the next decade.

.avia-image-container.av-rhn2te-3222684b34a5f844307cf912a236bfb8 img.avia_image{ box-shadow:none; } .avia-image-container.av-rhn2te-3222684b34a5f844307cf912a236bfb8 .av-image-caption-overlay-center{ color:#ffffff; }

It’s possible to find other old forecasts that were wildly inaccurate. Futurist Tony Seba predicted in 2017 that by 2030 100% of auto sales would be autonomous (self-driving) EVs (see A Futurist’s Vision of Energy). It’s still nine years away, but for autonomous EVs in the U.S. to reach that level would require their market share to double approximately every 20 months.

Growth in renewables and EVs have been about to break out for years. The world will need more energy – the U.S. Energy Information Administration (EIA) expects global energy consumption to increase by 50% over the next three decades. They expect every source to increase, including coal.

High among Elon Musk’s many talents is marketing, because he’s successfully linked EVs with clean energy in the minds of consumers. America generates around 60% of its power from coal and natural gas, with renewables (including hydro) and nuclear each providing around a fifth.

There are substantial variations – California is required to reach 100% emission-free power by 2050, and is about two thirds of the way there, even if their grid sometimes fails (see California Dreamin’ of Reliable Power). The state leads in EV sales. But Wyoming residents who buy a Tesla thinking they’re contributing to a cleaner planet overlook that over 80% of the state’s power comes from coal.

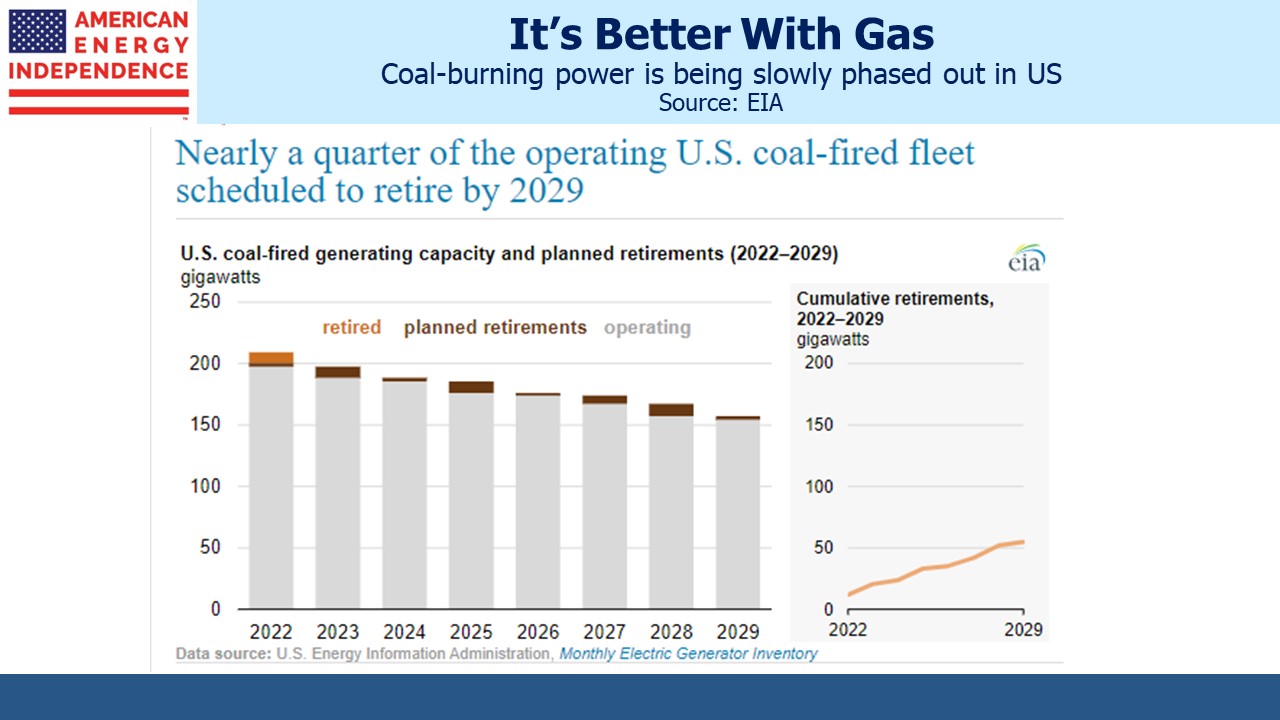
America’s coal consumption is heading in the wrong direction – the EIA expects coal’s market share of power generation to rise from 20% last year to 23% this year and next, matching the growth in renewables. Some of the growth in coal is due to higher natural gas prices – Democrat policies are intended to raise energy prices, although using more coal is an unintended result. And nuclear continues to drop, which is a big missed opportunity.

EV sales globally reached a 6.9% market share last year. President Biden is planning for the U.S. government to only buy EVs in the future. As my partner Henry pointed out, today’s internal combustion engine automobiles are built around a small power generator, which does seem less efficient than simply a battery.

Although insufficient charging stations and the time required to recharge remain impediments for many buyers, these challenges can be surmounted. A battery that lasted an entire day’s drive would certainly help. There are also fewer moving parts, which keeps maintenance costs down. And every EV owner loves the acceleration.

EVs are selling because they’re providing consumers what they want, and are growing market share as a result. By contrast, growth in renewable energy is more reliant on utilities increasing the portion of the power they supply from solar and wind. The absence of a carbon tax from the Democrats’ planned clean energy legislation reveals that, although many voters express concern about climate change, they’re unwilling to spend much to solve the problem.

Meanwhile, pipeline operators such as Williams Companies (WMB) have found that increased use of renewables is boosting natural gas demand – weather-dependent power needs something reliable when it’s not sunny and windy.

Increased EV penetration is part of the electrification of the transportation sector. Since natural gas remains America’s biggest source of power generation, this trend will tend to constrain growth in crude oil demand in favor of natural gas, although the impact remains years in the future. In emerging countries, EV growth adds to the urgency to lower their dependence on coal for power generation. The energy transition continues to rely on natural gas.

We are invested in all the components of the American Energy Independence Index via the ETF that seeks to track its performance.