Bond Market Corrects Fed
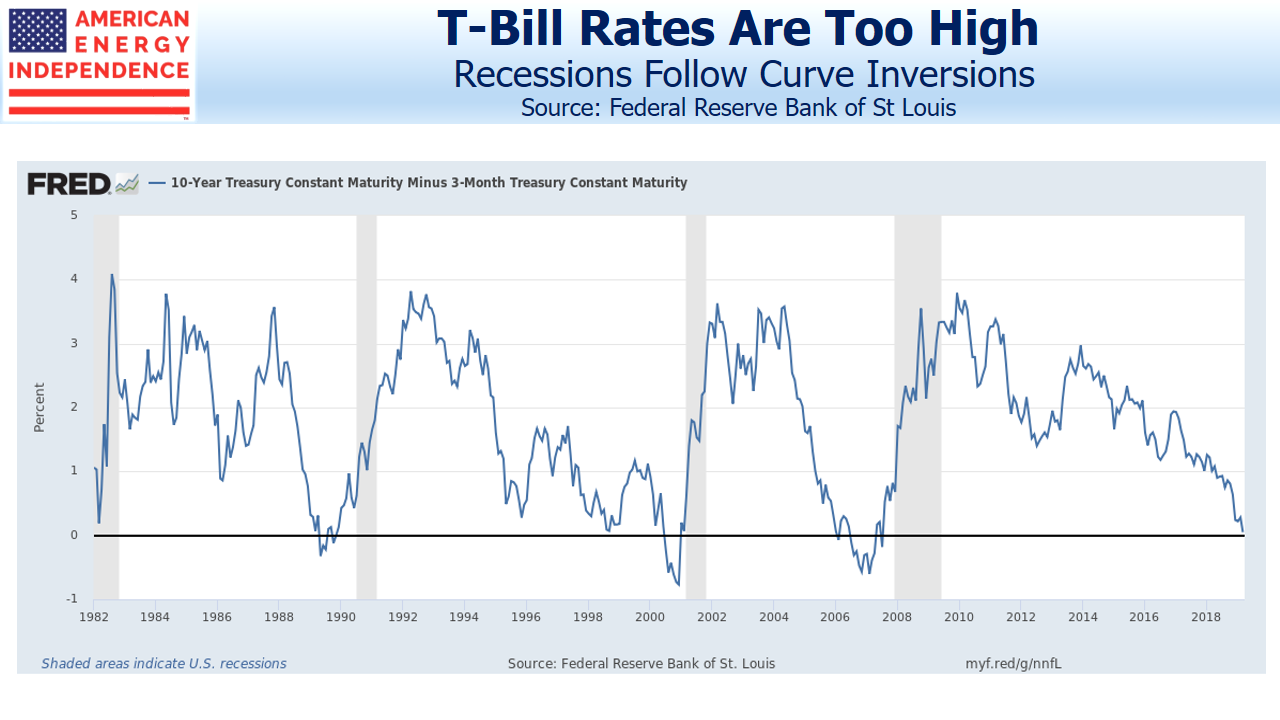
Last week stocks shuddered as ten year yields dipped below treasury bills, reminding investors that yield curve inversions eerily precede recessions. A Cleveland Fed model using the yield curve gives a 30% probability of a recession within a year, up from 24% in December. Nonetheless, the S&P500 is within 5% of its all-time high, reflecting only modest concern.
A reliable point of agreement with any 15+ year market veteran is surprise at consistently low long term interest rates. We’ve all spent our entire careers fretting over the Federal deficit and the possibility that it could drive borrowing costs higher. Now it looks as if the peak in ten year yields for this cycle of 3.2% is lower than the prevailing yield prior to the 2008 recession.
Explanations include foreign central bank buying, even while the Fed unwinds its quantitative easing by allowing its balance sheet to shrink. And U.S. yields of 2.4% remain rich by comparison with other G-7 nations. Germany’s recently turned negative, along with $10TN of government debt globally.
There’s been a fundamental shift in the demand for long term bonds. Foreign buyers hold $6 TN of treasuries, around 39% of what’s publicly held. Japan and China each hold over $1 TN. Even though foreign central banks are regarded as price-insensitive buyers of bonds, that still leaves a lot of commercially driven holders who have accepted today’s low yields by choice.
Historically, the long term real return on ten year notes is 2%. The Fed’s inflation target has never wavered from 2%, and there’s been little reason for investors to anticipate anything less. 2% inflation plus a 2% historic real return implies 4% as neutral, a level never broached in the past decade.
Since the ten year treasury yield reflects the market’s forecast of short term rates over the next decade, the conclusion is that the Fed’s equilibrium short term rate is lower than in the past.
The FOMC has turned out to be very poor at predicting the near term path of short term rates, even though they control them (see Bond Market Looks Past Fed). Short term treasury yields have consistently been below the “blue dots” in the FOMC projection materials. Forecasting the Fed’s moves by looking at the yield curve has been more reliable than listening to the Fed.
The central tendency of the Fed Funds rate (i.e. long term neutral rate) in the latest FOMC projection materials is 2.5-3.0%. Their target for next year is 2.9-3.4%. These are both too high and likely to be wrong again. Rather than the inverted yield curve forecasting a recession, it’s more likely that the market is correcting FOMC forecasts farther out along the curve. Maybe the FOMC should give up forecasting altogether, and simply set the Fed Funds rate at 0.25% below the ten year, allowing the market to determine the appropriate level of rates.
The curve inversion isn’t forecasting a recession, it simply means the FOMC has set the Fed Funds rate too high. The more it inverts, the more wrong they are. The best response is to alter the yield curve’s forecast, by lowering short term rates. That’s their likely next move, although for now they’re on hold.
The flat yield curve is good news for energy infrastructure. We’re often asked how we think the sector will perform in an environment of higher rates. While we typically note the inflation-plus pricing built into many pipeline contracts, falling long term yields can only make MLPs and energy infrastructure corporations’ dividend yields even more attractive. There’s one less thing to worry about.
SL Advisors is the sub-advisor to the Catalyst MLP & Infrastructure Fund. To learn more about the Fund, please click here.
SL Advisors is also the advisor to an ETF (USAIETF.com)
