Pipelines Moving Up and Left: More Return With Less Risk

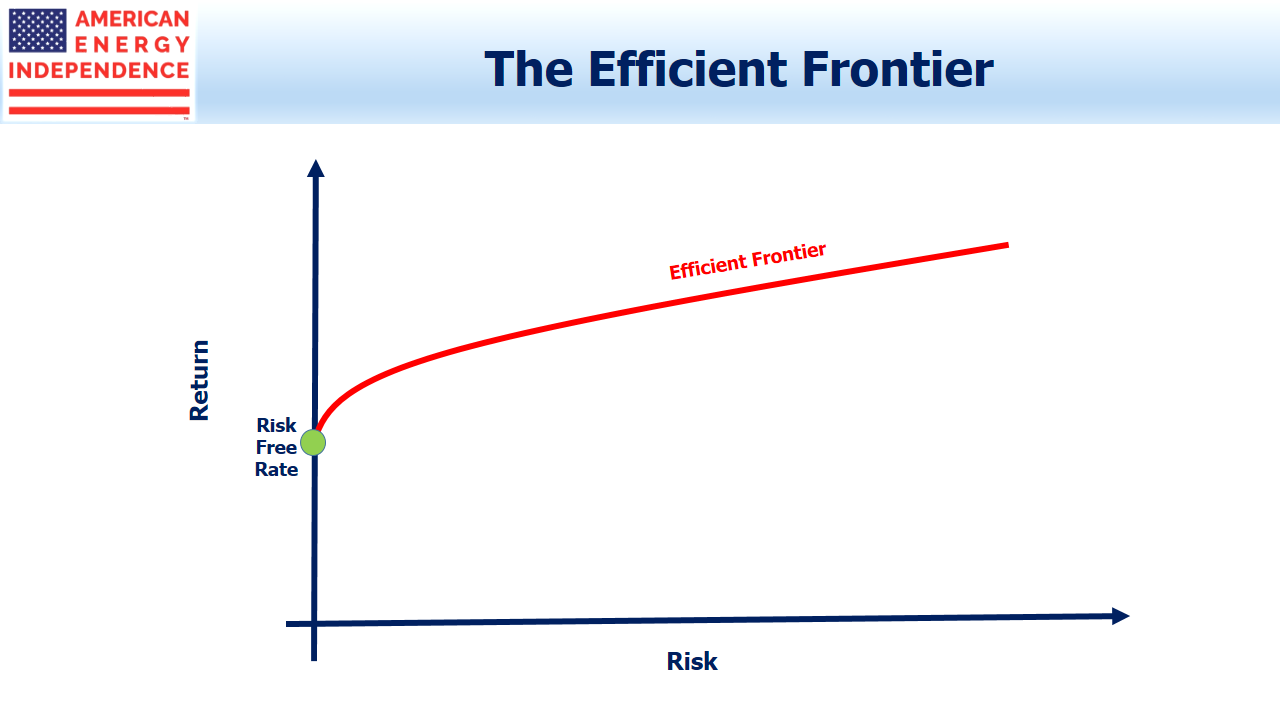
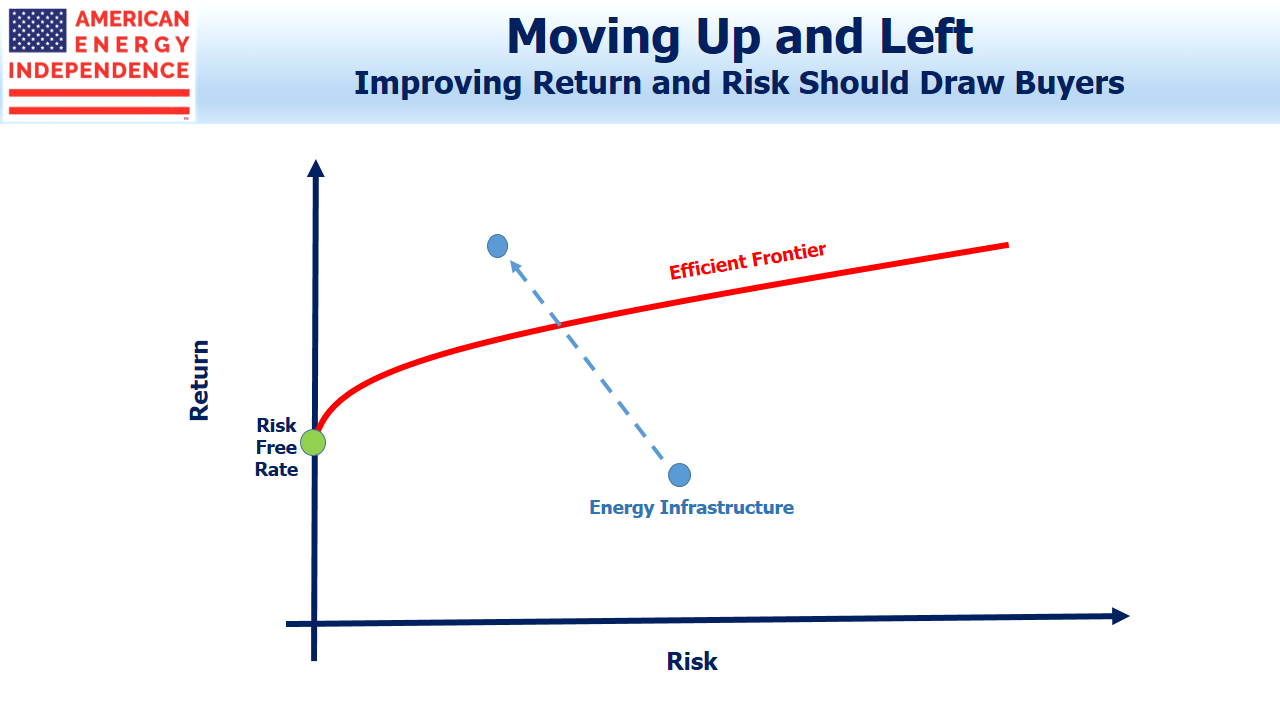
The Capital Asset Pricing Model (CAPM) is a widely accepted theoretical framework for valuing securities. An important feature is the Efficient Frontier. This reflects the concept that, although there’s an almost infinite number of portfolios that an investor can hold (think of all the individual stocks and bonds out there), a small number of these portfolios offer a combination of return and risk that’s better than most.

.avia-image-container.av-1jtknlr-c42306d2944266bda8e1d4f788fca4ef img.avia_image{ box-shadow:none; } .avia-image-container.av-1jtknlr-c42306d2944266bda8e1d4f788fca4ef .av-image-caption-overlay-center{ color:#ffffff; }

Efficient Frontier

For example, if two portfolios had the same risk, the one with the higher return would be preferable. We can always figure out with hindsight what was the efficient portfolio — identifying the right one going forward is more difficult.

CAPM is a useful theoretical framework but has its shortcomings. One of the biggest is the idea that more risky investments deliver a higher return. It seems intuitively self-evident, but there’s plenty of research to show it’s not true. Beta, a measure of how risky a stock is compared to the market (which has a Beta of 1.0), suggests that high beta stocks (Beta > 1.0) should deliver higher returns than the market. Otherwise, investors wouldn’t own high beta stocks because they wouldn’t be getting sufficiently compensated for the increased risk.

The real world often fails to conform to neat algebraic solutions, and it turns out that low beta stocks do better. They don’t move as much and offer less excitement. Low Beta stocks receive less coverage on CNBC, since traders want movement. But they are Aesop’s tortoise, reaching the finish line ahead of their more energetic competition.

This weakness in CAPM is called the Low Beta Anomaly, and for those interested in learning more you can read Why the Tortoise Beats the Hare.

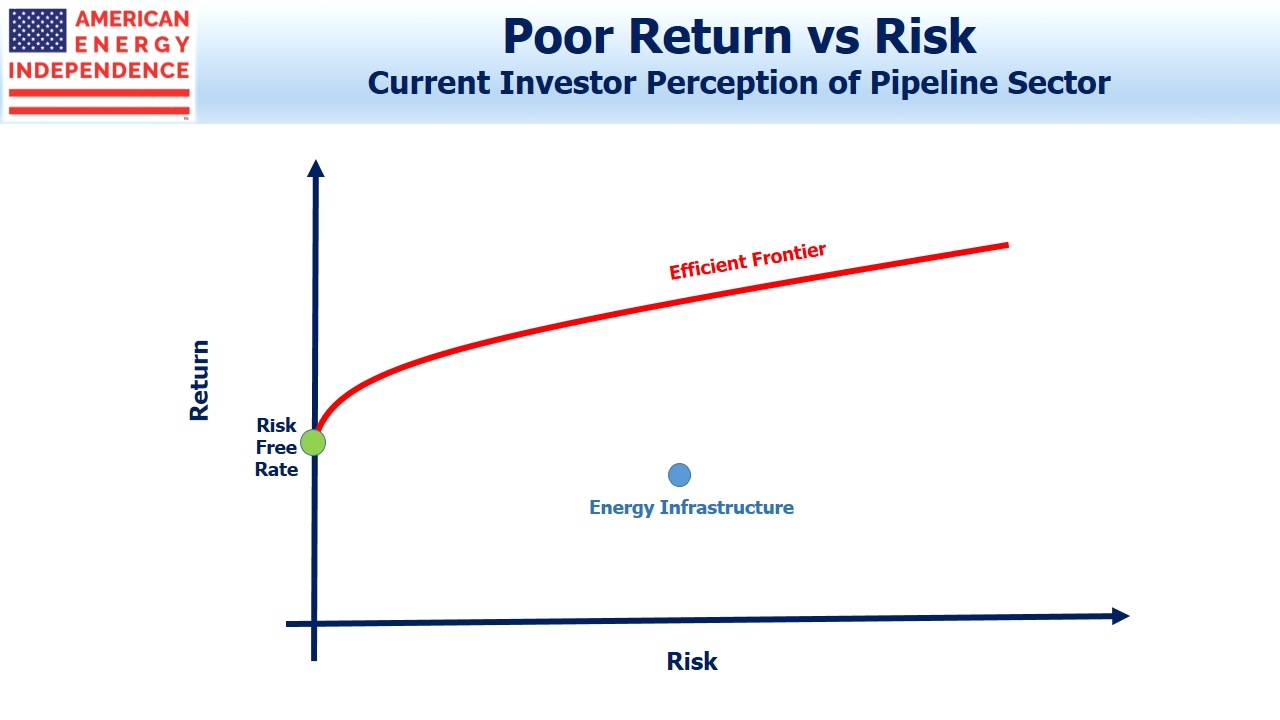
Returning to the Efficient Frontier, although we can’t be certain what investments provide the most CAPM efficiency, we can make informed assumptions about whether they’re becoming more or less attractive within this framework. Investors complain about heightened volatility in midstream, and likely assume more of the same in assessing the sector. For many, Energy infrastructure sits well within the Efficient Frontier boundary, making it unattractive.

.avia-image-container.av-13ml01r-27558b4ab18aa83f4e94b693c2f222c2 img.avia_image{ box-shadow:none; } .avia-image-container.av-13ml01r-27558b4ab18aa83f4e94b693c2f222c2 .av-image-caption-overlay-center{ color:#ffffff; }

Investor Perspective of Pipeline Sector

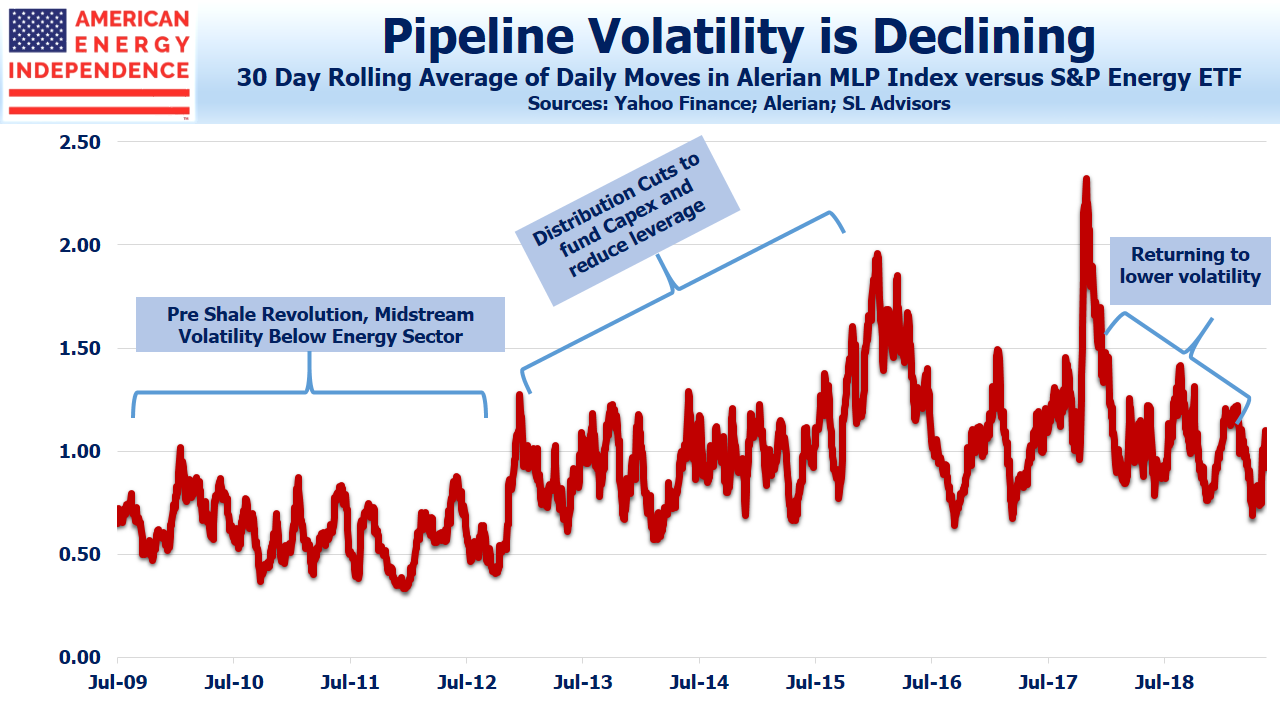
But Energy Infrastructure, as we wrote last week (see Pipeline Stocks Get That Warm Feeling Again), is becoming less volatile, especially when compared with broad energy as represented by the S&P Energy ETF (XLE). On the Efficient Frontier chart, this is moving it to the left, meaning it’s becoming less risky.

.avia-image-container.av-16mtltr-9041e16eb310678e692109337743a043 img.avia_image{ box-shadow:none; } .avia-image-container.av-16mtltr-9041e16eb310678e692109337743a043 .av-image-caption-overlay-center{ color:#ffffff; }

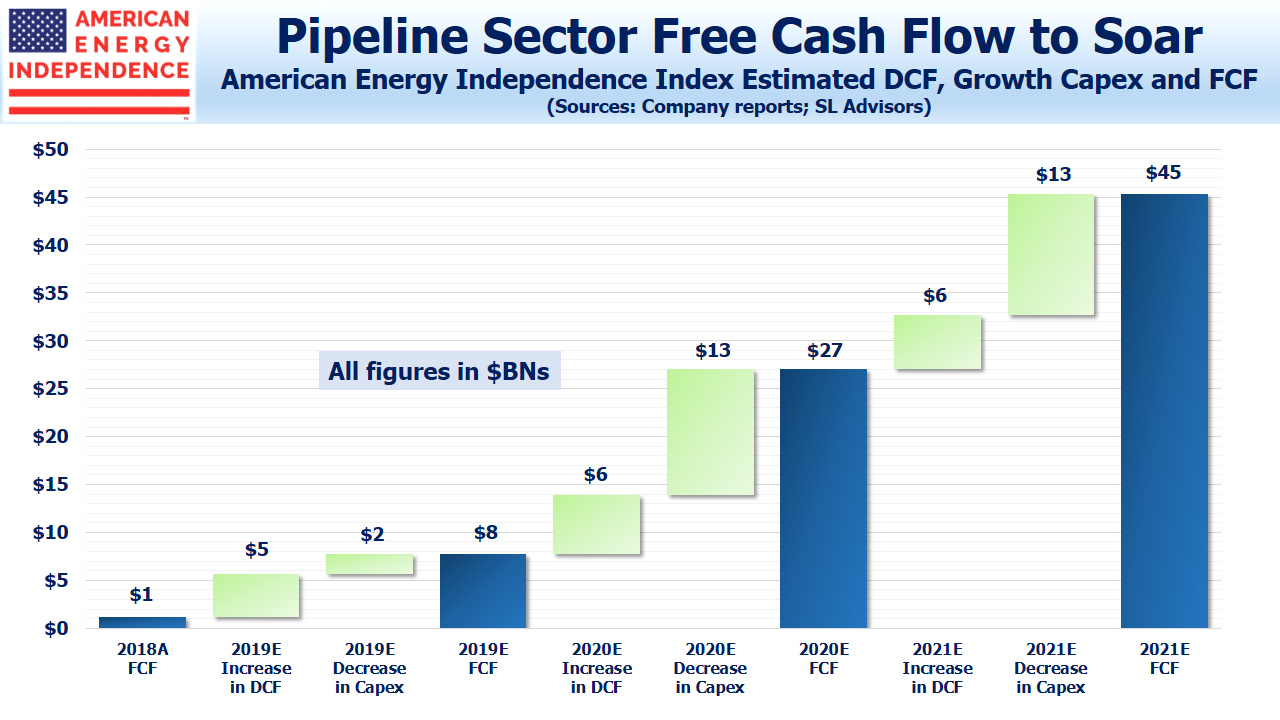
Returns are also improving, as defined by Free Cash Flow (FCF) generation. We wrote about this a few weeks ago (see The Coming Pipeline Cash Gusher). The members of the broad-based American Energy Independence Index generated just $1BN in FCF last year, which is an inconsequential return on around $540BN in market cap. However, a combination of lower spending on new projects (lower growth capex) plus improving cash flow from existing assets (higher Distributable Cash Flow, DCF) is set to boost sector FCF significantly over the next three years. By 2021 the $45BN in FCF we estimate would produce a FCF yield of over 8%, higher than the S&P500.

.avia-image-container.av-2qd2lb-210d437efabed3d168d3c6a355352484 img.avia_image{ box-shadow:none; } .avia-image-container.av-2qd2lb-210d437efabed3d168d3c6a355352484 .av-image-caption-overlay-center{ color:#ffffff; }

Pipeline Sector Free Cash Flow

Making volatility forecasts is an imprecise task, and most investors will be satisfied with using historical data. This shows decreasing volatility, or risk. But it’s certainly possible to make return forecasts and they don’t need to have any relationship with recent history. Rising FCF should persuade investors that their return assumption for the sector can be revised up.

In the context of CAPM, higher return with less risk mean that the sector is shifting up and to the left, making it more attractive. The Efficient Frontier is a theoretical concept, and investments selected from along that line can all be judged efficient, with the different combination of return and risk reflecting investor preference.

.avia-image-container.av-lzdmqn-a7b1ac7a87c223dfcb5917d670ff2dc7 img.avia_image{ box-shadow:none; } .avia-image-container.av-lzdmqn-a7b1ac7a87c223dfcb5917d670ff2dc7 .av-image-caption-overlay-center{ color:#ffffff; }

Improving Return and Risk

As this virtuous combination of rising return with falling volatility becomes apparent, we think some investors will conclude that midstream energy infrastructure lies beyond the Efficient Frontier. This should attract inflows from investors who use this type of framework to assess opportunities.

When CAPM provides a buy signal, the much-sought generalist investor will have finally turned to pipelines. Over the next couple of years, the sector should benefit from this development.

SL Advisors is the sub-advisor to the Catalyst MLP & Infrastructure Fund.  To learn more about the Fund,  please click here.

SL Advisors is also the advisor to an ETF (USAIETF.com).


Why You Should Only Buy China Through the S&P500

Last week’s article by Jason Zweig (see Think Before You Fish for Bargains in Chinese Stocks) caught my eye, because it warns against investing in Chinese stocks with the expectation of high GDP growth driving high equity returns. A major reason investors allocate to emerging economies is because they expect that relationship to reward them, although there’s plenty of evidence that it doesn’t work.

Zweig references a 2004 academic paper (Economic growth and equity returns) which highlighted one important reason: GDP growth can be driven by technological innovation among new, private companies. This does nothing for current investors in public equities. Technological improvements are usually good for consumers but less often for public companies, unless they can exploit their advantage without meaningful competition. The true driver of returns comes from earnings paid out as dividends, and the return on retained earnings that are reinvested back in the business. Chinese public companies have been poor at the latter.

Moreover, the market cap of the MSCI China stock index has grown largely through new equity issuance. So global investors who allocate passively based on market size are induced to increase their China exposure, even though returns on invested capital have been poor.

A 2010 paper from MSCI Barra (Is There a Link Between GDP Growth and Equity Returns?) similarly found no meaningful connection between the two.

Jason Zweig generously concludes that Emerging Markets (EM) investing can still make sense if a country’s market looks cheap. But if GDP growth doesn’t correlate with equity returns, the justification for an EM investment becomes weak. What’s left is a tactical move based on what looks like temporarily weak pricing. That’s not a long term strategy for most people.

American investors are accustomed to a market with the world’s toughest rules all designed to promote fairness. Protecting investors from bad actors lowers the overall cost of equity, which does boost GDP growth. But it’s easy to assume that America’s standards are global, which they are not. I remember some years ago chatting with a senior regulator from the Reserve Bank of India. I asked him how many insider trading cases are typically prosecuted in a year, to which he replied, “None. There is no insider trading in India.”

Or the hedge fund friend who described how two or three Mumbai-based hedge funds would trade a small local stock amongst themselves, generating volume and a higher price. This would attract, “the New York hedge funds” in search of a rising stock with good liquidity. Having hooked one, the local hedge funds would dump the stock on the naive foreigner (see The Hedge Fund Mirage, pg 42).

An emerging market doesn’t mean the participants are unsophisticated – in fact, the comparative absence of rules mandates more highly attuned street smarts than is required in developed markets.

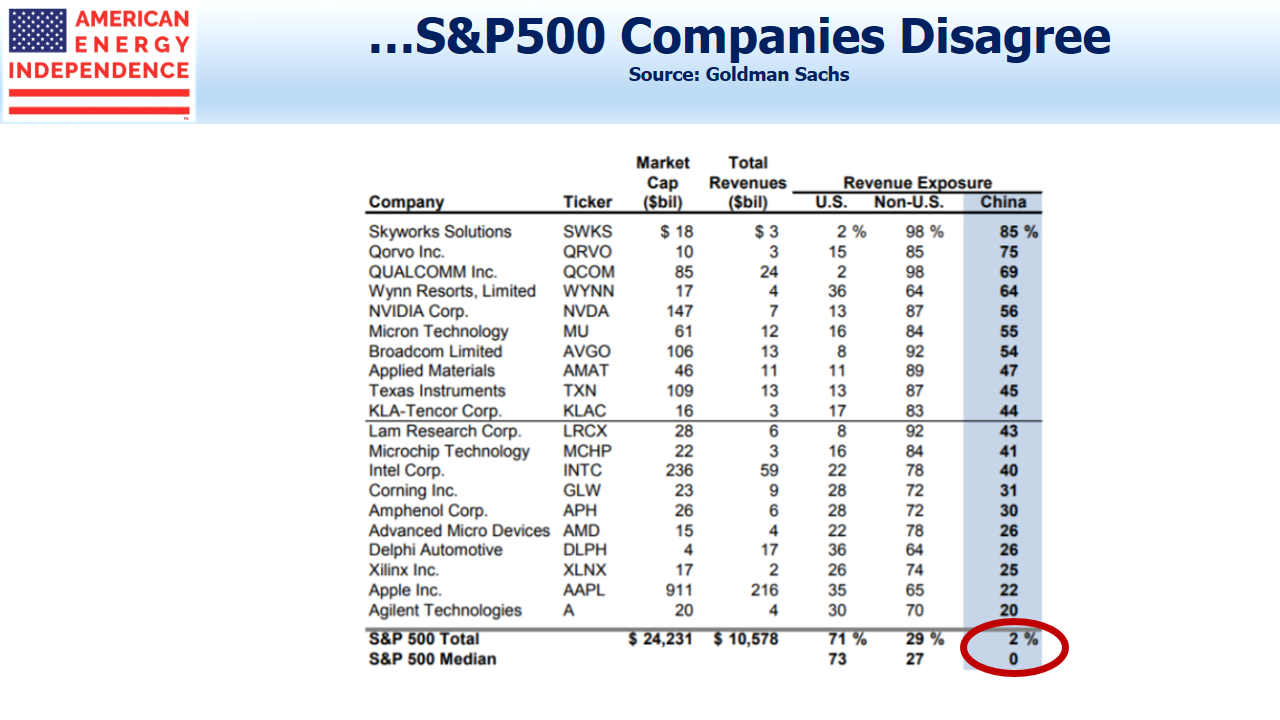
Almost every company in the S&P500 does business in China and other emerging economies. They are infinitely better suited to allocate their capital where returns are highest. They’re far better equipped to protect their property and future cashflows from nefarious activity. This means that an investment in a broad portfolio of U.S. stocks includes exposure to the growth of emerging economies. And the portion of that portfolio’s overall EM exposure is the aggregate of hundreds of capital allocation decisions by the senior executives of those companies.

.avia-image-container.av-kmz38q-98fe9b947a1bcad16a2d2a0f5d0389ce img.avia_image{ box-shadow:none; } .avia-image-container.av-kmz38q-98fe9b947a1bcad16a2d2a0f5d0389ce .av-image-caption-overlay-center{ color:#ffffff; }

China's Global Market Cap

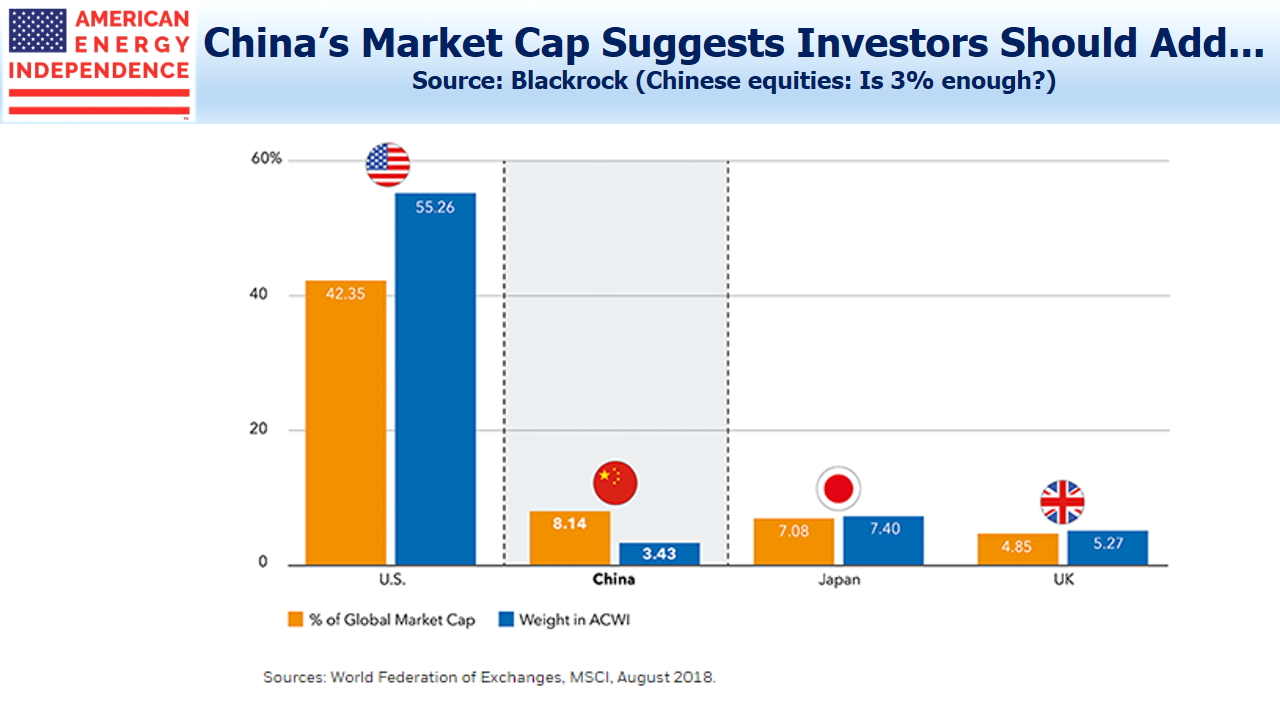
Blackrock published a paper last year suggesting that China’s 8% global weighting should drive an investor’s China allocation. But this seems too simplistic. The S&P500 derives 2% of its revenues from China. 500 management teams from America’s biggest companies have collectively arrived at 2% as the optimal exposure. An investor who deviates from this 2% figure needs a good reason. Size of market is not one of them, because Jason Zweig’s article shows that most of the growth in China’s equity market cap has come from new issuance, not appreciation. Blackrock’s suggestion ignores the conclusion of hundreds of companies doing business there that have settled on 2%. And when they collectively decide to go to 3%, your exposure will change without you having to think too hard about it.

.avia-image-container.av-165m6fe-fd8e2cf0f044669c9994f4fd1fc48fb4 img.avia_image{ box-shadow:none; } .avia-image-container.av-165m6fe-fd8e2cf0f044669c9994f4fd1fc48fb4 .av-image-caption-overlay-center{ color:#ffffff; }

SP500 China Exposure

Relying on the S&P500 to determine your EM exposure must surely be better than simplistically relying on market cap or trying to figure it out yourself. Simple can be better, and in investing it usually is. Invest in America’s global companies. Let them allocate to EM for you. Stay away from EM funds. You’ll sleep better, and the research shows you’ll get better results too.

SL Advisors is the sub-advisor to the Catalyst MLP & Infrastructure Fund.  To learn more about the Fund,  please click here.

SL Advisors is also the advisor to an ETF (USAIETF.com).


Pipeline Stocks Get That Warm Feeling Again

A common concern of both existing and potential investors in energy infrastructure is the relatively high volatility of recent years. Many recall the “toll-model” of pipelines that was the basis of their appeal prior to 2014. As we have often written, the Shale Revolution broke the MLP model, as companies with very high payout ratios and hitherto minimal growth projects set about adding infrastructure. Oil in North Dakota, natural gas in Pennsylvania and increasing volumes of crude in west Texas required new investments (see It’s the Distributions, Stupid). The income-seeking investors originally attracted by high yields wound up in growth businesses that prioritized reducing leverage and funding projects over maintaining distributions.

Our theory is that this one-time alienation of the core investor base was highly disruptive and led to a period of heightened volatility. The shift in MLP business model from income generating to growth coincided with a sharp downturn in the energy sector. Investors worried about the profitability of upstream exploration and production companies showed similar concern over midstream. Even though EBITDA grew and leverage fell for pipeline stocks during this period, the sector moved with the energy sector.

.avia-image-container.av-24lyiz5-792c5661bd10bdef650fcfdd7fdd4203 img.avia_image{ box-shadow:none; } .avia-image-container.av-24lyiz5-792c5661bd10bdef650fcfdd7fdd4203 .av-image-caption-overlay-center{ color:#ffffff; }

There are signs that this period of heightened volatility is coming to a close. When energy markets bottomed in early 2016, the average daily percentage move of the Alerian MLP index reached almost 2.0X that of the S&P Energy Sector ETF (XLE). In late 2017 the ratio was briefly even higher. Since then, this relationship has improved dramatically in favor of these toll-like business models, falling by more than half and approaching the range that prevailed 7+ years ago.

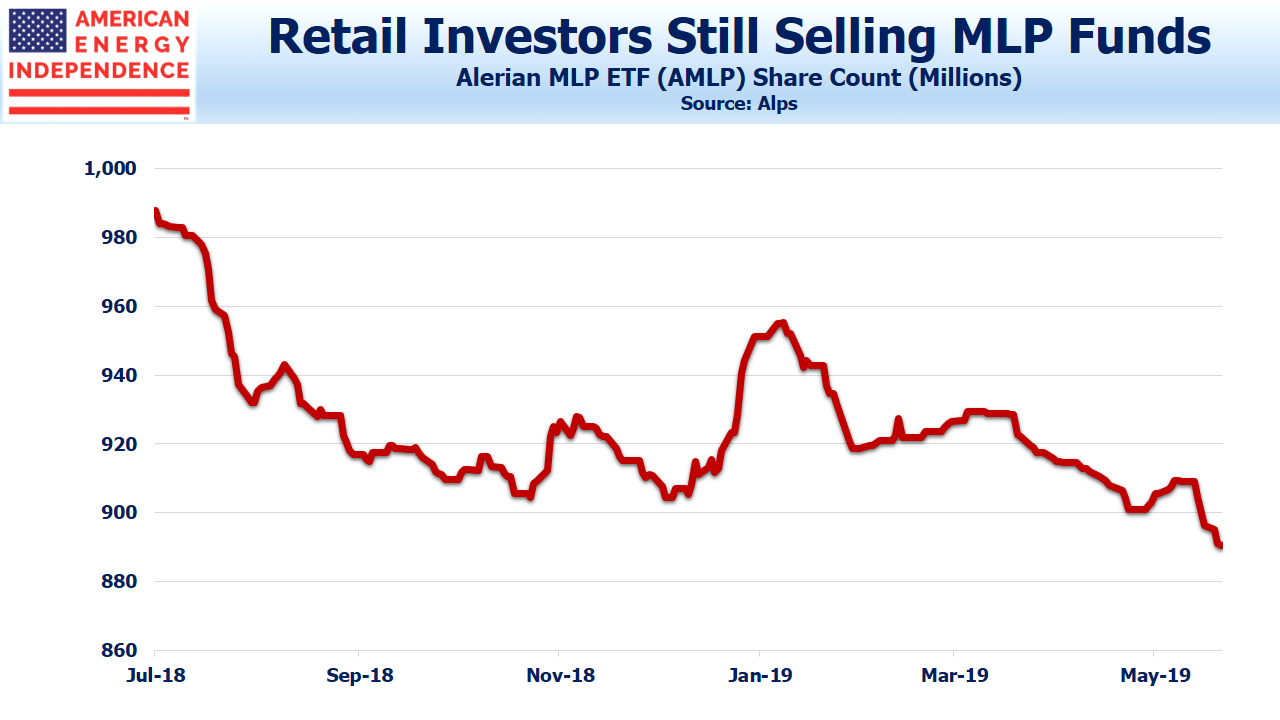
This shift is even more dramatic than it seems, because the Alerian MLP index has been steadily losing components, rendering it less diversified and therefore more prone to sharp moves than it would otherwise be. Investors continue to exit mutual funds and ETFs tied to MLPs, as shown by the steady drop in shares outstanding for the Alerian MLP ETF.

.avia-image-container.av-1879hxt-8a5224d9f6612ae50f53a8268f0a5c3b img.avia_image{ box-shadow:none; } .avia-image-container.av-1879hxt-8a5224d9f6612ae50f53a8268f0a5c3b .av-image-caption-overlay-center{ color:#ffffff; }

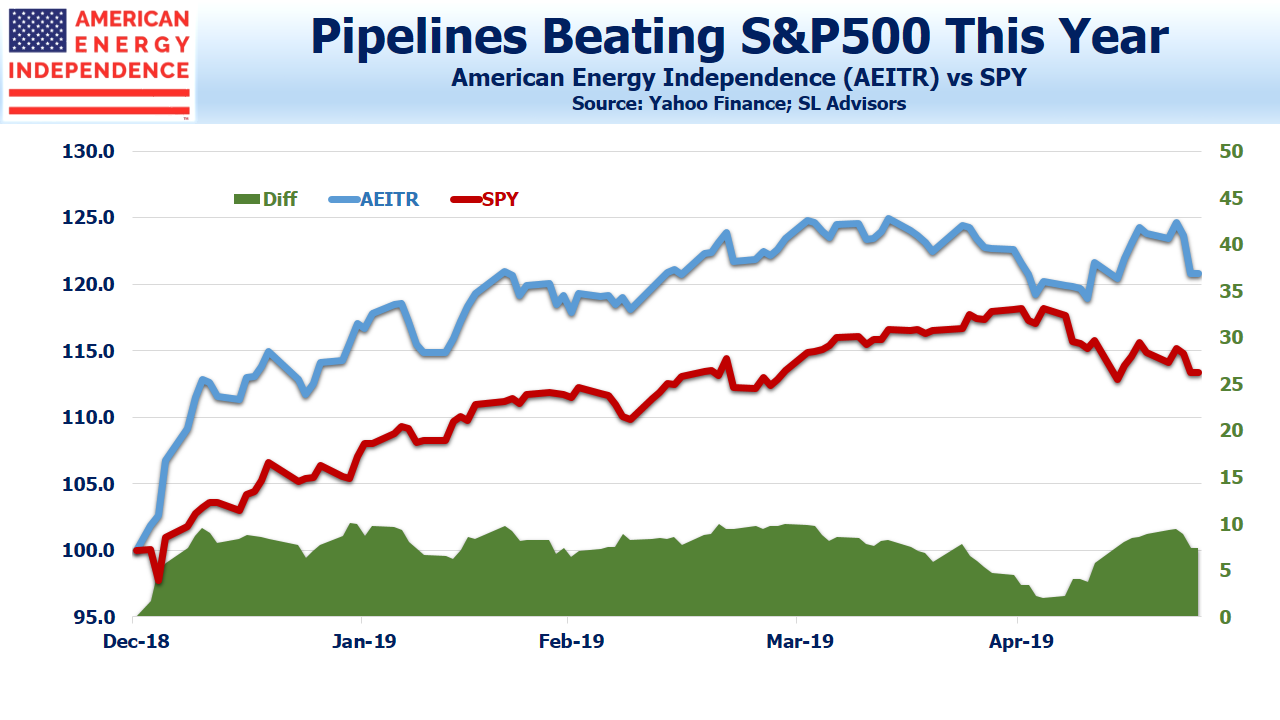
Pipelines Beating SP500

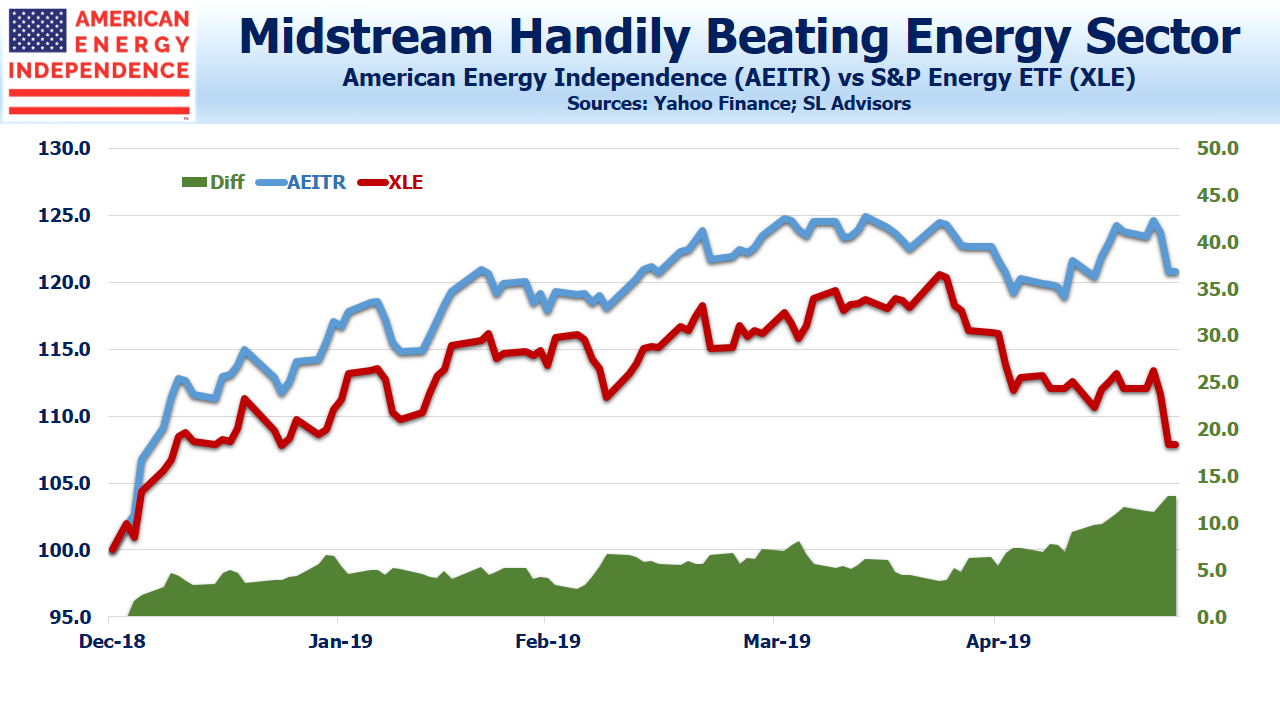
Nonetheless, relative performance for the sector more broadly defined to include corporations has held up very well. The American Energy Independence Index (80% corporations and 20% MLPs, more reflective of the sector’s market cap of 2/3rds corporations) has retained its solid lead over the S&P500 this year, and is substantially ahead of XLE, especially following last week’s market weakness.

.avia-image-container.av-1nin19t-2a131dbd20a6484d3511efa0ba7ec159 img.avia_image{ box-shadow:none; } .avia-image-container.av-1nin19t-2a131dbd20a6484d3511efa0ba7ec159 .av-image-caption-overlay-center{ color:#ffffff; }

Midstream beating XLE

A plausible explanation is that, although retail investors are shunning MLP-only funds, institutional buyers are beginning to commit capital to pipeline corporations. Converting from MLPs to corporations was driven by a desire for a broader, more stable investor base. Although there are fewer MLPs remaining, they include conservatively run companies such as Enterprise Products Partners (EPD) and Magellan Midstream (MMP). There are some good MLPs to own.  However, some investors are starting to conclude that MLPs are too small a subset to command a sector allocation, and they’re more appropriate within a diversified portfolio that includes corporations.

.avia-image-container.av-n5coup-e1e1980f62113e94f5c1a88a98e45058 img.avia_image{ box-shadow:none; } .avia-image-container.av-n5coup-e1e1980f62113e94f5c1a88a98e45058 .av-image-caption-overlay-center{ color:#ffffff; }

Retail Investors selling MLPs

The relative volatility of midstream infrastructure is reverting back to the lower levels that prevailed before the Shale Revolution triggered the need for large infrastructure investments. Moreover, free cash flow is set to jump over the next three years (see The Coming Pipeline Cash Gusher). This will continue to attract generalist investors interested in attractively valued stocks with declining volatility.

The pipeline sector is showing good momentum to continue its outperformance, driven by institutional buyers gradually replacing the retail holders of narrow, MLP-only funds.

We are invested in EPD and MMP. We are short AMLP.

SL Advisors is the sub-advisor to the Catalyst MLP & Infrastructure Fund.  To learn more about the Fund,  please click here.

SL Advisors is also the advisor to an ETF (USAIETF.com).


Fanatics Protest From a Steel Cell

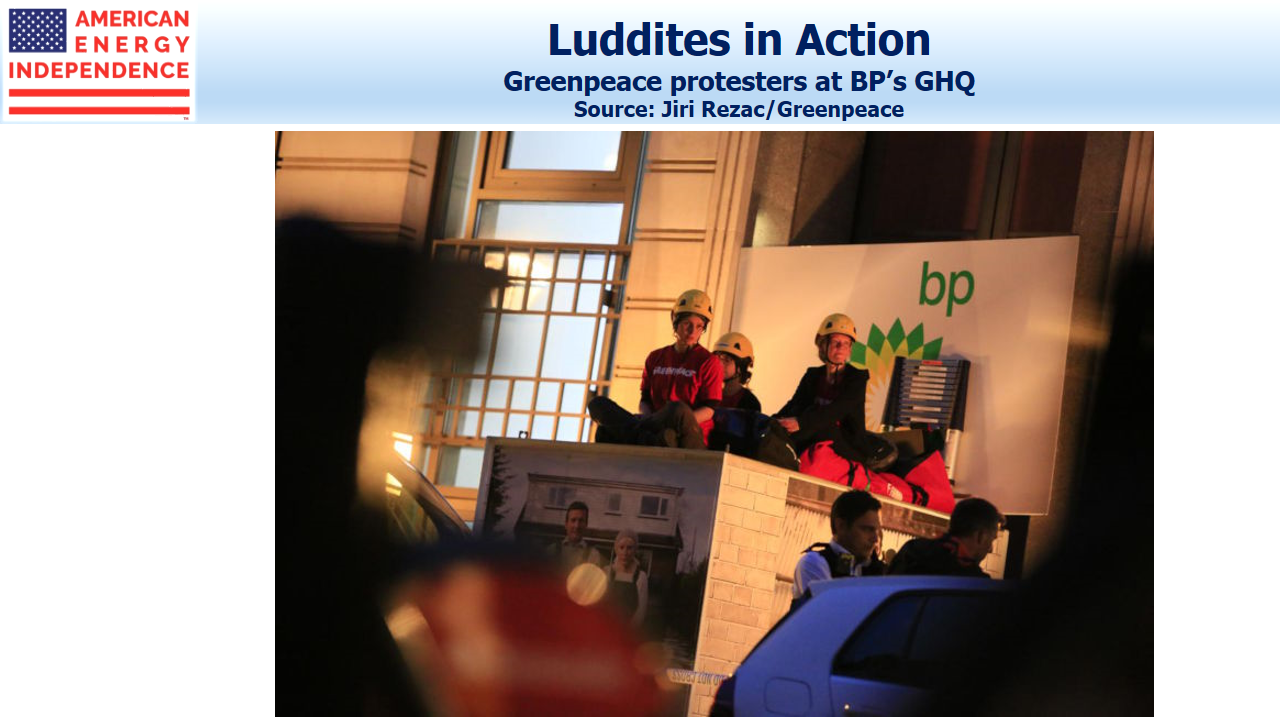
You might think that using a crane to place steel boxes so as to block all the entrances to a global energy corporation might attract some attention before completed. Nonetheless, Greenpeace successfully demonstrated a gap in business continuity planning, just hours before BP’s annual general meeting. Even at 3am, BP’s global headquarters should have had some security staff on site. They might be expected to notice the unplanned delivery of five steel boxes so as to block access to the building. Perhaps they were taking a nap. It must have led to a lively exchange between the head of security and senior executives.

.avia-image-container.av-48d33y-3b2bc7e613f7fcf292b95841b0f5c917 img.avia_image{ box-shadow:none; } .avia-image-container.av-48d33y-3b2bc7e613f7fcf292b95841b0f5c917 .av-image-caption-overlay-center{ color:#ffffff; }

Greenpeace BP Protest

People sealing themselves inside a chamber with several days of food and water should perhaps be allowed to languish for somewhat longer. One imagines that, had this imaginative protest occurred in Houston not London, the authorities’ response would have been different.

The steel boxes and the fuel for the cranes were enabled by the type of petroleum products BP produces, but this well-worn criticism of environmental activists (do protesters ever cycle to their protests?) is not our point. The energy industry is under attack by a small but vocal group who deny science to try and impose their own quirky vision of 18th century living standards on the rest of us.

Enbridge (ENB) told us last week they would not attempt a new, “greenfield” crude oil pipeline in Canada given the unpredictable approval process. New York recently denied Williams Companies (WMB) permission to build a natural gas pipeline connecting the Marcellus Shale in Pennsylvania with consumers in New York City. Boston relies on Russian imports of liquefied natural gas in winter, because new pipelines to bring domestic natural gas have been successfully opposed.

80% of the energy that supports modern life comes from fossil fuels and it’s never been cheaper. Living standards and longevity in developing countries are improving due to greater energy use. In spite of this undoubted success, the energy sector has lost the PR battle. Providing the world with what it clearly wants draws the smug opprobrium of those whose fixation on solar and wind power includes opposition to nuclear energy. Bill Gates, who writes thoughtfully on big subjects, has questioned the focus on R&D for renewables instead of more on cleaner use of fossil fuels: “Should you really be funding the intermittent stuff with all the money and putting no money in the stuff that works all the time?”

The tobacco industry has no claim to improving well-being, but does share with the energy sector a constant need to apologize for its existence. 25 years ago, big tobacco was being sued by U.S. states and individuals for the terrible health outcomes caused by its products. In 1998 they entered into a Master Settlement Agreement with almost all U.S. states, agreeing to pay billions of dollars over many years.

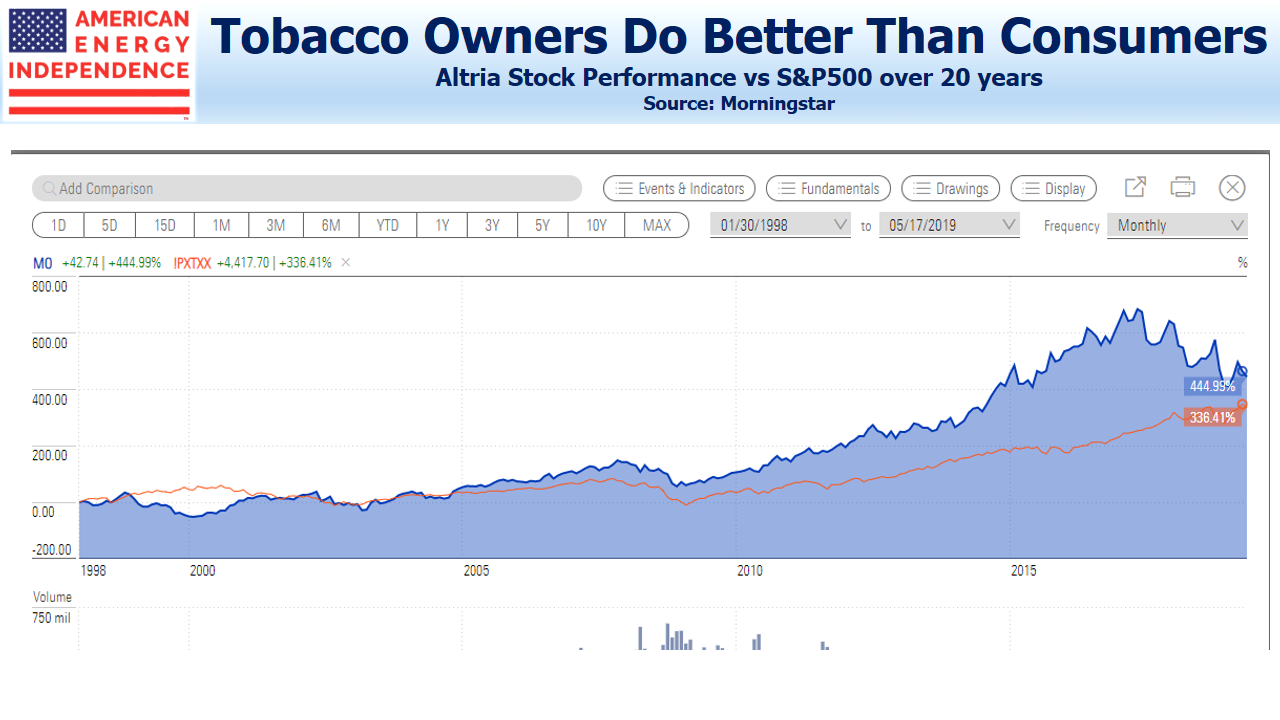
We are no fans of tobacco companies and the morality of energy companies is wholly different. But it’s worth noting that much-reviled tobacco stocks have provided strong returns since, as shown in the chart. The Wall Street Journal has included Altria (MO) in its “30 best-performing stocks of the past 30 years”. It’s just behind Apple (AAPL). MO also made the top 25 S&P500 stocks of the past 50 years.

.avia-image-container.av-s4fvlq-5cea615e86cfde4c8666e86ff86f43f1 img.avia_image{ box-shadow:none; } .avia-image-container.av-s4fvlq-5cea615e86cfde4c8666e86ff86f43f1 .av-image-caption-overlay-center{ color:#ffffff; }

Midstream energy infrastructure offers predictable cashflows that are growing, and will always be out of favor with those who like to inhabit steel boxes. It’s a recipe for attractive future returns.

We are invested in ENB and WMB.

SL Advisors is the sub-advisor to the Catalyst MLP & Infrastructure Fund.  To learn more about the Fund,  please click here.

SL Advisors is also the advisor to an ETF (USAIETF.com).


Better Odds With Pipelines

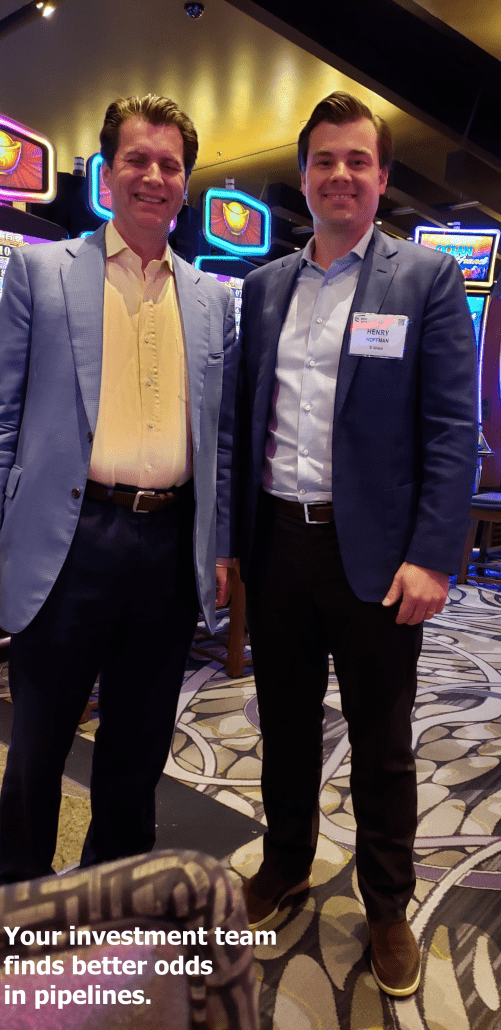
The mood at the 2019 Midstream Energy Infrastructure Conference was noticeably more positive than in the past couple of years. Perhaps relocating from Orlando to Las Vegas helped. Hope for positive financial outcomes is in the local DNA, and pipeline investors could smugly remind themselves that the best odds were not in the casino. Attendance seemed to be higher than in the recent past, and demand for one-on-one meetings with management teams (the point of attending for many, including ourselves) was reportedly up sharply.

Investors keep pounding away on planned growth capex, and companies are generally responding by guiding to less spending this year and next while still emphasizing their slate of attractive opportunities. We checked our assumptions underlying The Coming Pipeline Cash Gusher in several meetings and still see a substantial jump in industry free cash flow over the next three years.


.avia-image-container.av-2pts2i-20b1353861d71cab852317ac73ca9b3c img.avia_image{ box-shadow:none; } .avia-image-container.av-2pts2i-20b1353861d71cab852317ac73ca9b3c .av-image-caption-overlay-center{ color:#ffffff; }
Henry & Simon MEIC


New pipelines are becoming harder to build. New York recently blocked a natural gas pipeline planned by Williams Companies (WMB) because of environmental concerns, although WMB plans to reapply. Canada is becoming a more difficult and expensive place in which to build (other than in oil-rich Alberta). Enbridge (ENB) went as far as to say they wouldn’t attempt a new, greenfield crude oil pipeline in Canada. They regard the permitting process as capricious, hijacked by a small minority of vocal environmental activists that don’t reflect the public interest.

Impeding new construction simply increases the value of the existing asset base. It also means that today’s dominant firms will maintain their market positions in the future; this is not an industry where a disruptive start-up has realistic prospects.

It also creates an unusual alignment of interests between anti-fossil fuel, environmental activists and investors who are clamoring for a greater return of cash to owners. Both are opposed to new spending, albeit for different reasons.

Tellurian (TELL) is developing a Liquified Natural Gas (LNG) export complex. Their unusual financing model involves raising equity capital from customers. In this way they share some of the project’s upside and create key long term partnerships. They see growing Permian crude production leading to a huge jump in associated natural gas output, creating the need for an additional 20 Billion Cubic Feet per day (BCF/D) of LNG export capacity.

Incidentally, in a panel on LNG, Andy Orekar of Gaslog Partners said that if all the world’s shipping converted to LNG (because of the impending IMO 2020 standards on maritime emissions) it would consume more than all of the current trade in LNG. Currently, gas-powered ships are limited to LNG tankers that consume a small portion of their cargo for power. It’s a theoretical point since the industry is installing sulfur scrubbers and switching to cleaner crude oil-based fuels, but an interesting one nonetheless.

Today the U.S. exports around 4 BCF/D. Because natural gas is an inevitable byproduct of crude production in the Permian, TELL expects the economics of oil to drive more gas output which will need to be sent somewhere. They believe the Permian may produce as much as 30BCF/D, creating a need for almost all proposed LNG projects. Increased domestic consumption and pipeline exports to Mexico will only soak up so much, with seaborne LNG exports being critical to avoid constraints on crude production. Flaring unwanted natural gas is limited, and the larger companies that are now dominating Permian activity are especially likely to avoid the negative publicity associated with such obvious waste.

Private equity has developed into an alternative source of financing for midstream infrastructure since public market valuations essentially render equity financing prohibitive. This highlights the contrast between how public and private markets view the sector. Although private funds can compete effectively for projects, it’s also made exits harder, leading to longer holding periods that can reduce returns. The traditional arbitrage, in which public buyers acquire assets at higher multiples than paid by private equity, is currently being reversed. This reflects the continued public market wariness of midstream energy infrastructure, and highlights currently attractive valuations.

Most firms now have a set of policies covering ESG (Environmental, Social and Governance). This is regarded by some as a requirement for drawing in generalist investor interest. One company noted that European investors were more likely to use ESG as a screening metric, and reported that they had seen a notable pick up in interest from non-traditional investors in response to their adopting ESG policies. Mentioning Energy Transfer (ET) in the context of ESG invariably draws a chuckle (see Why Energy Transfer Can’t Get Respect)

A meeting with Enterprise Products Partners (EPD) produced some useful insights. They regard U.S. crude oil export infrastructure as still catching up with volumes. Building a facility to accommodate Very Large Crude Carriers (VLCC) is an important objective for them. The application to build this terminal was 13,000 pages and weighed 100 lbs.

EPD also sees very strong Chinese demand for U.S. exports of ethane and propane, with the current trade dispute not regarded as a long-term problem.

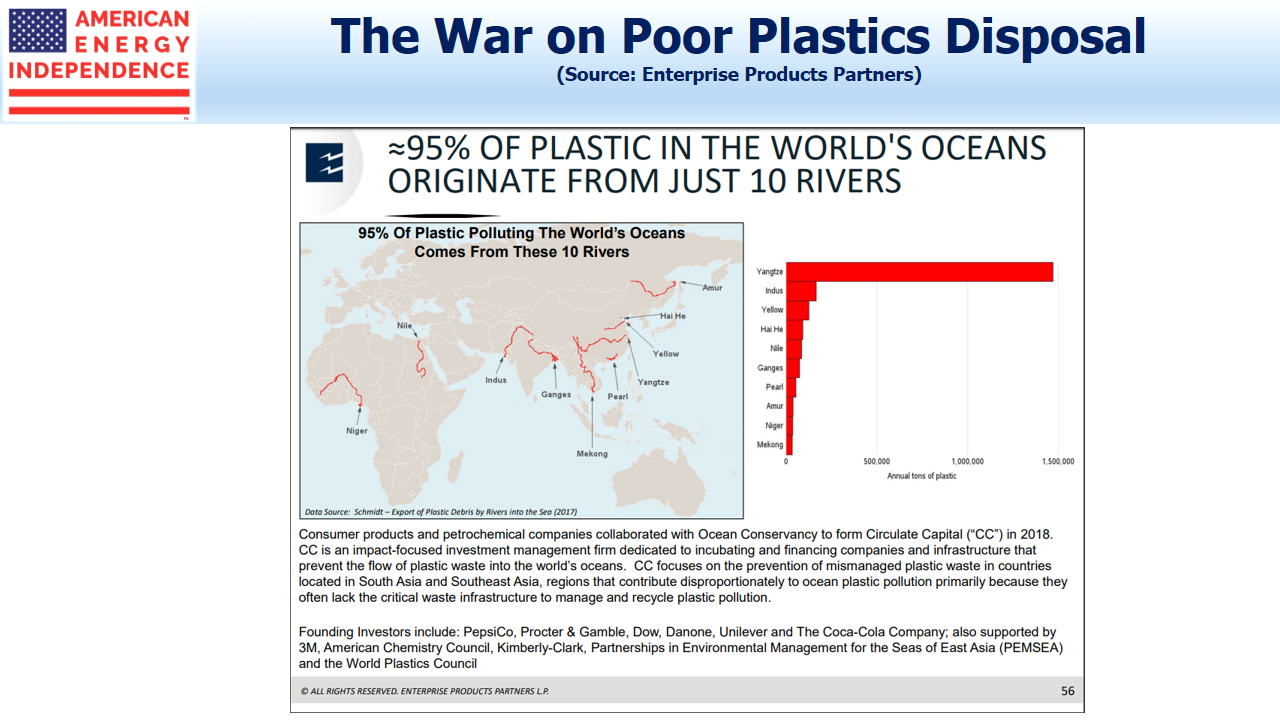
The “War on Plastics” led them to point out the slide shown below, which highlights how much of global plastics pollution can be traced back to ineffective disposal among some Asian countries.

.avia-image-container.av-ld8ayi-2cfcc0299383b03935a006830b8e7710 img.avia_image{ box-shadow:none; } .avia-image-container.av-ld8ayi-2cfcc0299383b03935a006830b8e7710 .av-image-caption-overlay-center{ color:#ffffff; }

Poor Plastics Disposal

Overall, the news was good and growing free cash flows are beginning to draw interest from a wider pool of investors. We left with reinforced conviction that valuations are excessively pessimistic. Strong returns lie ahead.

We are invested in ENB, EPD, ET, TELL and WMB.

SL Advisors is the sub-advisor to the Catalyst MLP & Infrastructure Fund.  To learn more about the Fund,  please click here.

SL Advisors is also the advisor to an ETF (USAIETF.com).


Why Keeping Up With Inflation Isn’t Enough

Cher wanted to turn back time to regain love lost. But economists are always turning back time to adjust prices for inflation, to calculate a measure in today’s dollars. This is to provide a relative price, comparable to current purchases.

Although mathematically correct, applied over decades or more it produces a misleading picture of what consumers were spending.

For example, in 1931 Schick launched the electric razor, going on to sell over a million over the next two years. Priced then at $25, there’s no need to convert to 2019 dollars — it was obviously a luxury good. Based on Consumer Price Inflation since 1931, Schick’s new product would now cost sixteen times as much, $412. Today, you can still buy an electric shaver for $25. It probably offers a better shave too.

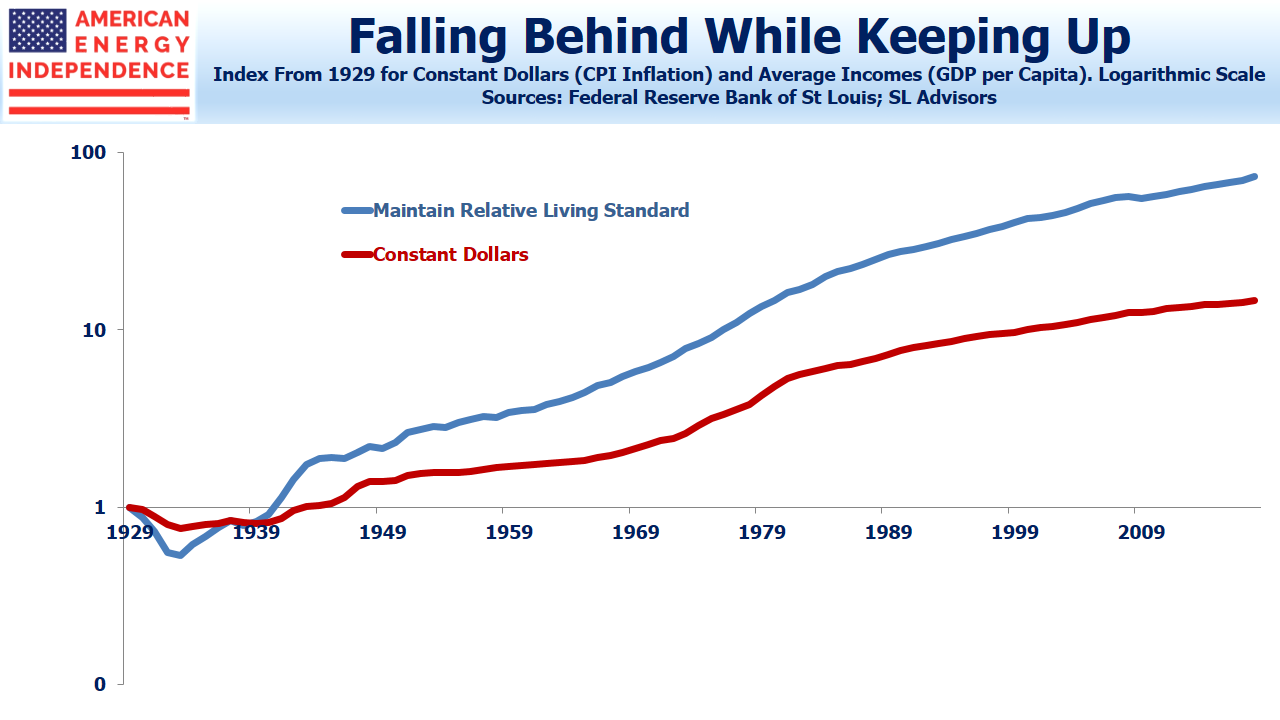
Buying a shaver was clearly an expense requiring some thought. But by considering only inflation, this analysis assumes disposable incomes have risen by the same rate since then. GDP per capita was $623 in 1931. A razor therefore cost 4% of this measure of annual income per person. Today’s GDP per capita is $62,590, 73 times as big. Incomes have risen roughly four times as much as inflation since 1931, which reflects rising living standards.

If you really want to appreciate the comparative sacrifice required to be quickly clean-shaven during the Depression, Schick’s shaver today would have to be $2,500. That’s 4% of 2018 GDP per capita, the same proportion required in 1931. This more accurately translates the choice consumers made back in 1931.

In 1955 gasoline cost 29 cents a gallon. That’s $2.61 in today’s dollars as conventionally calculated, or $6.96 if we hold it constant as a proportion of GDP per capita. Transport takes up a smaller percentage of household budgets than in 1955. To the anguish of peak oil devotees, driving is cheap.

Incidentally, this is why home prices generally outpace inflation. Incomes, which heavily determine prices, grow faster than inflation. Unfortunately New Jersey, where I live, has denied homeowners this benefit by raising property taxes faster than inflation. But not every state is so poorly run.

The purpose of this thought experiment isn’t merely to demonstrate that stuff used to cost more than you thought; there’s an important investment lesson here. Earning a return equal to inflation on a portfolio, enough to preserve its purchasing power, is every saver’s minimum goal. The point is to be able to maintain today’s standard of living in the future. The problem is that living standards themselves improve.

.avia-image-container.av-irte4d-f3869835333307758c35cbf17df69c18 img.avia_image{ box-shadow:none; } .avia-image-container.av-irte4d-f3869835333307758c35cbf17df69c18 .av-image-caption-overlay-center{ color:#ffffff; }

CPI vs GDP per Capita

A family who earns the median income, which supports an average standard of living, presumably wants that happy state to persist into retirement. In 2000, this average earner brought in $40,597 (median income per family). Correctly forecasting 2% inflation, she would anticipate that $50,000 would be adequate by 2018 to maintain that 2000 lifestyle. Meanwhile, median family income rose to $60,000, because of rising living standards on top of inflation. Following conventional advice, our average family has fallen from the middle of the pack to only 83% of the median income.

Economists retort that our saver can still purchase a basket of goods and services in 2018 with the same utility as she could in 2000. But she’ll feel poorer, because her friends who have maintained their incomes relative to the average will have moved ahead.

There are two points here. First, when it comes to inflation, economics measures what it wants to, not necessarily what non-economists think is being measured or what we want. Most of us care about maintaining our income relative to our peer group today, rather than constant utility.  John Rockefeller’s fabulous wealth couldn’t buy plane travel, internet access or TV during his lifetime. Many of us today enjoy a higher standard of living than the richest people did several decades ago.

The second point is that although investors can’t determine what set of investment returns are available, they should recognize that merely keeping up with inflation is going to leave them feeling poorer than they expected.  Over the past couple of decades, per capita GDP has grown at almost twice inflation. Savers looking to the long term should keep this in mind, and build a bigger nest egg.

SL Advisors is the sub-advisor to the Catalyst MLP & Infrastructure Fund.  To learn more about the Fund,  please click here.

SL Advisors is also the advisor to an ETF (USAIETF.com).


Why Energy Transfer Can’t Get Respect

If Energy Transfer (ET) was a private company contemplating an IPO, the 15% Distributable Cash Flow (DCF) yield indicated by their underwriters would draw laughter. The bankers would be ushered out of the conference room.

Yet that is the lowly valuation investors assign to perhaps the least loved pipeline company in a sector that investors find lukewarm at best. ET is priced far below where they’d take the company public, if it wasn’t already a listed company. CEO Kelcy Warren and his team continue to execute and beat expectations on earnings. Last August Kelcy joked that, “A monkey could make money in this business right now.” (see Running Pipelines is Easy). Inviting critics to find fault, they nonetheless still deliver good results. Unlike most MLPs, ET (legacy Energy Transfer Equity) has never cut its distribution.

The market prefers style over substance, for on the soft issues of PR and Investor Relations (IR), ET’s record is sharply at odds with their financial performance. From their ill-fated pursuit of Williams Companies (WMB), the dubious dilution of shareholders with management-only convertible preferreds (see Will Energy Transfer Act with Integrity?) and the optically poor dispute over the Dakota Access Pipeline, this is a company that cares little about its image. Pennsylvania’s huge natural gas boom has been helped by a generally pro-energy regulatory regime, but ET has even managed to make enemies there.

ET’s PR staff must get combat pay.

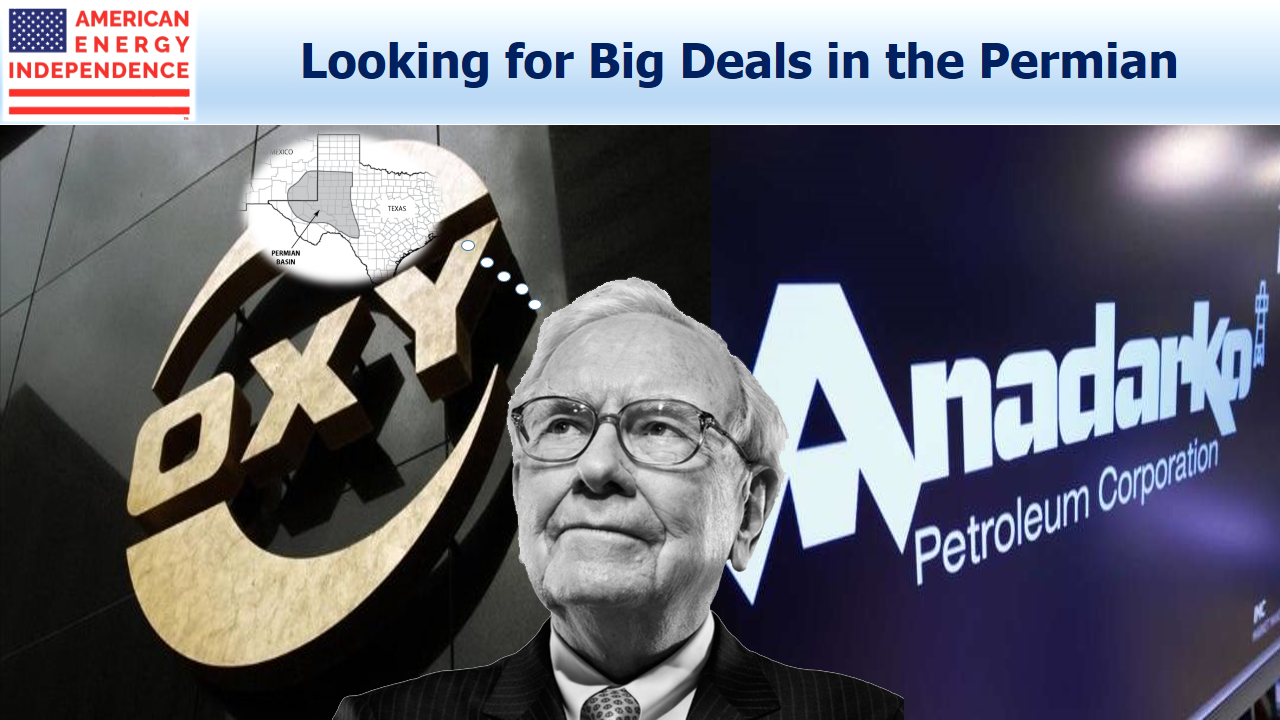
Warren Buffett recently explained how Berkshire’s (BRK) $10BN investment in Occidental (OXY) was negotiated with no contingencies (save that they acquire Anadarko). Buffett needs to trust his investment partners. On this basis, ET is an implausible candidate for a BRK investment.

On the 1Q19 earnings call, Kelcy commented on how he is listening to the market. He’s been, “…trying to understand what the market would like to see us to do. What causes our unit price to perform better, in other words.”

Our advice would be start behaving like the kind of company that would interest Buffett.

ET’s 1Q19 earnings included EBITDA of $2.8BN and distribution coverage was ample at 2.07X. This exceeded expectations, although the 8% yield suggests some fear a cut. They guided to $10.7BN in 2019 adjusted EBITDA. ET’s stock had weakened over the prior month, so expectations weren’t high. Nonetheless, on the day following earnings ET slumped 1.3%, twice the drop in the broad-based American Energy Independence Index.

Kelcy Warren might compare ET with another big pipeline company, Plains All American (PAGP). If ET has delivered consistently good operating results distorted by a bad corporate image, PAGP has done the opposite. Their distribution relied unwisely on a volatile business segment (Supply and Logistics, S&L) whose arbitrage margins virtually disappeared from 2013 to 2017. The narrative accompanying results changed from “it’s skill not luck” to “forces out of our control”. The 2016 sweetheart “One and Done” preferred deal to shore up finances was anything but.

.avia-image-container.av-8vm9z-0a33c88295af49690074e37026ba618f img.avia_image{ box-shadow:none; } .avia-image-container.av-8vm9z-0a33c88295af49690074e37026ba618f .av-image-caption-overlay-center{ color:#ffffff; }

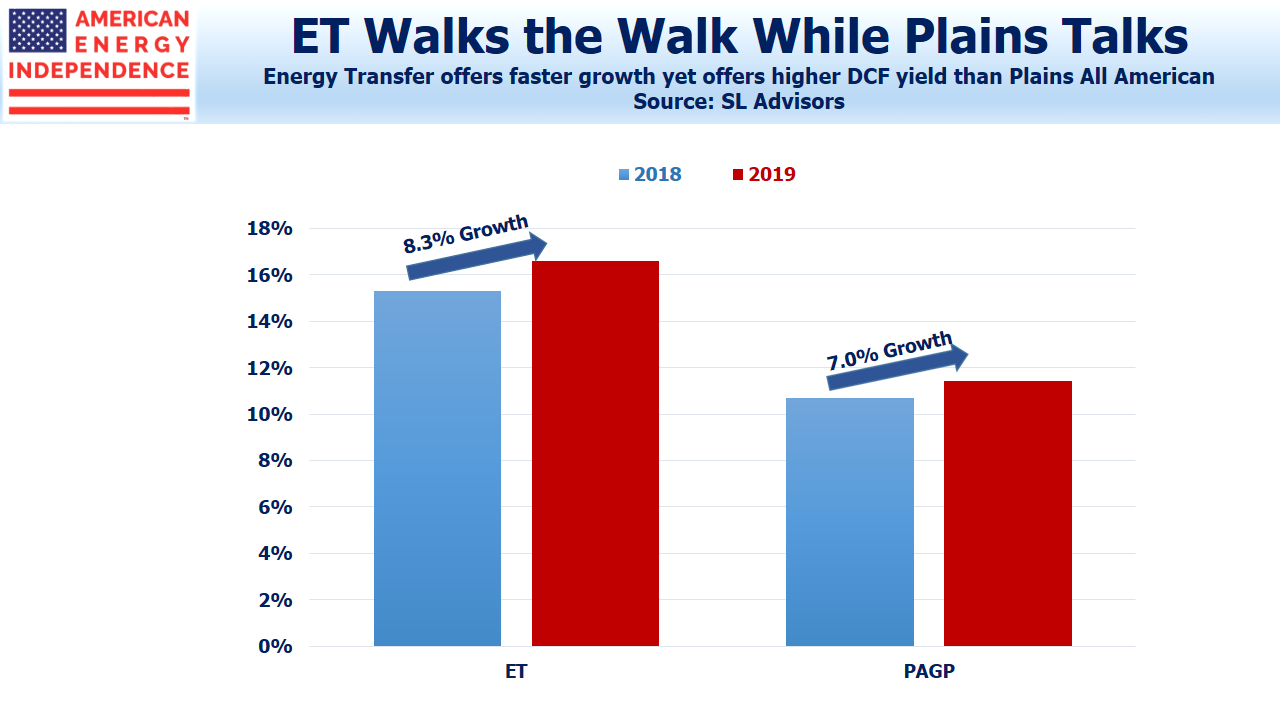
DCF Yield Growth ET vs PAGP

PAGP’s 2017 acquisition of the Alpha Crude Connector was ill-advised, and along with other growth projects exposed too-high leverage when margins fell. As a result, investors in PAGP subsequently suffered two distribution cuts.  Back in 2010 when the shale oil boom was in its infancy, PAA yield seeking investors received $3.75/unit in distributions.  In 2018 they received just $1.20 per unit.  It’s why income-seeking investors often feel so betrayed by MLPs. Nonetheless, the market has not punished PAGP’s stock as much as ET’s, although it’s also cheap. Former CEO Greg Armstrong’s folksy style created sufficient goodwill among investors that PAGP has a distribution yield a third less than ET’s. Their DCF and free cash flow are growing, but not as fast as at ET.

PAGP’s 1Q19 results were also good, buoyed by their resurgent S&L segment. Their 10% DCF yield reflects some concern that past mistakes will be repeated, and arbitrage margins are hard to forecast because they rely on shortages of pipeline capacity which can be fleeting. But their IR people at least have a more positive corporate image against which to tell their story.

As if to punctuate attractive valuations, on Friday Buckeye (BPL) was acquired at a 32% premium to its recent average price. BPL’s foray into international storage terminals led to chronic underperformance in recent years that even the buyout hasn’t rectified. They have mismanaged themselves into a takeover, at pricing substantially higher than ET’s.

Both ET and PAGP are cheap. They each possess skills that would benefit the other. ET’s rebarbative management style contrasts with their efficient execution and strategic foresight, an area where PAGP needs to regain credibility after mis-steps in recent years. ET walks the walk, and PAGP talks the talk.

If each company can improve its weaknesses, they’ll continue to draw investors to an extremely cheap sector offering substantial growth.

We are invested in BRK, ET, PAGP, and WMB.

SL Advisors is the sub-advisor to the Catalyst MLP & Infrastructure Fund.  To learn more about the Fund,  please click here.

SL Advisors is also the advisor to an ETF (USAIETF.com).


Buffett Finds Value in Shale

Warren Buffett likes the Permian Basin. This was clear from Berkshire’s (BRK) proposed $10BN preferred investment in Occidental (OXY) should they buy Anadarko (APC). Berkshire’s annual shareholder meeting was followed as usual with a Becky Quick interview on CNBC.

.avia-image-container.av-uitvf4-25270e4f8bff9ebfbe1b8cb03359e9e6 img.avia_image{ box-shadow:none; } .avia-image-container.av-uitvf4-25270e4f8bff9ebfbe1b8cb03359e9e6 .av-image-caption-overlay-center{ color:#ffffff; }

Buffet OXY Deal

The 8% dividend on the preferred OXY will issue to finance their acquisition could be inducement enough for BRK to commit $10BN. When Becky commented on this Buffett responded “It isn’t great to have an 8% preferred if there isn’t any oil there.   It’s a bet on oil prices over the long term more than anything else and it’s also a bet on the fact that the Permian basin is what’s it’s cracked up to be. … You have to have a view on oil over time and Charlie and I have got some views on that.”

This led Becky to ask why BRK didn’t use some of its cash hoard to buy Anardarko for $35BN, to which Buffett replied “Well, that might have happened if Anadarko had come to us.”  Buffett was quick to clarify that he wouldn’t jump in to a bidding war with someone who has come to them for financing. Buffett wants more supplicants for similar deals. But it does show that they see value in the Permian Basin, OXY and APC.

The competition between Chevron (CVX) and OXY to buy APC provides further confirmation of a bullish production outlook among those with the best information. CVX and OXY were the two biggest producers in the Permian last year, each pumping over 300 thousand barrels per day (MB/D). APC did 100 MB/D. They know the region. Rystad Energy believes that a CVX/APC combination would reach almost 1.4 Million Barrels per Day (MMB/D) in output by 2025. A match-up of OXY/APC would get to 0.9 MMB/D. Permian volumes are growing fast, and the influx of additional capital makes this even more likely. Midstream energy infrastructure is a sure winner.

As always, Buffett had some wonderful folksy quips. In discussing his 60-year partnership with Charlie Munger, he noted that they’d often disagreed but never had an argument. Munger sometimes concludes such debates with, “You’ll agree with me soon, because you’re smart and I’m right.”

Try using that at home with your significant other. Let us know how it goes – we’ll publish any credible stories.

Buffett and Munger aren’t overly concerned about the latest ratcheting up of trade tensions. They believe both sides will benefit from concluding a deal. We agree that trade tensions are unlikely to be a factor entering 2020 when Trump is running for re-election (see The Trump Put).  One easy way to reduce the trade deficit is for China to increase it’s purchases of raw materials from the U.S. This could include huge amounts of LNG, natural gas liquids such as propane, and light crude oil that they desperately want and need.

If the dispute is drawn out, planned Chinese purchases of U.S. Liquified Natural Gas (LNG) are at risk. But LNG is fungible, and U.S. exports could displace trade to other Asian countries whose shipments would in turn head to China. Cheniere Energy (ticker: LNG) and Chinese energy firm Sinopec are planning a 20 year LNG deal once the trade negotiations are concluded.

While a full-blown trade war that severely damages global GDP growth can have a meaningful impact on oil demand and oil prices, a resolution should boost demand and clear the way for Chinese buyers to sign long-term contracts from U.S oil and gas exporters.

Moreover, the U.S. just dispatched aircraft carrier Abraham Lincoln to the Persian Gulf so as to, “send a clear and unmistakable message to the Iranian regime…” The Shale Revolution has improved America’s ability to press our interests since we are so much less dependent on Middle East oil. Trump is not one to shy away from a fight. We won’t forecast how events with Iran will play out – but domestic energy investments are one of the safer places to be if there is conflict with Iran.

With historically low valuations for the energy sector, record oil & gas production, and solid growth prospects, the weekend’s news is showing energy to be one of the most overlooked areas in the market.

We are long BRK.

SL Advisors is the sub-advisor to the Catalyst MLP & Infrastructure Fund.  To learn more about the Fund,  please click here.

SL Advisors is also the advisor to an ETF (USAIETF.com).


Pipeline Earnings Good; Investors Skeptical

We’re in the middle of earnings season, and last week several companies provided 1Q reports. The energy sector continues to struggle to excite investors. Although pipelines stocks delivered very strong performance through March, in recent weeks investors have started to question the rally’s resilience.

As a result, sentiment could use a boost from strong earnings. Of the companies we follow, results so far have been at or ahead of expectations. Enterprise Products Partners (EPD) generated almost $2BN in EBITDA during 1Q19, handily beating forecasts. On the earnings call they discussed the conversion of their Seminole pipeline to carry crude oil instead of Natural Gas Liquids (NGL) from the Permian to Mount Belvieu: “…given its location and interconnects, we will always have flexibility to convert this pipeline back to NGL service depending on the pipeline supply demand balances for crude oil and NGLs in the future. I doubt that anyone else will be able to offer this type of future flexibility to Permian producers and to markets.” We get some questions about the likelihood of excess pipeline capacity in the Permian, and this optionality is useful.

There was another interesting exchange on propane exports, where EPD conceded to a drop in market share from 80% to around 50%. They’ve concluded that their pricing was too high, and plan to be more competitive. Energy Transfer (ET) CEO Kelcy Warren complained on their fourth quarter call about spending to protect his turf from competition from fringe private equity projects.  EPD shares the same distaste for new, greenfield projects competing with more economic brownfield expansions on their existing footprint. EPD CEO Jim Teague commented that, “…we’re not going to make the mistake of having prices that (and) invite more competition.”

Takeaway infrastructure for Permian crude production often comes with associated natural gas. Inadequate takeaway infrastructure has led to flaring, and recently pushed prices at the Waha hub collection point negative. On April 3rd, some Exploration and Production (E&P) companies paid $9 per MCF to dispose of natural gas.  Forward price remain negative through 2021.  The crude oil that they’re seeking is sufficiently profitable to cover this additional overhead. Under the circumstances, one might think E&P companies would be pushing for additional natural gas takeaway infrastructure. However, Williams Companies (WMB) CEO Alan Armstrong reported that few were willing to commit volumes on terms to support such an investment.

Earnings reported so far support our free cash flow bridge below, first published last week.

.avia-image-container.av-ko83gf-f30518b727e9f54dce8e413af1619c66 img.avia_image{ box-shadow:none; } .avia-image-container.av-ko83gf-f30518b727e9f54dce8e413af1619c66 .av-image-caption-overlay-center{ color:#ffffff; }

Pipeline Sector Free Cash Flow

WMB earnings were in-line with expectations, and their 2019 growth capex guidance was lowered by $200MM to a range of $2.3BN to $2.5BN.

Capex guidance was generally among the more keenly examined numbers, given past years’ focus on growth projects. Last week we noted that such investment peaked last year, which is supporting growing free cash flow (see The Coming Pipeline Cash Gusher).

Oneok (OKE) logged 12% year-on-year distribution growth, with Distributable Cash Flow (DCF) providing 1.43X coverage while continuing to advance key projects on schedule. Lower payout ratios are the new normal, to provide more flexibility and reduced need to issue equity.

Enlink (ENLC) disappointed with lowered guidance for 2019 natural gas output from Oklahoma, although their overall report was within expectations. Its 14% DCF yield is very attractive and we like the management team.

Crestwood (CEQP) raised 2019 EBITDA and DCF guidance with continued strength from their Bakken assets,and expects 20% DCF growth through next year. Their 13% DCF yield seems unreasonably high.

Western Gas (WES) reported 7% annual distribution growth, but the competition to buy parent Anadarko (APC) will dominate their performance until it’s resolved.

With Occidental (OXY) outbidding Chevron (CVX) for APC, many are surprised that the consolidation and implied vote of confidence in shale from a major oil company isn’t drawing in more support for the energy sector. Berkshire’s (BRK) proposed $10BN investment in OXY via 8% preferred securities with warrants for 80 million shares at an exercise price of $62.50 represents either (a) a valuable endorsement of growing U.S. oil production, or (b) proof of the high cost of capital facing a still unloved energy sector. Whichever it is, the APC M&A saga can surely only be good for midstream energy infrastructure.

More earnings reports are due next week. So far, what we’ve seen is increased capital discipline, lower leverage, growing cash flows and higher coverage ratios. This is consistent with our overall, constructive outlook for the sector.

We are invested in BRK, CEQP, EPD, ENLC, ET, OKE, WES and WMB.

SL Advisors is the sub-advisor to the Catalyst MLP & Infrastructure Fund.  To learn more about the Fund,  please click here.

SL Advisors is also the advisor to an ETF (USAIETF.com).


Pipelines Gushing Cash

.flex_column.av-jjrmf7ps-c67a8c8c03a15c49af60226d5c45e3c8{ border-radius:4px 4px 4px 4px; padding:10px 10px 10px 20px; background:url(https://sl-advisors.com/wp-content/uploads/2018/07/HOME-BGBANNER-hero.jpg) 0% 0% no-repeat scroll ; }

AMERICA IS IN THE MIDST OF AN ENERGY REVOLUTION.

By capitalizing on American technology, ingenuity, and frontier spirit, the Shale Revolution—driven by horizontal drilling and fracking—is turning the world’s energy markets upside down.


#top #wrap_all .avia-button.av-4wqy6e-4c08ee8d8c803daa5c808a3a051a78a4{ margin-bottom:20px; margin-right:10px; margin-left:10px; } ETF #top #wrap_all .avia-button.av-bfwfb-1e3addcf37f1ad9c5f4de238b8677652{ margin-bottom:20px; margin-right:10px; margin-left:10px; } Mutual Fund

#top .hr.hr-invisible.av-jjkejdzy-45d69def6fcd4634d81723d4107c2a5c{ height:50px; }