Pipeline Earnings Confirm Positive Trends

Energy remains probably the least loved of the S&P500’s 11 sectors. Over-investing in new projects has turned off many investors, who would like to see more cash returned via buybacks and dividends. And the Democratic primary debates remind that an anti-fossil fuel stance is needed to excite the party’s hard core, introducing some electoral uncertainty to the outlook.

The good news is that cash flows are growing, as pipeline companies are responding positively to investor feedback (see The Coming Pipeline Cash Gusher). And the aspirational goals of some Democrats to phase out oil and gas will collide with technical realities and popular reluctance to return to 18th century living standards.

.avia-image-container.av-vryjn7-14e089a1530da942f5f31f31f2cef9e4 img.avia_image{ box-shadow:none; } .avia-image-container.av-vryjn7-14e089a1530da942f5f31f31f2cef9e4 .av-image-caption-overlay-center{ color:#ffffff; }

Earnings season is generally confirming the positive free cash flow story we’ve articulated for midstream energy infrastructure (see The Coming Pipeline Cash Gusher). Enterprise Products Partners (EPD) continues to execute well, beating EBITDA expectations by around 10% with 18% year-on-year growth. Williams Companies (WMB) modestly exceeded expectations and provided good guidance, boosting the stock. This highlights that weak natural gas prices, which had kept the stock under pressure for a couple of weeks, have little impact on operating performance.

TC Energy (TRP, formerly known as Transcanada) reported another solid quarter. And Oneok (OKE) reported Distributable Cash Flow (DCF, the cash generated from existing assets after maintenance expense), of $541MM, $100MM ahead of expectations. Only Western Gas (WES) bucked the trend, with poorly-timed lower guidance just when Occidental (OXY) is considering selling their position following the acquisition of Anadarko (ADC).

Midstream energy infrastructure has undergone a transformation in recent years. Predictable and rising distributions were abandoned when the Shale Revolution required new pipelines. Income seeking investors felt betrayed, and many big MLPs converted to corporations so as to access a far broader set of investors (see It’s the Distributions, Stupid). Today, MLP-dedicated investors are missing two thirds of the sector including most of the big companies.

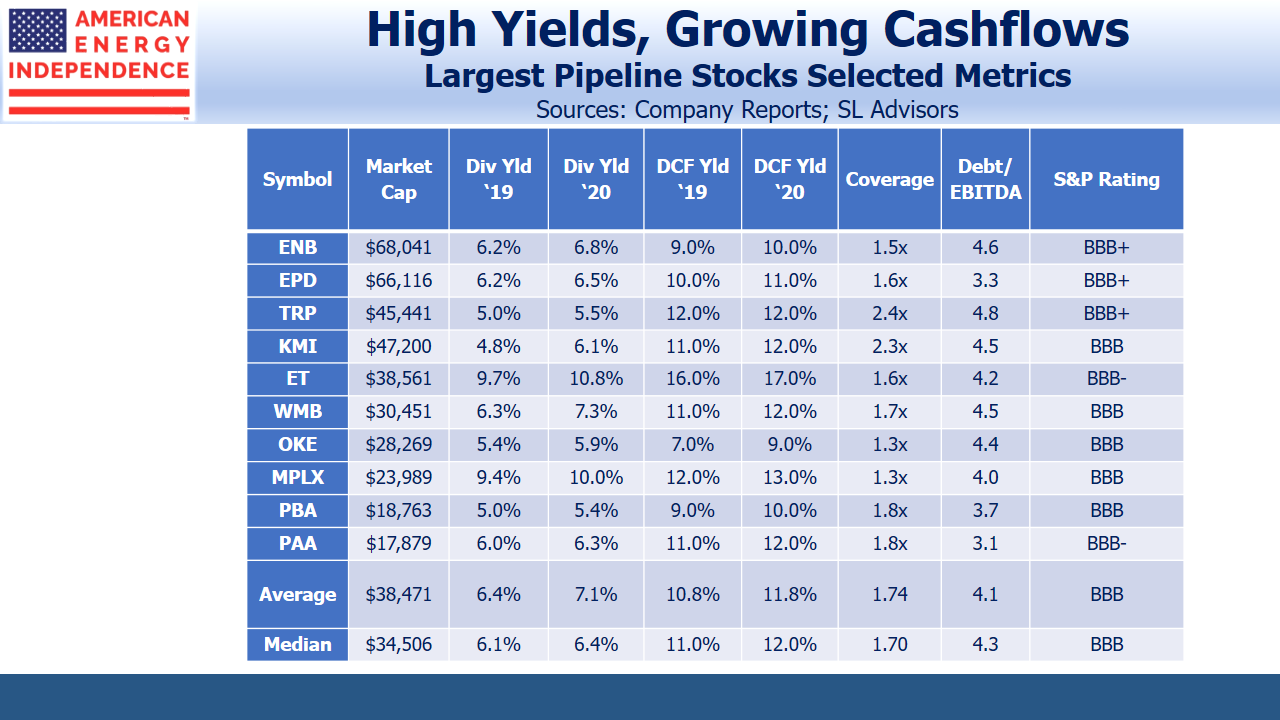
The ten biggest companies comprise the bulk of the industry. Dividends average 6.4%, comfortably covered by 10.8% DCF, which is growing at 9%. Leverage is down, at 4.1X Debt:EBITDA, and all are investment grade. Yields on their bonds are typically less than half their dividend yields, revealing that banks and rating agencies, with their access to proprietary information are far more optimistic than equity investors.

The positives include:

  • Capex on new projects, which continues to fall from last year’s peak
  • Improved governance for those MLPs that have converted to a corporate structure. This makes them more attractive to institutional buyers.
  • Stronger balance sheets, especially compared to more levered sectors such as REITs and utilities where over 5X Debt:EBITDA is common
  • Low borrowing costs
  • Interest from private equity, whose managers see better value in public markets. IFM’s acquisition of Buckeye Partners for a 27.5% premium earlier this year was an example
  • Free Cash Flow growth which is on course to leap from $1BN last year to $45BN by 2021, based on our analysis of the companies in the broadly-based American Energy Independence Index.

2Q19 earnings reports are so far confirming all the positives noted above. Midstream is out of favor, cheap and poised to rise.

We are invested in EPD, OKE, TRP, and WMB

SL Advisors is the sub-advisor to the Catalyst MLP & Infrastructure Fund. To learn more about the Fund, please click here.

SL Advisors is also the advisor to an ETF (USAIETF.com).


Fed Ponders Multiple Uncertainties

If not today, then within a few weeks the Federal Reserve is likely to acquiesce to President Trump’s call for lower rates. Ten year U.S. treasury yields are low by most measures at 2.05%, but they’re the highest in the G7, and even higher than Greece’s. The President has criticized Fed policy as creating unnecessary headwinds to the economic boom his policies have created.

.avia-image-container.av-ig9ljc-941ef3a4d2742dc5d4df6001c8f97806 img.avia_image{ box-shadow:none; } .avia-image-container.av-ig9ljc-941ef3a4d2742dc5d4df6001c8f97806 .av-image-caption-overlay-center{ color:#ffffff; }

Trump is obviously talking his book. With the unemployment rate below 4% for a year and hourly earnings growing at 3.1%, the economy is not obviously in need of stimulus. Inflation continues to remain below the Fed’s 2% target. The Phillips Curve, which posits that you can have low unemployment, or low inflation, but not both, long ago ceased to explain the world.

There are an unusual number of macro uncertainties that the Fed must consider.

The ongoing trade dispute with China is hindering growth, and not just in China. Germany recently halved its forecast 2019 GDP growth forecast, to 0.5%. We think it’s likely the U.S. will close a deal with China in time for the economy to show a benefit heading into next year’s Presidential election.

Tensions with Iran seem to have eased recently, and crude oil has slipped by $5 as the possibility of a closing of the Straits of Hormuz has receded. Iran is likely to avoid direct confrontation with the U.S., and election calculations similarly suggest that Trump will avoid anything that could become a lengthy military engagement. The possibility of accidental confrontation remains, but this issue is for now lurking in the background.

Brexit continues to be an absorbing spectacle of self-destruction by a country enduring serial poor leadership. Although Conservative PM Boris Johnson claims that the UK is leaving the EU on October 31 with or without a deal, this seems unlikely. Parliament has voted against a hard Brexit, and as many as 30 Conservative party MPs, including former Chancellor of the Exchequer Philip Hammond, have vowed to ensure the country doesn’t leave the EU without a deal. Moreover, the PM doesn’t have a mandate for a hard Brexit, since the referendum offered a simple choice and none of the senior Brexit campaigners advocated it.

PM Johnson endured booing crowds on a recent visit to Scotland, where voters chose Remain three years ago. A rocky visit to Northern Ireland looms, whose population is also facing the prospect of being dragged unwillingly out of the EU by the English majority. Brexit is now the defining political issue in Britain. Ask where someone lives (i.e. urban vs rural) for a good guess at where they stand.

Assessing the precise economic impact of a hard Brexit is tricky. There’s plenty of historical data on countries joining trading blocs; far less of countries leaving, because as The Economist dryly notes, “…this rarely happens.” But the downside risk to the UK is substantial, and the impact might ripple across the world. Fed chair Jay Powell has cited Brexit as another potential threat to economic growth.

It’s quite possible that the October 31 deadline could pass with the UK still in the EU. Parliament is likely to prevent a hard Brexit, and the EU won’t simply eject the UK, much as many may wish to. A general election might resolve the issue, and if parties opposed to a hard Brexit (Labor and Lib-Dem) are victorious, a second referendum could reverse the first. Britain isn’t yet out of the EU, and there are several more scenes to play out.

Finally, one more risk that’s coming over the horizon is the 2020 election. It looks like Trump’s to lose, but with over fifteen months to go a lot can happen. At some point, it’s likely Trump’s re-election will look in doubt – either because the Democrats abandon their idealism and pragmatically opt for an electable candidate, or because a new presidential scandal erupts that sticks. Stocks are likely to react poorly, and a nasty presidential election that reflects badly on all concerned is probably in store.

With all these risks to consider, who can blame the Fed for taking out a little bit of insurance by lowering rates.

SL Advisors is the sub-advisor to the Catalyst MLP & Infrastructure Fund. To learn more about the Fund, please click here.

SL Advisors is also the advisor to an ETF (USAIETF.com).


Brexit Meets the Shale Revolution

Britain’s new prime minister, Boris Johnson, sports a mop of blond hair, shuns conventionality and routinely spins facts to suit his purpose. The photo is from a 2006 charity soccer game in London against Germany, when he head-speared an opponent in a maneuver better suited to wrestling. It’s an appropriate metaphor for the upcoming Brexit negotiations with the EU.

.avia-image-container.av-13cn2ml-e7ad2ef219745d37fbe1396913634604 img.avia_image{ box-shadow:none; } .avia-image-container.av-13cn2ml-e7ad2ef219745d37fbe1396913634604 .av-image-caption-overlay-center{ color:#ffffff; }

Boris Johnson Rugby Tackle

Even to a Brit, the unfolding constitutional drama has been hard to comprehend. Boris was chosen by 96,000 hard-core Conservative party members, and will be PM because they (barely) have a Parliamentary majority. The country voted for Brexit (by 52%-48%), and yet Parliament has rejected both a negotiated EU exit and a hard Brexit. It’s possible the next deadline of October 31 may pass with the UK still a reluctant EU member.

Poor leadership is all Britain has. If Theresa May wasn’t all but gone, she would have faced more withering criticism over the entanglement with Iran. Having seized an Iranian tanker, the careless loss of a British-flagged ship might charitably be ascribed to domestic leadership distractions. The inability of the Royal Navy to offer protection, along with Britain’s intimidating vow to resolve using all diplomatic means, reveals a country wrestling with diminished status and no plausible military option.

PM Johnson enters office with an unwanted foreign policy crisis. But as a vocal cheerleader for Brexit, it is appropriate that he should be the one leading the country as it plows ahead into unknown status.

Meanwhile, the main protagonists are both avoiding direct conflict — Iran because military defeat would be swift, and Trump because it would jeopardize his re-election. So the situation percolates without boiling over, with little end in sight.

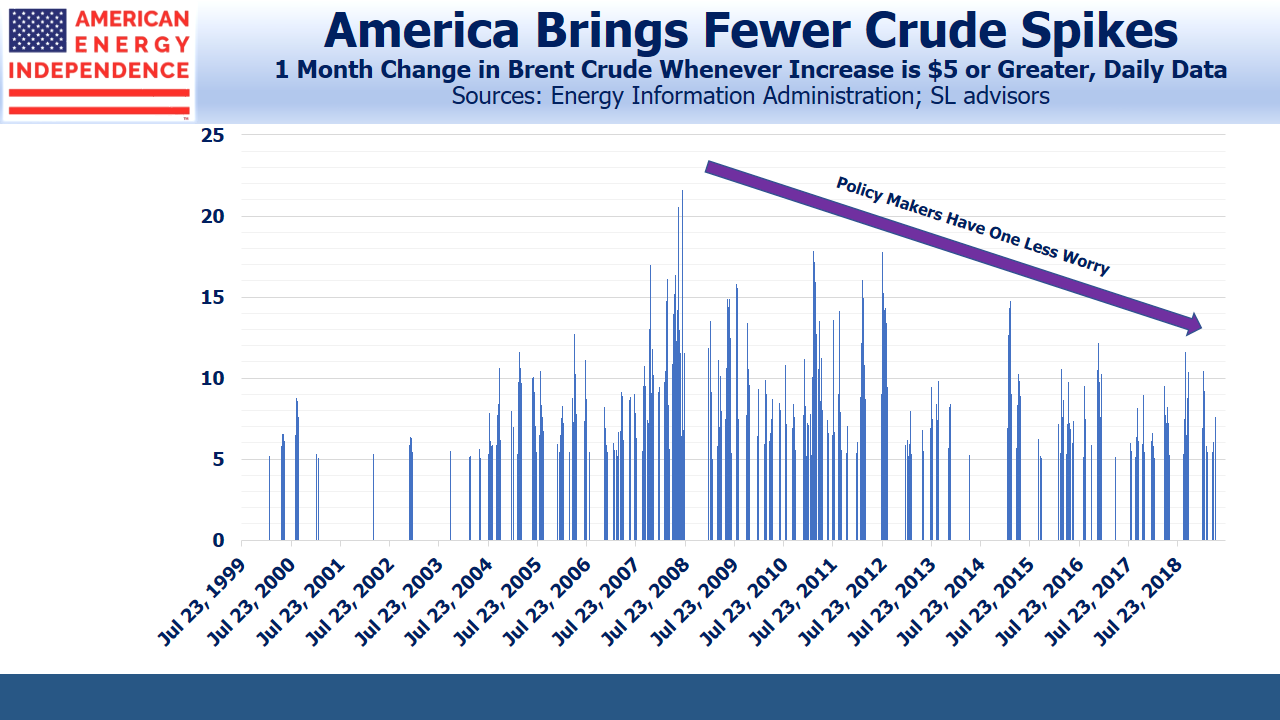
Crude traders have remained sanguine over the potential for supply disruption through the Straits of Hormuz. A defining feature of the Shale Revolution is that it has ameliorated the price spikes that used to threaten global growth. Higher prices increase profitably accessible reserves, and shale’s short production cycle always promises more availability within a matter of months, if needed.

.avia-image-container.av-ssqdil-c625bbf1452ee62929bfbaf60372c262 img.avia_image{ box-shadow:none; } .avia-image-container.av-ssqdil-c625bbf1452ee62929bfbaf60372c262 .av-image-caption-overlay-center{ color:#ffffff; }

Fewer Monthly Spikes in Crude Oil

Britain’s economy is slowing due to Brexit uncertainty. Shaky consumer confidence doesn’t need a debilitating spike in crude. Fortunately, such moves are becoming rarer. Volatility in crude oil isn’t much different than a decade ago, because prices still fall quickly. But world growth is more susceptible to sharp increases. Encouragingly, price spikes are becoming less frequent and milder, another tangible demonstration of the Shale Revolution’s impact in addition to generally lower prices.

President Trump could justifiably note how American energy independence is protecting oil importing nations like Britain from price shocks. PM Johnson needs a narrowing Atlantic to offset the politically widening English Channel.

U.S. LNG exports, another Shale Revolution benefit, are likely to be on the table as Brexit Britain seeks deeper ties with the U.S., allowing Trump to show he can close a trade deal. A Donald-Boris honeymoon beckons.

SL Advisors is the sub-advisor to the Catalyst MLP & Infrastructure Fund.  To learn more about the Fund,  please click here.

SL Advisors is also the advisor to an ETF (USAIETF.com).


Our Fossil Fuel Future (With a Bit More Solar and Wind)

Climate change is driving tremendous upheaval in the energy sector. One consequence is that making long term investments is exceptionally difficult. A large, conventional oil or gas project is exposed to uncertainties around GDP growth, production costs and commodity prices over a payback period that can extend 10 to 20 years or more. Public policy changes add further uncertainty, which is why big projects are shrinking, and investments with a faster payback are gaining favor. The short-cycle projects offered by U.S. shale are one answer to energy production at a time of uncertainty.

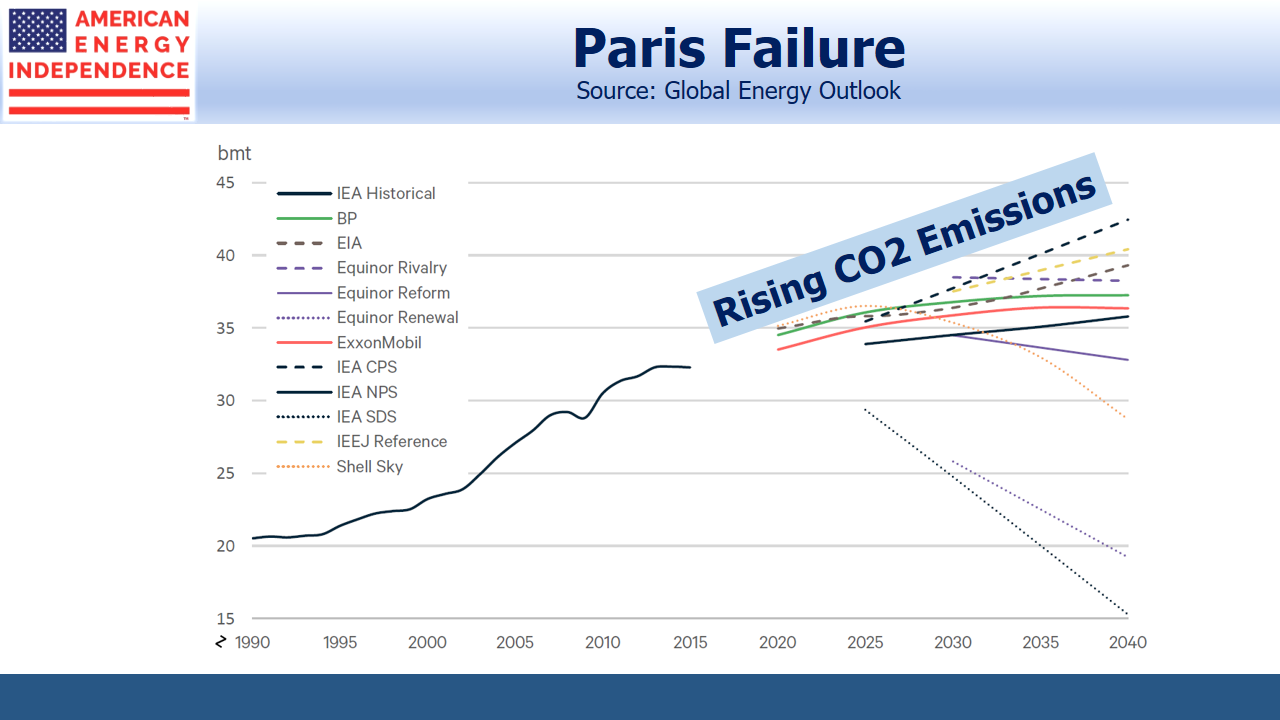
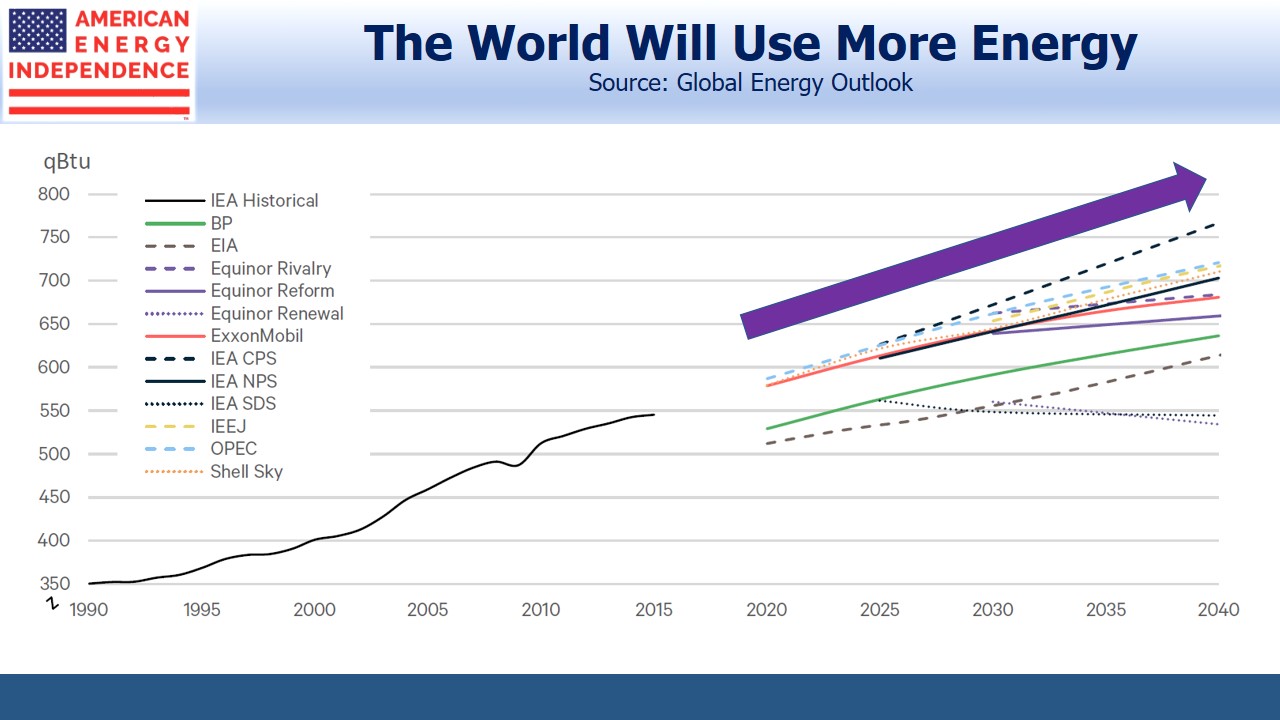
There are at least seven entities publishing projections on long term global energy use, and because of multiple scenarios they produce 13 forecasts. Resources for the Future, a non-profit research institution, has helpfully combined these in Global Energy Outlook 2019: The Next Generation of Energy (“GEO”) so as to allow easy comparison. These fall into three categories of energy consumption to 2040 based on different public policy regimes: (1) unchanged policies, (2) likely new policies, and (3) policies designed to lower CO2 emissions.

.avia-image-container.av-3nz7njk-d73d8a292b142c46718a89292c1f10b1 img.avia_image{ box-shadow:none; } .avia-image-container.av-3nz7njk-d73d8a292b142c46718a89292c1f10b1 .av-image-caption-overlay-center{ color:#ffffff; }

The World Will Use More Energy

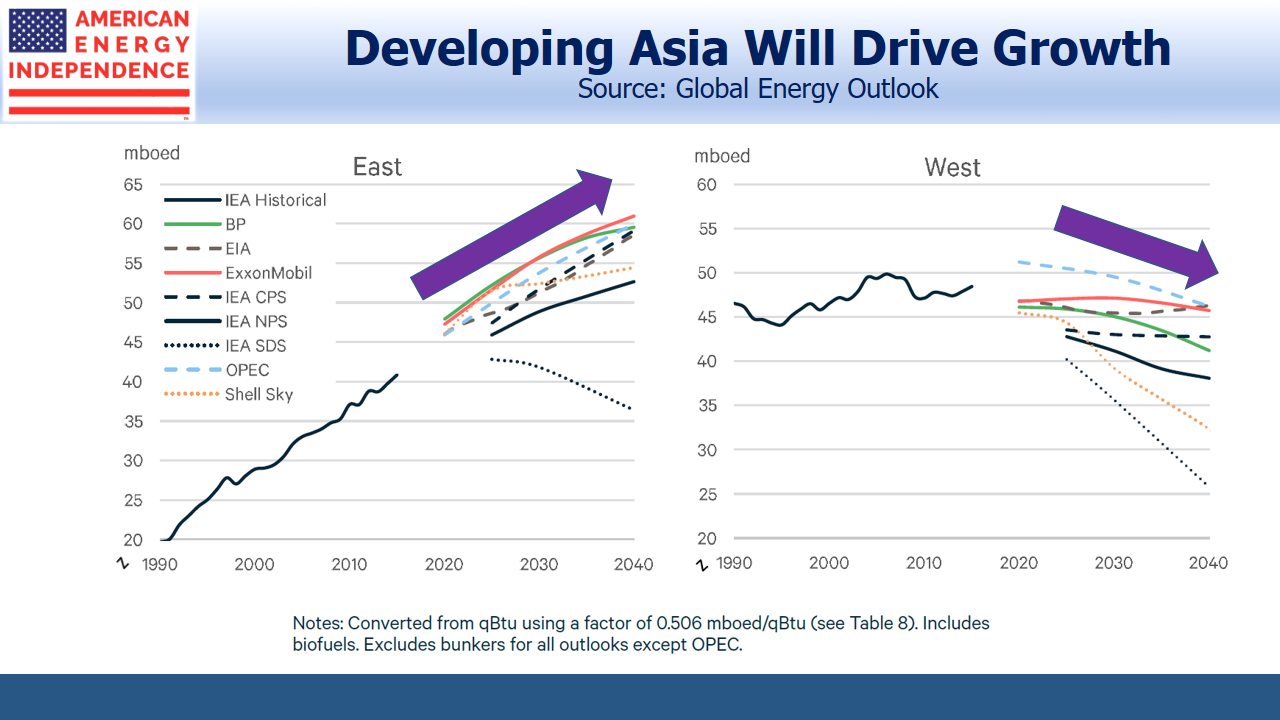
Surprisingly given the diverse set of forecasts and long horizon, there is reasonable consensus in some key areas. Energy consumption will continue to grow, driven by rising living standards in developing countries and increased population. Lowering CO2 emissions pits wealthy countries (“West” in GEO terminology, meaning Europe, Eurasia, North America, South and Central America) willing and able to constrain energy use against the aspiration to western living standards in non-Japan Asia (“East” in GEO which is Asia-Pacific but includes Africa and the Middle East). An estimated 1.1 billion people don’t have access to electricity today.

.avia-image-container.av-2to8ynk-6662a391958aa85dac7b0426fb4f8c60 img.avia_image{ box-shadow:none; } .avia-image-container.av-2to8ynk-6662a391958aa85dac7b0426fb4f8c60 .av-image-caption-overlay-center{ color:#ffffff; }

Asia Will Drive more Growth in Energy Consumption

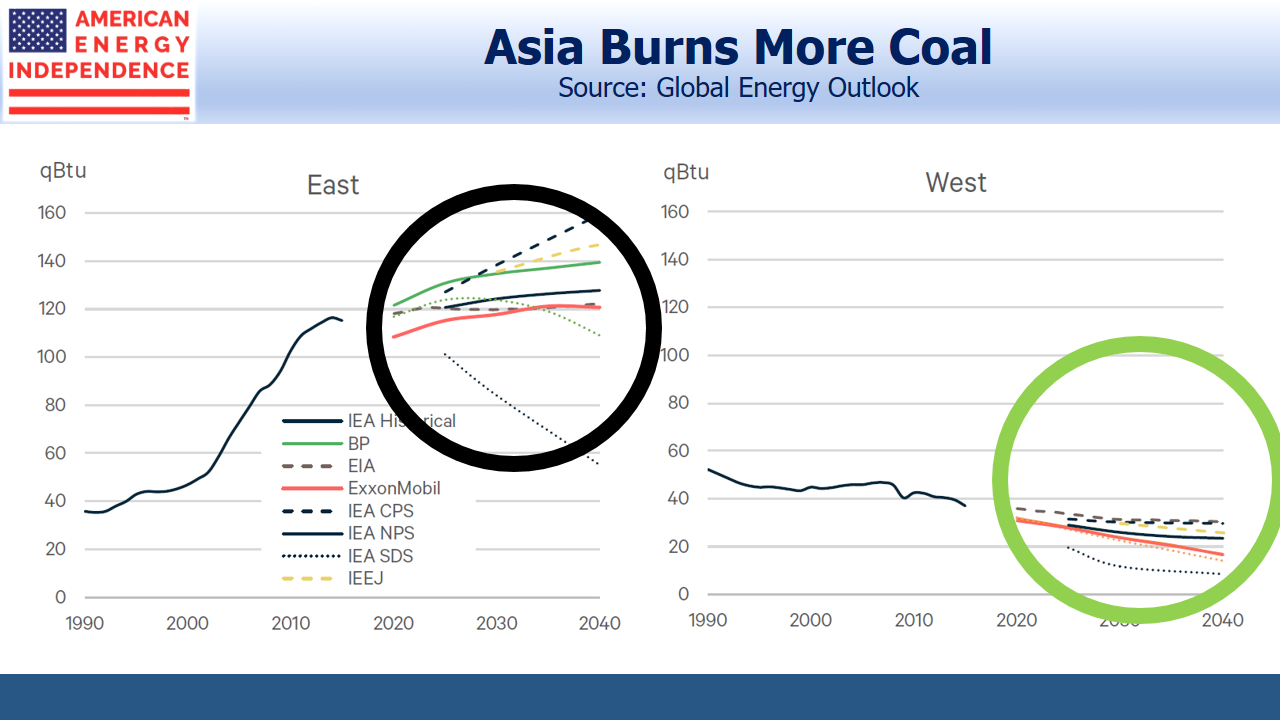
Consumption of oil and related liquids reflects greater auto ownership, aviation and plastics use in the East, more than offsetting improved efficiencies which will curb demand in the West. But the bigger challenge remains global coal consumption, where East and West are moving in opposite directions. China alone burns 6X as much coal as the U.S.  In fact, China consumed more coal last year than the rest of the world combined.  Any path to reduced climate change with today’s technologies includes sharply reduced coal consumption.

.avia-image-container.av-2liq9f4-9d5163c11d3e3e00e060234d6fbdee64 img.avia_image{ box-shadow:none; } .avia-image-container.av-2liq9f4-9d5163c11d3e3e00e060234d6fbdee64 .av-image-caption-overlay-center{ color:#ffffff; }

Asia Burns More Coal

Substitution of natural gas for coal underpins our constructive outlook for U.S. exports of Liquified Natural Gas (LNG). Even on current policies most GEO forecasts see steady growth in natural gas. If the countries of the East decide to use less coal than most forecasts expect,LNG should see additional demand growth.

.avia-image-container.av-1te6cwg-572a8cc5ebdc15f54346b4d0c49db1f4 img.avia_image{ box-shadow:none; } .avia-image-container.av-1te6cwg-572a8cc5ebdc15f54346b4d0c49db1f4 .av-image-caption-overlay-center{ color:#ffffff; }

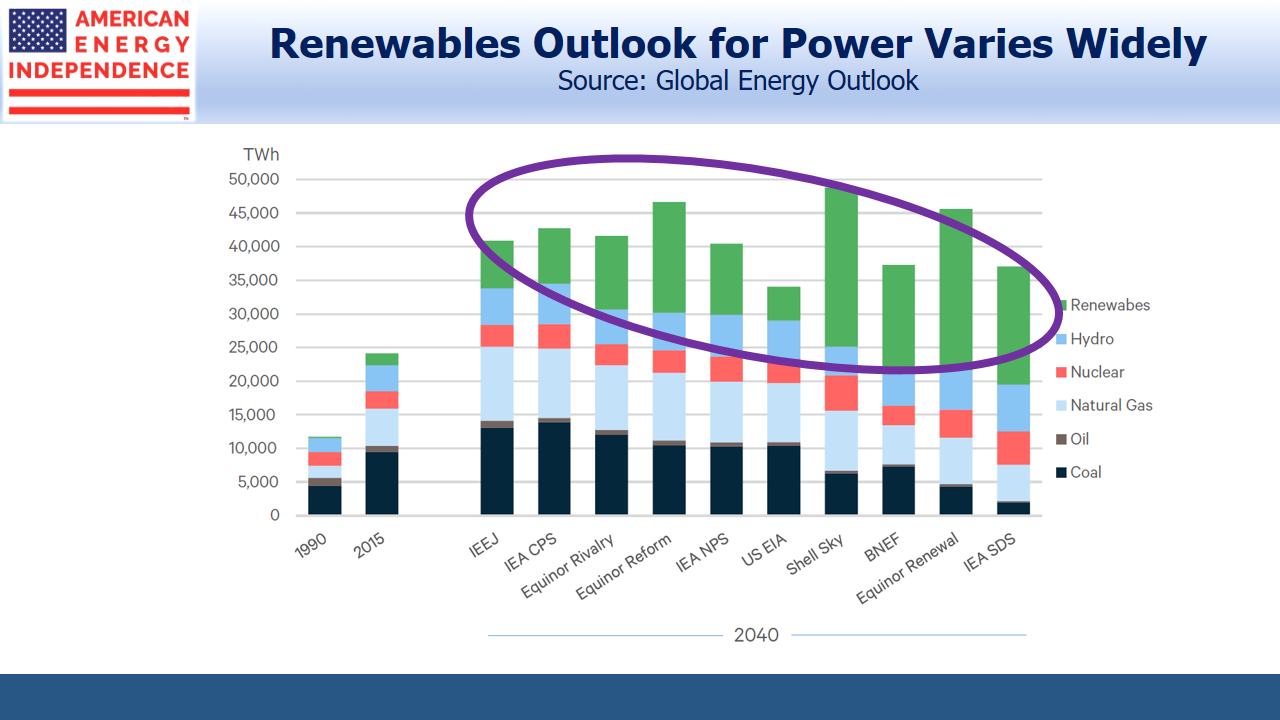
Renewables Outlook For Power Varies

By contrast with natural gas, views on renewables vary widely. The International Energy Agency’s “Sustainable Development Scenario”, which incorporates policies to lower CO2 emissions, sees 4X as much renewable power generation as the U.S. Energy Administration’s “Reference Case”.

.avia-image-container.av-1bm5dlc-f82d0f452108da2746b383c836d217ff img.avia_image{ box-shadow:none; } .avia-image-container.av-1bm5dlc-f82d0f452108da2746b383c836d217ff .av-image-caption-overlay-center{ color:#ffffff; }

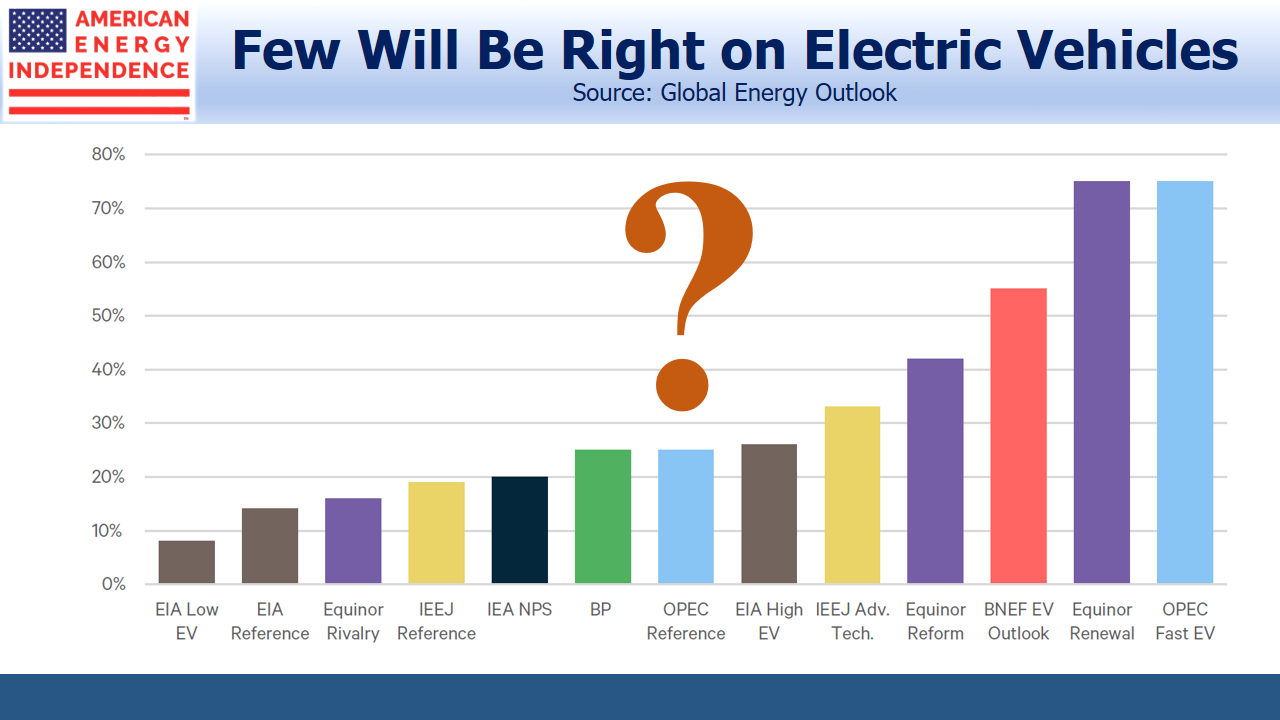
EV Forecasts Vary

Electric vehicles (EVs) are marketed as a reduced CO2 solution, although when you properly account for emissions in their manufacture and battery disposal, the benefits are murky. It also depends on how the electricity used is generated. Wyoming relies exclusively on coal, making a Tesla purchase in the Cowboy State an environmentally unfriendly choice. Estimates of global EV penetration in two decades vary widely.

.avia-image-container.av-zhx2nk-ec675053bad656720173b522c2bf5b54 img.avia_image{ box-shadow:none; } .avia-image-container.av-zhx2nk-ec675053bad656720173b522c2bf5b54 .av-image-caption-overlay-center{ color:#ffffff; }

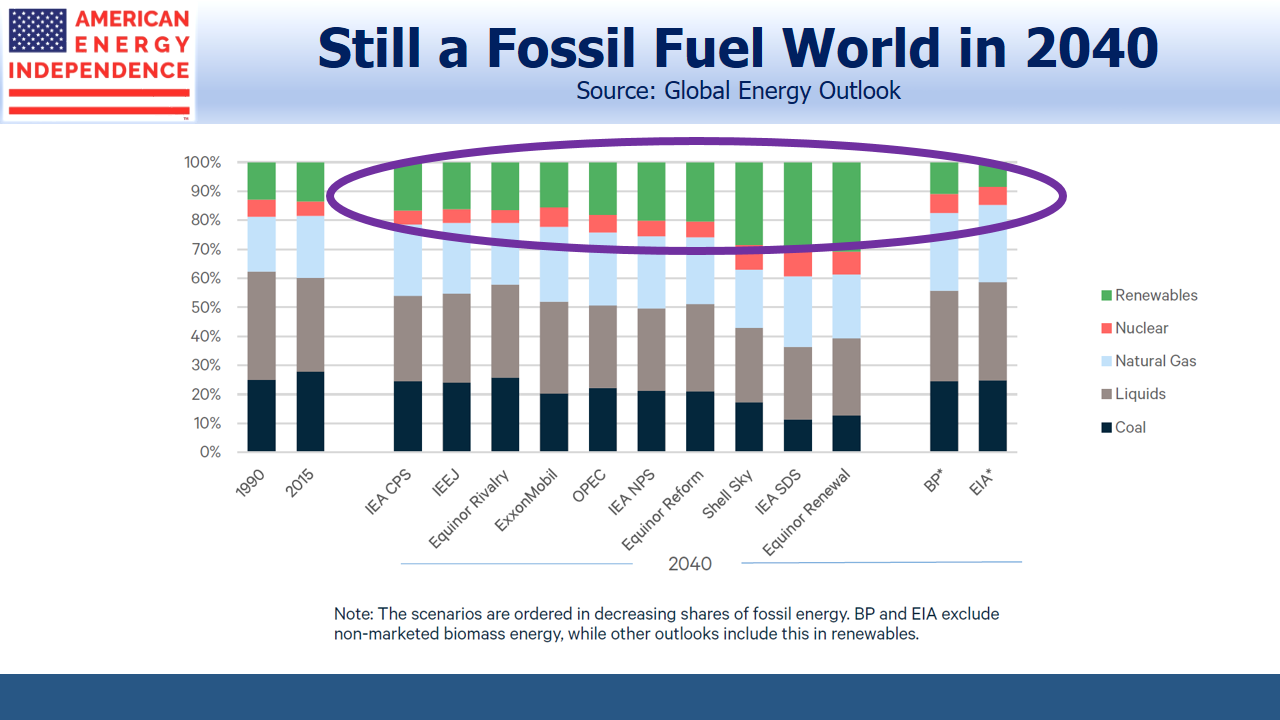
Still a Fossil Fuel World

Most of the promise of renewables lies in their generation of clean power, and electrification of the world’s energy consumption is part of any attempt to tackle climate change. But the production of steel, cement, fertilizer and plastics rely on the high heat generation and other chemical properties of fossil fuels. Aviation is unlikely to use batteries in the foreseeable future. The result is that renewables penetration of total primary energy is expected by most forecasts to increase modestly,  to around 20%.

The conflict between energy use and emissions is shown in the three forecasts that incorporate reduced CO2. Two of them assume falling energy consumption, which seems politically implausible for countries of the East barring transformational improvements in the technology around energy use and storage.

.avia-image-container.av-wx3lg0-f6cc298d2ea3f265622274ba0fdb63b7 img.avia_image{ box-shadow:none; } .avia-image-container.av-wx3lg0-f6cc298d2ea3f265622274ba0fdb63b7 .av-image-caption-overlay-center{ color:#ffffff; }

Every energy investor needs to stay current on trends and developments in energy use. The GEO report is a useful reference guide.

SL Advisors is the sub-advisor to the Catalyst MLP & Infrastructure Fund.  To learn more about the Fund,  please click here.

SL Advisors is also the advisor to an ETF (USAIETF.com).


The Next 20 Years In Energy

.flex_column.av-jjrmf7ps-c67a8c8c03a15c49af60226d5c45e3c8{ border-radius:4px 4px 4px 4px; padding:10px 10px 10px 20px; background:url(https://sl-advisors.com/wp-content/uploads/2018/07/HOME-BGBANNER-hero.jpg) 0% 0% no-repeat scroll ; }

AMERICA IS IN THE MIDST OF AN ENERGY REVOLUTION.

By capitalizing on American technology, ingenuity, and frontier spirit, the Shale Revolution—driven by horizontal drilling and fracking—is turning the world’s energy markets upside down.


#top #wrap_all .avia-button.av-4wqy6e-4c08ee8d8c803daa5c808a3a051a78a4{ margin-bottom:20px; margin-right:10px; margin-left:10px; } ETF #top #wrap_all .avia-button.av-bfwfb-1e3addcf37f1ad9c5f4de238b8677652{ margin-bottom:20px; margin-right:10px; margin-left:10px; } Mutual Fund

#top .hr.hr-invisible.av-jjkejdzy-45d69def6fcd4634d81723d4107c2a5c{ height:50px; }


Webinar: Pipelines Gushing Cash

.flex_column.av-jjrmf7ps-c67a8c8c03a15c49af60226d5c45e3c8{ border-radius:4px 4px 4px 4px; padding:10px 10px 10px 20px; background:url(https://sl-advisors.com/wp-content/uploads/2018/07/HOME-BGBANNER-hero.jpg) 0% 0% no-repeat scroll ; }

AMERICA IS IN THE MIDST OF AN ENERGY REVOLUTION.

By capitalizing on American technology, ingenuity, and frontier spirit, the Shale Revolution—driven by horizontal drilling and fracking—is turning the world’s energy markets upside down.


#top #wrap_all .avia-button.av-4wqy6e-4c08ee8d8c803daa5c808a3a051a78a4{ margin-bottom:20px; margin-right:10px; margin-left:10px; } ETF #top #wrap_all .avia-button.av-bfwfb-1e3addcf37f1ad9c5f4de238b8677652{ margin-bottom:20px; margin-right:10px; margin-left:10px; } Mutual Fund

#top .hr.hr-invisible.av-jjkejdzy-45d69def6fcd4634d81723d4107c2a5c{ height:50px; }

.avia-video.av-jlcbu1ku-6ab11af8b338aa5f1771ccd0850d41dc{ background-image:url(https://sl-advisors.com/wp-content/uploads/2019/07/Money_Pipeline.png); }


Still Fearing Another Financial Crisis

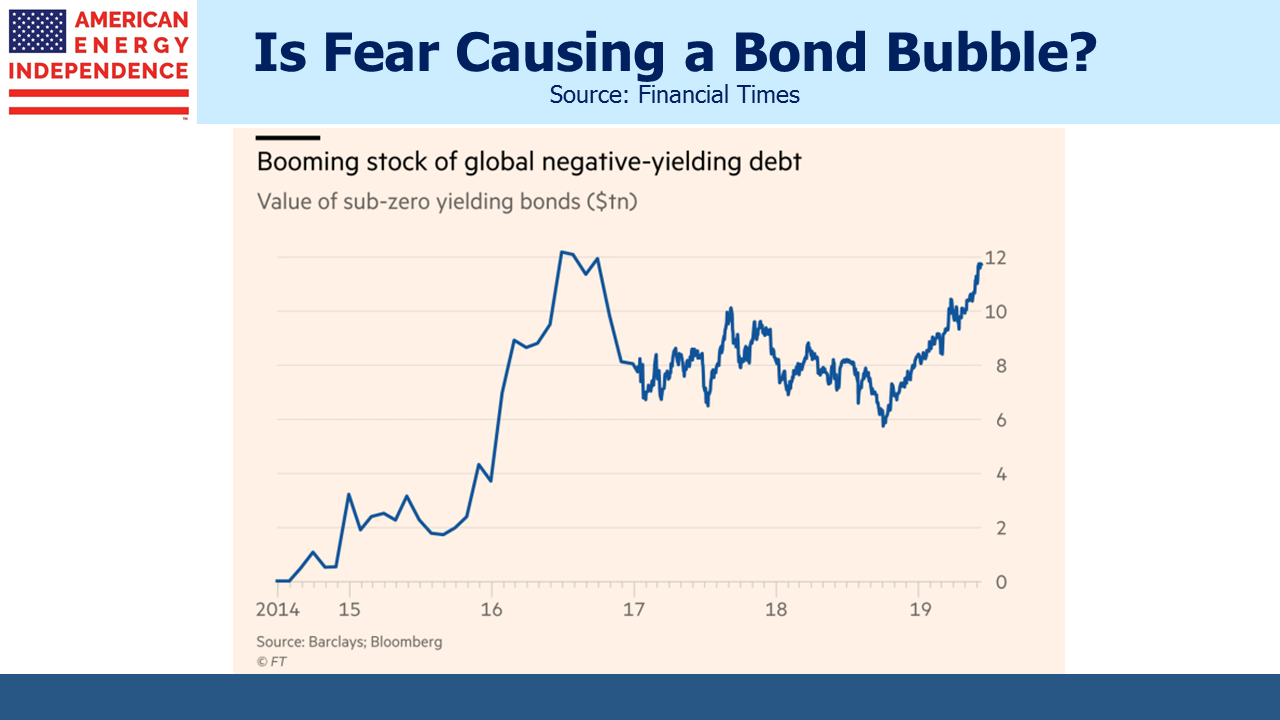
“Concerns about trade and Gulf tensions spur rush towards sovereign debt.” warned the Financial Times last week. Almost $12 trillion in bonds trades at a negative yield.  According to Tim Winstone, fixed income portfolio manager at Janus Henderson, “Investment grade is nuts. About 24% of my benchmark yields less than zero.” Even a dozen European junk bond issues trade with negative yields.

The comments by Tim Winstone reveal much about investor risk appetites today. As a fixed income manager, his job is to pick bonds and stay invested. His clients have already made their asset allocation choice. While he might rationally choose to shun junk bonds in favor of equities, which at least have the potential of a positive return, his mandate doesn’t offer such flexibility.

Colin Purdy, Chief Investment Officer at Aviva Investors, explained, “For some investors, there is an acceptance that it’s not about absolute returns, but relative returns.” This is true to a point, but most investors would add that positive nominal returns are a priority.

Firms that invest in bonds for clients are grappling with an excess of demand versus supply. Rigid fixed income allocations that are insensitive to return reflect extreme risk aversion.

.avia-image-container.av-wy8bgv-bb302609df3698f41b718d5701b61e40 img.avia_image{ box-shadow:none; } .avia-image-container.av-wy8bgv-bb302609df3698f41b718d5701b61e40 .av-image-caption-overlay-center{ color:#ffffff; }

Market participants are drawing different conclusions from this. A common misconception is that bonds reflect looming trouble for stocks. Someone once explained to me that bond buyers are naturally a dour bunch because we just want our money back, while equity buyers can dream of unlimited upside. But just because fixed income investors look more closely at balance sheets doesn’t mean that they’re always right.

If yields reflect extreme risk aversion, so do P/Es. While there’s no shortage of observers warning that stocks are over-priced, a lot of money that could buy equities is scared, preferring to own negative-yielding bonds instead. The conclusion must be that fear of another financial crisis runs wide and deep.

Infrastructure offers the stability of bonds with the upside of equities. This is especially true of midstream energy infrastructure (see The Coming Pipeline Cash Gusher). Valuations reflect the expectation of equity volatility with bond-like returns, but every quarter balance sheets strengthen, cash flows increase. Current holders are benefiting.

Last week, in Real Returns On Bonds Are Gone, we showed how much equities could appreciate before becoming historically expensive versus bonds. The quotes above from fixed income managers reflect widespread institutional risk aversion. At some level you might think firms would turn money away rather than invest it for negative returns. But they don’t, and it therefore falls to clients to impose more discriminating criteria.

What seems clear is that if stocks fall 25%, many investors will be comfortably positioned in fixed income. Their equity exposure was already set for that possibility.

But if none of the bad things people fear happen, and bonds fall, poor returns will be exacerbated by negative starting yields. The stock market continues to climb the wall of worry. Surprises will cause a drop, but the plausible negative events are priced in.

SL Advisors is the sub-advisor to the Catalyst MLP & Infrastructure Fund.  To learn more about the Fund,  please click here.

SL Advisors is also the advisor to an ETF (USAIETF.com).


Is NextEra Running in Place?

Investing in midstream energy infrastructure today means pipelines, storage, gathering and processing and all the physical networks that sit between oil and gas wells and their customers. It doesn’t have to be limited to servicing non-coal fossil fuels. We research and think about other sources of energy including nuclear, renewables and coal.  We prefer the more visible cashflows that come with handling and transporting energy over the cyclicality and capital intensity of production and generation. It’s why we have avoided upstream oil and gas, coal mining, and power generation companies.

Mining and burning coal releases many pollutants including nitrous oxide, sulfur dioxide, particulate matter and other pollutants. It is in long-term decline in North America.  Furthermore, transportation is by rail and ship, which have lower barriers to entry than pipelines.

Public opposition to nuclear has added uncertainty and harmed economics, which makes investing unattractive.

However, renewables offer the opportunity for both long haul transmission lines and large scale storage. These are two areas with the potential for visible, persistent cashflows, although today there are few opportunities for scale and pure plays. Renewable generation is largely owned by utilities within portfolios that include coal, natural gas, and nuclear assets.

.avia-image-container.av-7f16k4-45252c0f5e7197e49cbc6cf8ebcdc456 img.avia_image{ box-shadow:none; } .avia-image-container.av-7f16k4-45252c0f5e7197e49cbc6cf8ebcdc456 .av-image-caption-overlay-center{ color:#ffffff; }

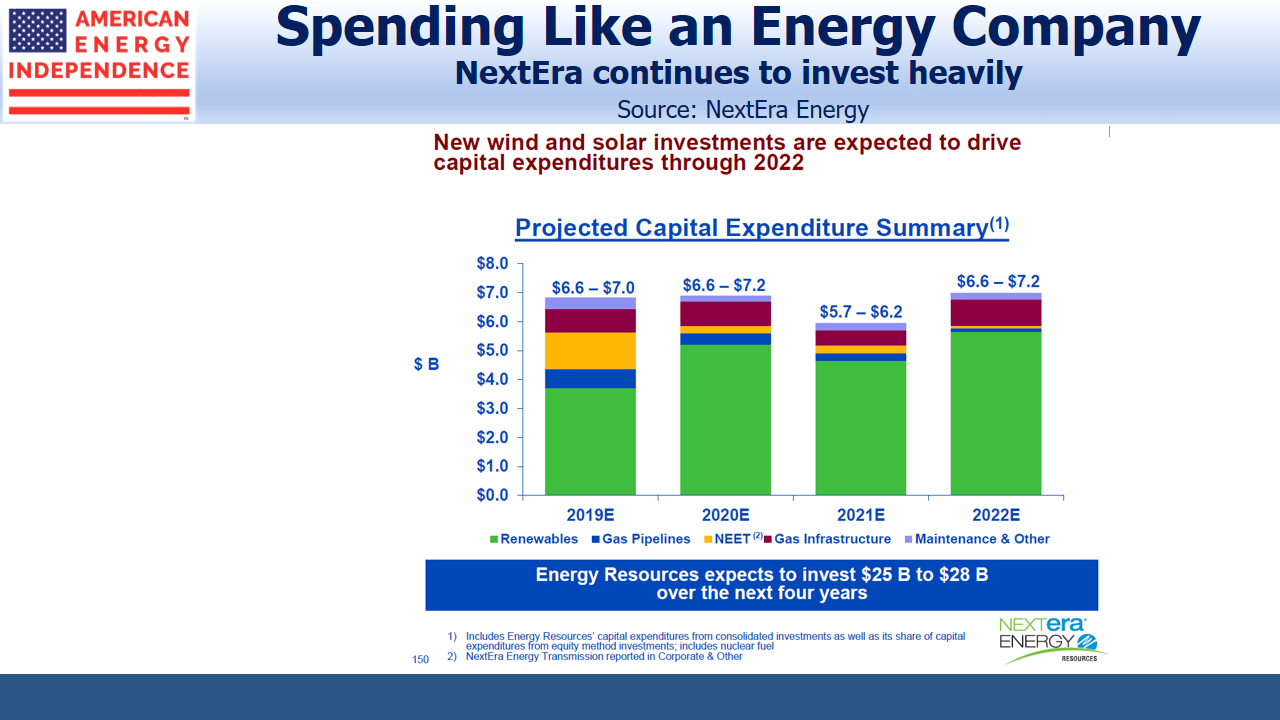
NextEra Energy Projected Capital Expenditures

An exception is NextEra Energy (NEE), the world’s biggest producer of wind and solar energy. They’re the largest component of the SPDR Utilities ETF (XLU). On a list of countries ranked by wind power generation, they would be 8th. Just as the Shale Revolution has created ample opportunities to invest capital for growth, so has the burgeoning renewables business in the U.S., albeit with a wholly different response from investors.

Although energy investors have revolted against endless investments in more production and additional pipelines, NEE investors cheer the company’s stepped up commitment to renewables. Over the past year, their stock has returned 24%,  8% ahead of the S&P500 and 16% ahead of XLU. From 2015-18 NEE’s capex rose from $3.9BN to $6BN, a pace they expect to maintain over the next four years. They’re planning the world’s biggest battery center by a factor of 4X, in central Florida, to store intermittent renewable energy for later use when it’s not sunny or windy.

.avia-image-container.av-1rgc7kk-f9eb11f4da4de9befbb406a04e5ea9a1 img.avia_image{ box-shadow:none; } .avia-image-container.av-1rgc7kk-f9eb11f4da4de9befbb406a04e5ea9a1 .av-image-caption-overlay-center{ color:#ffffff; }

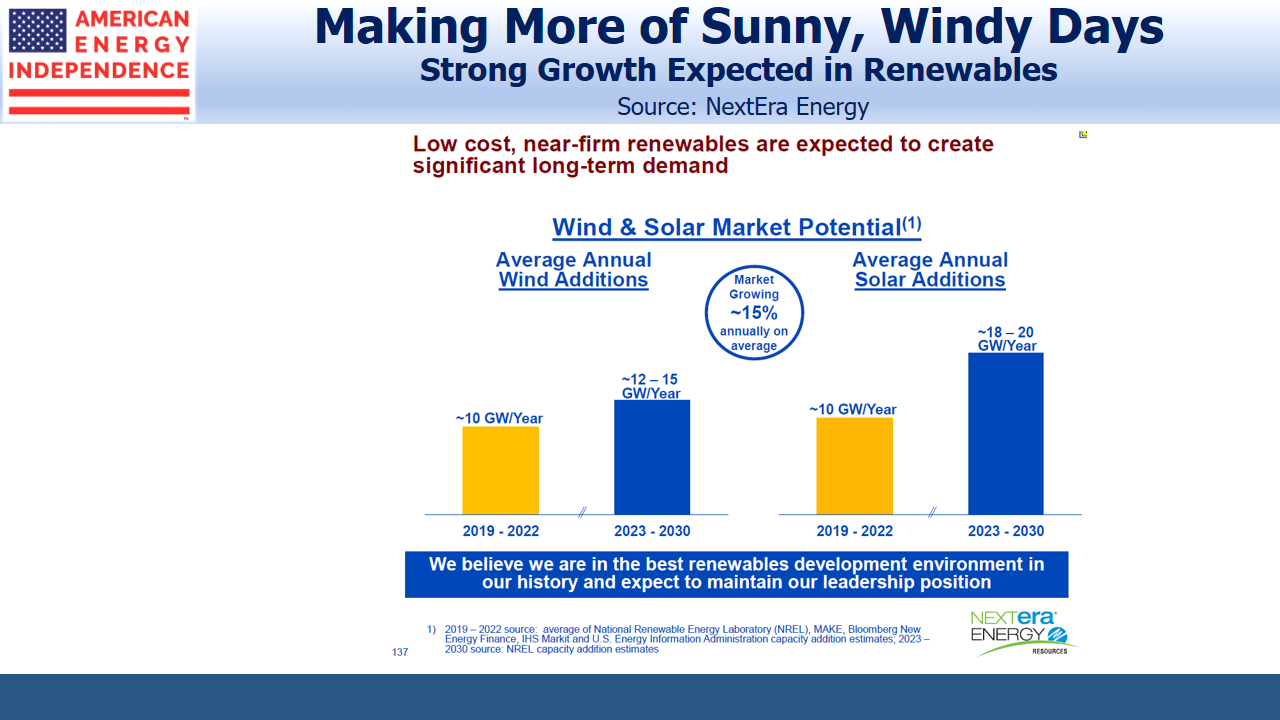
Strong Growth Projected in Renewables

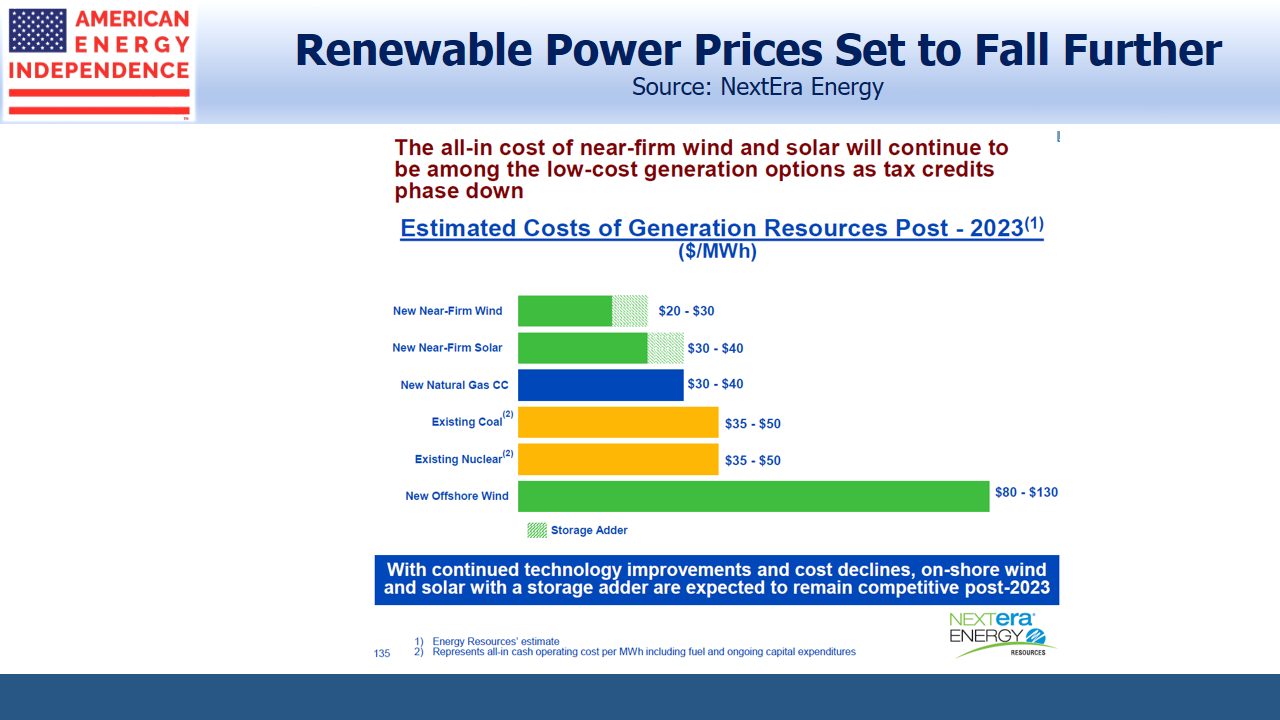
Much of this investment will be in new wind and solar generation, a sector NEE expects to enjoy 15% annual growth through 2030. This growth will be driven by declining prices for produced power. NEE expects improving technology to bring the cost per Megawatt Hour for wind and solar below all other sources.

CEO Jim Robo recently led an investor day during which his team enthused about the being a low-cost renewables company delivering the benefits of clean energy to customers and investors.

.avia-image-container.av-11tzh78-5b8cee6c68e9934421e565a20b84d17a img.avia_image{ box-shadow:none; } .avia-image-container.av-11tzh78-5b8cee6c68e9934421e565a20b84d17a .av-image-caption-overlay-center{ color:#ffffff; }

Renewables Power Prices to Fall

But here’s the catch. The company is plowing capital into assets that will depreciate, because continued efficiencies will lower the price of produced power. It’s analogous to holding a huge inventory of microchips when Moore’s Law dictates that the cost of computing power falls by 50% every 18 months; or of stocking millions of iphones, when the next version will drive down the price of the old ones.

Rapid advances in technology cause deflation in assets. While Intel and Apple have shown that it’s highly profitable to manufacture products with continuous improvement, NEE is on the other side of this trade.

It means that every windmill they install and every battery facility they build is worth less than it cost from the moment it begins operation. The falling cost of renewable energy, which is driving their pursuit of growth, threatens to erode the pricing power of the assets they’re developing.

Correctly assessing the cash flow generating capability of a new solar facility must be hard. NEE can depreciate their property, plant and equipment (PP&E) based on the physical useful life of what they’ve bought, but the impact on cashflows from future pricing pressure is less clear. As their installed asset base ages, they’ll become less competitive, unless they constantly reinvest to upgrade their depreciating equipment. They face a constant uphill struggle to maintain competitive, cost-effective assets.  Eventually, they’ll reach a cash flow cliff as their contracts roll off.

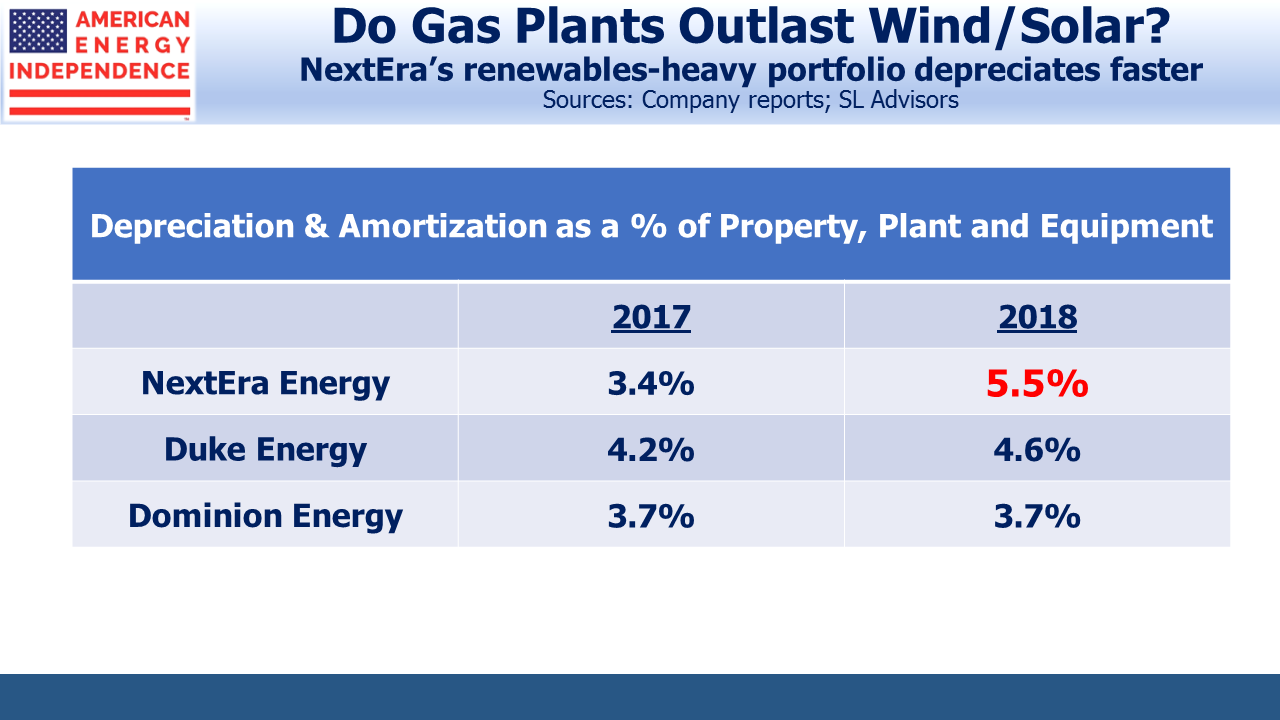
In 2018, NEE’s depreciation of its renewables-heavy PP&E jumped, and is now higher than peers Duke Energy (DUK) and Dominion Energy (D), the 2nd and 3rd largest components of XLU respectively. At $3.9BN, it was two thirds of their growth capex. In other words, two thirds of their capex is spent to preserve the value of their PP&E. Assuming straight line depreciation, NEE expects its existing asset base to have a useful life of just over 18 years, which contrasts with the 35X earnings multiple assigned its stock by the market. Free Cash Flow has been declining as a percentage of net income, and will shift negative this year.

.avia-image-container.av-nkeys4-3390db91c605d20d63f8c35b1747a78e img.avia_image{ box-shadow:none; } .avia-image-container.av-nkeys4-3390db91c605d20d63f8c35b1747a78e .av-image-caption-overlay-center{ color:#ffffff; }

NEE is a company that’s investing heavily in the future, but will always be racing against advances in renewable technology. A purchase delayed will provide cheaper power, later. Advances in renewables may one day cause an impairment charge on old assets struggling to compete. A 10% write-down in PP&E would wipe out a year’s profits.

The irony is that pipelines regularly raise prices, and the sector has been punished by investors for spending on new infrastructure to transport growing oil and gas output. Disruptive pipeline startups are rare, because expanding an existing pipeline brings network effects and is cheaper than building new. Moreover, FERC’s regulatory framework  recognizes the oligopolistic role pipelines play and is designed to limit egregious pricing.

By contrast, NEE is being rewarded for investing heavily in assets whose pricing power diminishes. It’s true their customers are locked in via long term power purchase agreements. One of these is being challenged by bankrupt PG&E in California, although NEE is confident it will be upheld. But they still face the risk of lower-priced competition in the future, and no-one knows if regulators will allow them to charge customers rates above what new power assets would dictate indefinitely. Their potential competitors include new entrants unburdened by legacy, inefficient infrastructure. Even their customers can turn into energy providers by adding rooftop solar panels. The technology around renewables and battery storage continues to improve, creating the possibility of further disruption by new entrants.

We don’t own NEE. By all accounts they are a well-run company. Their progress will provide a useful guide to the growth of renewables in the U.S. and their ultimate profitability.

SL Advisors is the sub-advisor to the Catalyst MLP & Infrastructure Fund.  To learn more about the Fund,  please click here.

SL Advisors is also the advisor to an ETF (USAIETF.com).


Real Returns On Bonds Are Gone

A recent short term strategy outlook from a large buyside firm walked through market expectations for Fed policy, S&P earnings, the election and drew conclusions about the likely direction of stocks over the next six months. Such analysis is endlessly fascinating even if trading profits are unreliable.

The essay touched on, but didn’t examine, what must be the biggest force driving markets – persistently low interest rates.

The real return on ten year treasury notes going back almost a century is 2%. Given 2% inflation, a neutral Fed should cause long term yields to drift up towards 4%. The Fed has been manipulating rates lower for most of the past decade since the 2008-9 financial crisis, but last year the bond buying ended and short term rates began moving higher. Yet ten year note yields peaked at 3.3% in November before descending to 2% recently.

Clearly, the historic relationship has changed. The balance between demand for and supply of safe, long term assets has shifted. Bond investors collectively have accepted lower future returns. There is plenty of interesting academic research to explain why. Real interest rates have been in decline for thirty years, as shown in this chart from the Federal Reserve Bank of Minneapolis. They now appear to be negative, as defined by the average short term rate over the past decade.

.avia-image-container.av-nnt4wr-1f739620bb86586fc085b60a6b3eabed img.avia_image{ box-shadow:none; } .avia-image-container.av-nnt4wr-1f739620bb86586fc085b60a6b3eabed .av-image-caption-overlay-center{ color:#ffffff; }

Although many commentators fret over what they perceive as unsustainably high stock prices, the plausible explanations for low interest rates largely reflect reduced risk tolerance by investors. While the decline in real rates has been steady, gross fixed investment fell sharply in the U.S. during the financial crisis and has barely recovered. This implies companies have remained cautious, dampening the issuance of long term corporate debt.

.avia-image-container.av-1h1derf-4f1100e59569b03afb1c2ba4c262bc37 img.avia_image{ box-shadow:none; } .avia-image-container.av-1h1derf-4f1100e59569b03afb1c2ba4c262bc37 .av-image-caption-overlay-center{ color:#ffffff; }

Another factor, highlighted in The Safe Asset Shortage (Caballero et al), notes that the financial crisis and subsequent Eurozone crisis led to a reassessment of which assets really were safe. Debt issued by FNMA and FHMC was assumed to be more risky following their conservatorship by the U.S. Unsatisfied demand for AAA debt instruments led Wall Street to produce Collateralized Debt Obligations (CDOs), which sought to pool riskier debt and repackage it into tranches of varying risk. But it turned out that the AAA tranche of a CDO retained some tail risk that sovereign debt did not. This perspective blames the 2008 crisis on unmet demand for safe assets.

.avia-image-container.av-1510f97-8f55a025659f33984c6aadea073345a5 img.avia_image{ box-shadow:none; } .avia-image-container.av-1510f97-8f55a025659f33984c6aadea073345a5 .av-image-caption-overlay-center{ color:#ffffff; }

Safe Assets Pre_Post_Crisis

Oddly, Caballero concludes that German and French sovereign debt similarly lost their allure. However, their yields are more than 2% lower than U.S. equivalents and solidly negative, which suggests ample holders willing to pay for what they perceive as highly safe investments.

Although memories of the financial crisis are receding, it seems to have permanently lowered risk tolerance. This, combined with a reduced supply of safe assets and perhaps the demographics of aging populations in wealthy countries have moved equilibrium long term rates lower. In recognition of this, the Fed has been adjusting their own long term equilibrium rate down in recent years.

A compelling solution is for a substantial increase in government funded infrastructure investment. This would take advantage of demand for long term debt and, assuming better infrastructure raised productivity, would not increase debt:GDP.

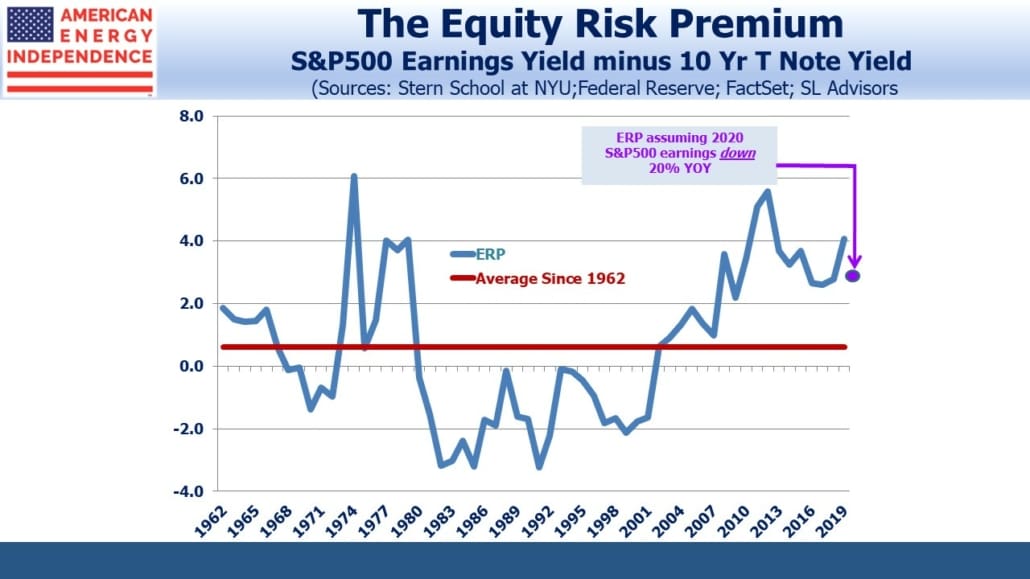
The shortage of safe assets is also reflected in the Equity Risk Premium (ERP), the difference between the earnings yield on the S&P500 and ten year treasury yields. It shows that stocks are cheap relative to bonds.

.avia-image-container.av-u0o5uj-ef5be190ec0c3f4d5844cbb54674316b img.avia_image{ box-shadow:none; } .avia-image-container.av-u0o5uj-ef5be190ec0c3f4d5844cbb54674316b .av-image-caption-overlay-center{ color:#ffffff; }

Since any investment is worth the net present value of its future cashflows, discounted at an appropriate interest rate, this has profound implications for stocks. Bond yields that are permanently lower suggest that stocks need to adjust substantially higher before fixed income can offer a competitive return.

The historically wide ERP underpins an investor’s choice to overweight equities. A return to its 50-year average of 0.6 (versus 3.6 today) isn’t imminent. But if next year it narrows halfway, to 2.1, and earnings grow by the 11% Factset bottom-up forecast, the S&P500 will be at around 4,400, nearly 50% higher than today.

U.S. energy infrastructure is an even better bet than the broader equity market. The shortage of high quality long term assets makes this sector especially attractive, as private equity funds seem to appreciate more readily than public markets.

Whatever the causes of permanently low interest rates, they strengthen the case for owning equities.

Join us on Thursday, July 11th at 1pm EST for a webinar. We’ll discuss the pipeline sector’s growing Free Cash Flow. To register, please click here.

SL Advisors is the sub-advisor to the Catalyst MLP & Infrastructure Fund.  To learn more about the Fund,  please click here.

SL Advisors is also the advisor to an ETF (USAIETF.com).


Reviewing Russell Gold’s The Boom

Although Russell Gold’s The Boom: How Fracking Ignited the American Energy Revolution and Changed the World is now almost five years old, it still provides a relevant commentary on America’s Shale Revolution. Unlike many other chroniclers of America’s energy renaissance, Gold managed to obtain an invitation to see first-hand how drillers unlock hydrocarbons from shale. We already know it’s a noisy, dirty process that’s highly disruptive to the local community. But we also learn about the intersection of science with the brute force required to fracture the rock holding the commodity. Huge trucks carrying water and pump trucks converge on the drilling site. Inside the trailer where technicians control the process, “The computers, the headphones, and the focused faces make the van feel a bit like a NASA command center.” But they’re still oil sector workers, so better resemble a NASCAR pit crew working at NASA.

.avia-image-container.av-kjccp0-bb20d200c732541b0211e464317c6356 img.avia_image{ box-shadow:none; } .avia-image-container.av-kjccp0-bb20d200c732541b0211e464317c6356 .av-image-caption-overlay-center{ color:#ffffff; }

The Boom By Russell Gold

Gold highlights Shale’s huge benefits to the U.S. Oil companies have known for decades that impenetrable source rock held enormous reserves. Early efforts at fracturing it used high explosives, and in the 1960s there was serious discussion about using nuclear bombs. Between 1969 and 1973 several nuclear devices bigger than the one dropped on Hiroshima were detonated underground to release natural gas. Subsequent production wasn’t impressive, and poor economics as well as environmental concerns soon ended such efforts.

The author balances the positives with concerns about drilling’s local environmental impact, as well as the continued use of fossil fuels. He concludes that increasing natural gas use is the preferred outcome because it displaces far dirtier coal plants for electricity generation. In time, like many observers, he expects renewables to dominate, but that’s still likely decades away. Battery storage continues to be a significant hurdle to relying on intermittent sources of energy such as solar and wind. Bill Gates noted this in a recent blog, writing that, “…solar and wind are intermittent sources of energy, and we are unlikely to have super-cheap batteries anytime soon that would allow us to store sufficient energy for when the sun isn’t shining or the wind isn’t blowing.”

It turns out oil is a fantastically efficient form of energy storage. A memorable illustration comes from a speech by Steven Chu, former U.S. Energy Secretary under Obama. In comparing different materials for their energy density per unit of weight, or volume, he noted that, “The most efficient energy sources were diesel, gasoline and human body fat” (italics added). Apparently, an ample girth has energy storage capabilities to which battery developers aspire in their labs. Chu added that a battery holding a comparable amount of energy would require eighty times more space and weight. This was back in 2010, but today’s best batteries still don’t come close.

Gold identifies privately owned mineral rights as a crucial difference between America and the rest of the world. Although English Common Law underpins the U.S. legal system, sovereign ownership of what’s underground is one attribute that happily didn’t cross the Atlantic. The sharing of wealth with the community where drilling takes place is an important pillar of support. In 2014 when The Boom was published, fifteen million Americans lived within a mile of a well that had been fracked within the past few years. Today’s it’s certainly more. Although proximity produces supporters and opponents, generally fracking happens where it’s welcome, which is as it should be. Since Gold’s initial interest in the subject was due to Chesapeake buying drilling rights on his family’s farm, his perspective is well informed.

The rise and fall of Aubrey McLendon, late founder of Chesapeake, take up two chapters. McLendon was a colorful character who thought big and took the industry to higher gas production than would have happened without him. The Boom was published before McLendon’s fiery death in an automobile accident. It looked like suicide, occurring in March 2016 when the energy collapse was straining his high risk business strategy, but was later ruled accidental.

It’s also interesting to learn about the career of George Mitchell, often called the father of fracking. Mitchell’s persistence with unlocking shale reserves where others had given up is now industry legend.

The Boom deserves a place on the bookshelf of anybody interested in learning more about the Shale Revolution.

Join us on Thursday, July 11th at 1pm EST for a webinar. We’ll discuss the pipeline sector’s growing Free Cash Flow. To register, please click here.

SL Advisors is the sub-advisor to the Catalyst MLP & Infrastructure Fund.  To learn more about the Fund,  please click here.

SL Advisors is also the advisor to an ETF (USAIETF.com).