The Hard Math Of The Energy Transition

Getting to zero emissions by 2050, the goal set by the UN in order to limit global warming to 1.5° C above pre-industrial times, is technically well within reach. Not with intermittent solar panels and windmills – extracting all the minerals necessary for their manufacture plus enormous battery back-up in implausible.  Kinder Morgan’s enhanced oil recovery process pumps CO2 into mature oil wells to push out additional crude. This is Carbon Capture, Use and Sequestration (CCUS). The CO2 emitted by power plants, cement and steel factories and other industrial users can also be captured for permanent burial without being used (CCS).

There is reported to be bipartisan support for a CCS tax credit of up to $150 per metric tonne (MT), a level many in the industry believe would spur investment in the necessary infrastructure. The US emits just under 5 Billion Tonnes (BT) of CO2 from fossil fuel combustion annually. As a simple example, assuming transportation went fully electric, swapping gasoline for natural gas to produce more electricity, at $150 per MT we’d spend $750BN eliminating energy-related CO2. This is just under 4% of GDP, roughly the same as our defense budget.

JPMorgan estimates that to sequester 15-20% of US CO2 emissions via CCS would require moving 1.2 billion cubic meters of CO2 – more volume than US crude oil production. This would require a lot of new infrastructure.

Direct Air Capture (DAC) removes CO2 from the air. This is another technically feasible strategy, especially if the world misses the UN’s goal and needs to remediate. Although one might think the atmosphere is swollen with CO2, it’s currently around 412 parts per million, or 0.0412%. This relatively low concentration means a lot of air needs to be processed to remove a MT of CO2. By contrast, power plant emissions range from 1-15% CO2 and chemical/industrial plant emissions are from 20-95%.

JPMorgan recently published a research paper examining prospects for DAC. There are two main technologies, one using a liquid and the other a solid which bind to the CO2 in air passed over them. Climeworks operates a prototype facility in Switzerland.  DAC uses energy. JPMorgan estimates 4.9GJ per MT of CO2 removed, or 1.37 Megawatt Hours (MwH).

To put this in perspective, if the US chose to remove the 5 BT of energy-related CO2 released annually, this would require 6.8 Terawatt Hours (TwH) of electricity. We currently generate 4.1 TwH – and if this 6.8 TwH of additional electricity wasn’t generated from 100% renewables there would be further CO2 capture required.

JPMorgan estimated a range of costs for DAC of between $191 and $454 per MT. At some scale the price could be at the low end of the range but could also exhaust availability of critical inputs, increasing costs.

.avia-image-container.av-13rj1ui-8a814b2a53fc872167708ff8e94172f6 img.avia_image{ box-shadow:none; } .avia-image-container.av-13rj1ui-8a814b2a53fc872167708ff8e94172f6 .av-image-caption-overlay-center{ color:#ffffff; }

The table shows the cost in terms of global GDP of removing the 35 BT of energy-related CO2 that’s emitted. None of the figures are politically acceptable in today’s environment. Even at $50 per MT it would be just under 2% of global GDP.

Note that this analysis only considers the 35BT of energy-related CO2 emitted globally. Total emissions of Global Greenhouse Gases (GHG), including methane, are estimated at 50 BT CO2 equivalent.

This also assumes the world relies fully on capturing CO2 to reach the “Zero by 50” UN goal. Increased use of renewables, coal-to-gas switching, much more nuclear power and development of hydrogen are all being pursued to varying degrees. The EU trading system for carbon permits currently prices CO2 emissions at around €90 (US$94.50) per MT. This can be thought of as the low end of the range of cost to reach Zero by 50 because current trends and policies suggest we’re not on that path. Applied globally, that is equivalent to 3.5% of GDP just to remove our energy-related CO2 emissions.

.avia-image-container.av-wrooyi-43418e0c2bfc0604e21f60ecbebdc913 img.avia_image{ box-shadow:none; } .avia-image-container.av-wrooyi-43418e0c2bfc0604e21f60ecbebdc913 .av-image-caption-overlay-center{ color:#ffffff; }

There is lots of innovation going on. For example, NextDecade estimates that they can provide CCS services at a cost of $57 per MT (before financing). Given the financial payoff for technologies that can reduce or eliminate emissions cheaply, we should expect plenty of positive surprises.

Carbon taxes, tax credits and permits provide a rough guide to the low end of the range of cost involved in transitioning to zero-emission energy. They’re generally set at a level needed to at least partially subsidize renewables, or to impose an appropriate cost on emissions, depending on your view. They need to be high enough to induce behavioral change.

Their cost reflects the ability of clean technologies to replace our current energy systems. The cost of carbon can also be thought of as incorporating the probability that we’ll achieve substantially reduced CO2 levels. A falling cost would indicate improving competitiveness of alternate energies.

That isn’t happening, at least not yet. There is no indication that the world is willing to spend anywhere close to 3.5% of GDP in fighting climate change. US gasoline prices are relatively low compared with most other countries, and yet their rise this year prompted the Administration to blame Covid, Putin and just about everything other than their own policies while symbolically releasing crude from the Strategic Petroleum Reserve.

There is little public support for paying more for energy. Which means that the most likely outcome is continued growth in the consumption of all kinds of energy; modest gains in market share for intermittent solar and wind; and learning to cope with a warmer planet.

We have three funds that seek to profit from this environment:

Energy Mutual Fund

Energy ETF

Real Assets Fund

Please see important Legal Disclosures.


Fossil Future

Alex Epstein’s 100K Twitter followers have anticipated for months the publication of Fossil Future – Why Global Human Flourishing Requires More Oil, Coal, and Natural Gas – Not Less. Few authors have promoted a book more relentlessly. I awaited its publication eagerly. It is the follow up to Epstein’s 2014 book, The Moral Case for Fossil Fuels.

Epstein’s chief insight, articulated in his first book, is that the standard by which fossil fuels should be judged is whether they promote “human flourishing.” He constructs an intellectual framework based on Utilitarianism that seeks the maximum benefit for the greatest number. If his first book built a moral case defending fossil fuels, his new one unapologetically celebrates their enormous positive impact on humans all over the world.

Epstein takes the offensive against environmentalists such as Bill McKibben, the Sierra Club, and other opponents of progress (“anti-humanists”) whose philosophy logically leads to lower living standards, pain, suffering and death for millions of people around the world.

.avia-image-container.av-n06deb-0ada88eb0041af88652b67feeececdec img.avia_image{ box-shadow:none; } .avia-image-container.av-n06deb-0ada88eb0041af88652b67feeececdec .av-image-caption-overlay-center{ color:#ffffff; }

When I read The Moral Case in 2017 (see review here) I found Epstein’s defense highly compelling. The strength of Utilitarianism is that it’s hard to argue against it. Maximizing benefit for the greatest number is the ethos of any civilization – when moderated to avoid imposing undue hardship on minority groups it is the most ethical set of rules to live by. Epstein is a philosopher not a scientist, so presses his case in these terms supported by familiar statistics.

Global CO2 emissions have risen in the last century along with the human population, life expectancy and living standards. It is axiomatic that the combustion of coal, oil and gas has made this possible. Western living standards would otherwise be unrecognizable. In emerging countries cheap energy provides basic needs to ever more people. Hundreds of millions have climbed up Maslow’s Hierarchy of Needs, able to access and move beyond the basic necessities of food, water, shelter and security.

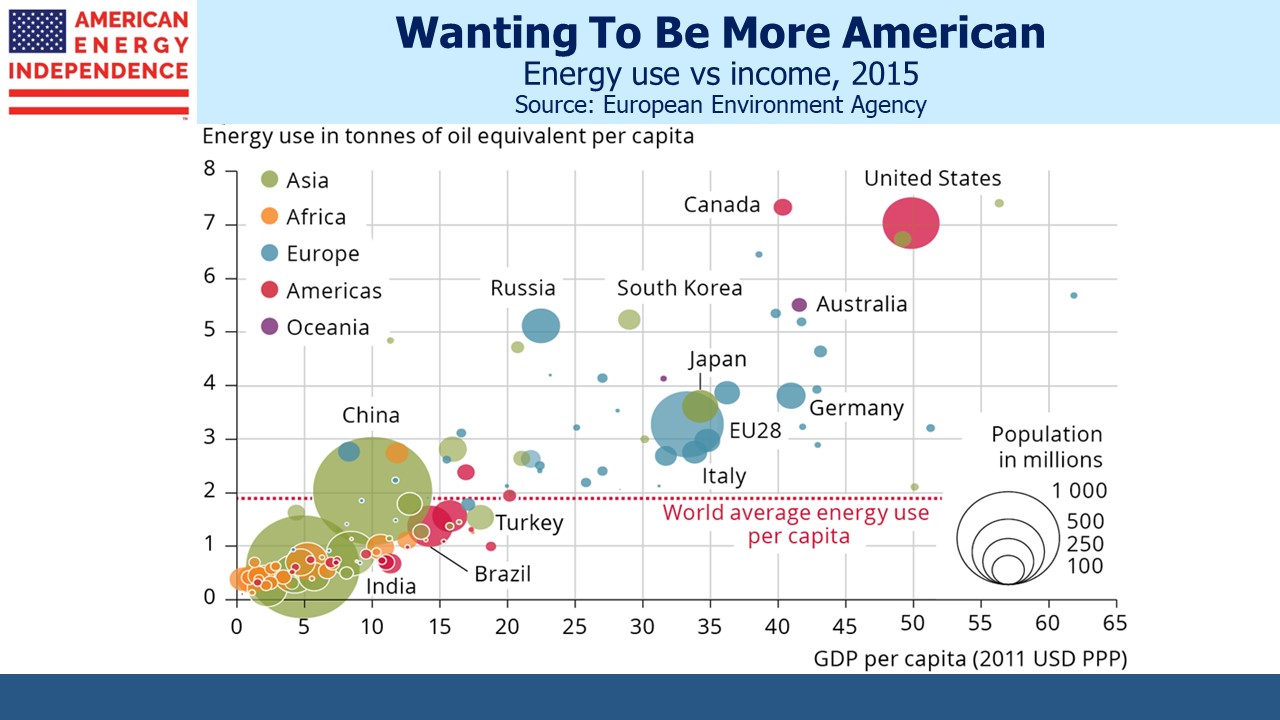
Therefore, the moral case for fossil fuels is fundamentally about allowing non-OECD countries to improve their standard of living, education, health outcomes and longevity. Rich world energy consumption is roughly flat over the past decade. Even if we engineered a draconian reduction in CO2 emissions we wouldn’t offset the increases coming from China, India and others.

Ethically there’s no case for the US, EU and other rich countries to seek lower emissions from emerging economies. Practically speaking, these countries are in any event choosing growth and offering climate pledges barely sufficient to placate. Without foreign aid on a scale never given before, CO2 emissions will rise. Net Zero is an impossible goal.

Cheap (ie fossil fuel) energy aids farming through the use of equipment and irrigation. More efficient farming frees workers to produce other goods and services. Greater specialization further raises incomes, allowing the next generation to spend more time in school.

Construction equipment allows people to move from hand-built mud huts to more permanent, secure structures, leaving them safer. By replacing wood and dung, the choice of fuel for the poorest, coal oil and gas improve indoor air quality for millions of people.

Hospitals benefit from reliable electricity, better able to support a premature baby in an incubator and provide myriad other services that keep people alive.

Cheap energy supports air conditioning, the invention of which drew internal migration to the American south after WWII. Clean water requires energy to produce it. Piping clean water to homes takes energy. The list is almost infinite.

In western countries energy consumption is stable, and we’re no longer experiencing dramatic benefits from increasing its use.

In England in the 1800s, the average family spent 80% of its income on food. On the American frontier, the typical household burned 350 pounds of wood every day to keep warm and cook. OECD countries began their energy-related great improvement in quality of life in around 1850, the start of the industrial revolution and the benchmark against which today’s global temperature is compared.

Vaclav Smil, a multi-discipliniary scientist and prolific author, recently published How the World Really Works: The Science Behind How We Got Here and Where We’re Going. Smil estimates that coal provided half of England’s household heating as early as 1620, way ahead of the rest of the world which he estimates was still 98% reliant on plant fuels (ie firewood) for heat and light in 1800. By 1900 half the world’s primary energy came from fossil fuels (mostly coal, some crude oil).

Emerging countries are following the same path, regularly crossing inflection  points that improve their citizens’ lives.

Epstein is no climate denier. He simply argues that any evaluation of fossil fuels needs to consider the enormous benefits and not just the costs. China, India and other non-OECD countries are understandably pursuing what the west already has. And they’re consuming lots more energy in the process.

Media reports of increased extreme weather omit that weather-related deaths have fallen 99% in the last hundred years. Structures are more secure, and satellite-aided weather forecasts warn of approaching hurricanes. In fact, global computing and communications consumes the equivalent of 3 billion barrels of oil per year, more than global aviation.

As regular readers of this blog know, we long ago concluded that intermittent solar and wind will never be able to replace traditional energy. Places like Germany and California that rely more heavily on sun and wind power have much higher electricity prices. Fossil fuels still provide 84% of the world’s primary energy, down from 86% in 2000.

The most strident opponents of today’s energy mix deserve the anti-humanist label Epstein gives them. They have no answer to the moral question of why poorer countries shouldn’t strive to improve their lives. McKibben, the Sierra Club and US Climate Czar John Kerry sit at the top of Maslow’s Pyramid, with all their needs solved.

Epstein coins some memorable phrases. We’re taught that impacting nature is immoral, whereas fossil fuels have allowed us to make an environmentally hostile planet habitable, via robust homes, heat and clothing. As a result, humans have perfected “climate mastery.”

Epstein regards climate extremists such a McKibben as promoting “a murderous anti-impact framework.” Their policies would consign millions to misery and death.

The IPCC’s recommendations to prevent a 1.5 degrees C temperature increase from 1850 by 2050 are really aimed at preventing a 0.4 degree increase from now, because we’ve already experienced 1.1 degrees. Epstein believes the risks from climate change are manageable, and we should deal with them as they present themselves. He cites the inaccuracy of past projections as a basis for this.

Here’s where we differ. The science is better today. Climate is complicated to model, but the uncertainty includes possible downside scenarios. Prudent risk management requires that we take steps to reduce CO2 emissions. His explanation for why the overwhelming scientific consensus recommends CO2 reductions rests weakly on the need of scientists to obtain research grants and a bias by funding organizations to promote a consensus view.

The moral case for energy use doesn’t mean ignoring the low probability catastrophic outcomes. Being ethically right doesn’t guarantee human flourishing.

But we agree that prevailing wisdom places unreasonable confidence on forecasts of climate catastrophe, without allowance for high degrees of uncertanty and humankinds’ history of climate adaptation.

Phasing out coal in favor of natural gas and increasing our use of nuclear power are both powerful options staunchly opposed by climate extremists. Solar and wind can be part of the solution, but their embrace by purists as the complete answer is sidelining pragmatic choices like natural gas.

The continued growth of emissions by most non-OECD countries shows that, while most are taking steps towards IPCC goals, Zero by Fifty is highly unlikely. China, India and others long ago embraced Epstein’s philosophy. For them it’s the rational approach.

Epstein asserts that, “Fossil fuels have taken an unnaturally dirty world and made it clean.” Elsewhere, he adds, “Fossil fuels make our world unnaturally, amazingly, increasingly livable.”

Today’s energy has made today possible. We shouldn’t be apologizing for that. And natural gas can be the world’s biggest source of reduced emissions, by displacing coal, as it has in America.

Fossil Future provides a moral underpinning for today’s investors in reliable energy.

We have three funds that seek to profit from this environment:

Energy Mutual Fund

Energy ETF

Real Assets Fund

Please see important Legal Disclosures.


Inflation Fears Moderate

Maybe last week’s FOMC minutes had something for everyone. Some analysts seized on the consideration the Fed gave to tighter monetary policy: “They also noted that a restrictive stance of policy may well become appropriate depending on the evolving economic outlook and the risks to the outlook.” 

On the other hand, the minutes noted that, “… the risks to the baseline projection for real activity were skewed to the downside.” They also noted upside risk to inflation. 

It is a dovish Fed, regardless of their current hawkish tone. Getting monetary policy to neutral (estimated as between 2% and 3% based on Chair Powell’s recent press conference) with inflation running at 8% is hardly slamming the brakes on. That they may move to restrictive policy reveals their bias – maximizing employment is more important than stable prices.  

.avia-image-container.av-l1v2u5-a14cbe38e52ef0ce22196afd03e4bc2f img.avia_image{ box-shadow:none; } .avia-image-container.av-l1v2u5-a14cbe38e52ef0ce22196afd03e4bc2f .av-image-caption-overlay-center{ color:#ffffff; }

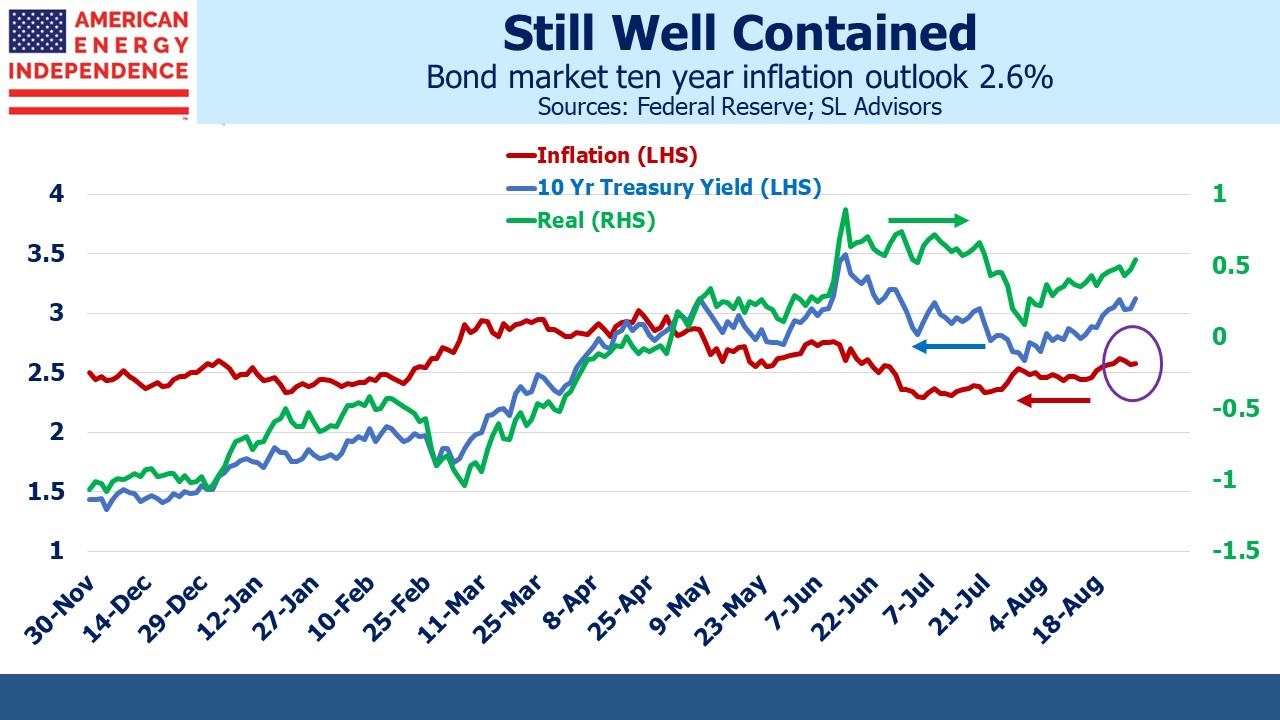
Moreover, the inflation outlook is good even if the current figures are not. Ten year inflation expectations derived from the TIPs market are 2.6%. Since we know CPI over the next year will run well above this, the FOMC could conclude that long term inflation expectations remain well anchored near 2%.  

PCE inflation, the Fed’s preferred measure because unlike CPI it dynamically adjusts for actual consumption weights, is forecast by Fed staffers to be 2.5% next year and 2.1% in 2024. Although survey expectations on inflation are mixed the minutes reported that, “longer-term inflation expectations derived from surveys of households, professional forecasters, and market participants still appeared to be broadly consistent with the Committee’s longer-run inflation objective.” 

JPMorgan expects CPI to drop to 3.4% by 2H23.  

It wouldn’t be hard for the FOMC to conclude that once short term rates are at neutral, ameliorating supply constraints will restore inflation to its prior 2% level. 

There are signs of economic softness, if not yet weakness. Pending home sales on Thursday fell 3.6%. New home sales last week dropped 17%. A permanent shift to remote work has allowed Americans to spread out in this big country. But higher mortgage rates are beginning to take a toll.  

.avia-image-container.av-1cvxr3x-2a4c39d5c1711ba1dba9f24ee55db0a9 img.avia_image{ box-shadow:none; } .avia-image-container.av-1cvxr3x-2a4c39d5c1711ba1dba9f24ee55db0a9 .av-image-caption-overlay-center{ color:#ffffff; }

The eurodollar futures curve reflects lowered odds of a Fed-induced recession. In spite of some FOMC members’ hawkish statements, mid-2023 rates have dropped almost 0.50% from their highs in early April. A less inverted yield curve implies reduced odds of the Fed raising rates too fast and having to shift directions.  

In fact, the improving inflation outlook offers the Fed greater flexibility to respond to any economic weakness by pausing future rate hikes. Two more 0.50% increases are assured, but beyond that it’s data dependent. The FOMC would be happy to avoid moving above neutral. Therefore, the risk is that inflation doesn’t return co-operatively to its long-run 2% target.  

The FOMC core bias in favor of employment means the eurodollar yield curve is still likely to revert to a normal, positive slope. 

Pipeline companies are well positioned to benefit from higher inflation, since a substantial proportion of pipeline contracts are regulated and have built-in PPI tariff escalators. To cite one example, Magellan Midstream Partners (MMP) is about to benefit from a 6% tariff increase on July 1. They’re likely to see an even bigger jump in a year’s time, based on the likely path of PPI (running well ahead of CPI). JPMorgan recently upgraded the stock.  

In other news, Wednesday’s blog post (see ESG Has No Clothes) resonated with many readers who see ineffective hypocrisy in much of today’s virtue-signaling behavior. Adam Vaughan on Twitter noted the incongruity of G7 environment ministers opposing fossil fuel subsidies while the UK doubled tax relief for new oil and gas production. Furthering confusion, the UK government announced a “windfall tax” on energy company profits.  

Why would any energy company make long term investments when public policy is so capricious? 

JPMorgan reported that attendees at a recent conference felt energy security was displacing ESG concerns. ESG and climate change have always seemed to be concerns for those at the top of Maslov’s pyramid (see Russia Boosts US Energy Sector). If you’ve solved all your other problems, you can get to that one. This is why emerging economies are plowing ahead with increased energy consumption from all sources, including coal. They want to raise living standards. And it’s why John Kerry, Climate Czar, is so well suited to his role. He has solved all his other problems.  

.avia-image-container.av-k91p5p-7fed16ea87a3a436093a85e08b6aa627 img.avia_image{ box-shadow:none; } .avia-image-container.av-k91p5p-7fed16ea87a3a436093a85e08b6aa627 .av-image-caption-overlay-center{ color:#ffffff; }

Finally, for those who worry that the principals of SL Advisors afford themselves too little time for some R&R, the photo of a recent golf outing at Echo Lake Country Club should assuage such concerns. Your blogger was happy to host a convivial afternoon of golf with Bill Reilly, Director, Mutual Funds Program Manager at UBS and Rob McNeal, Head of Intermediary Distribution at Catalyst Capital Advisors. Friends of the firm are always welcome guests.  

We have three funds that seek to profit from this environment:

Energy Mutual Fund

Energy ETF

Real Assets Fund

Please see important Legal Disclosures.


ESG Has No Clothes

Offering investments tailored to ESG (Environmental, Social and Governance) criteria is a growing source of fee income for Wall Street. Morningstar calculates that 65 US funds have been repackaged into ESG funds since the beginning of 2019. Investors are attracted by the notion of holding virtuous stocks, but companies and fund managers must also find the flexibility around what constitutes an ESG-eligible stock to be appealing too.

A year ago we looked at the then-largest ESG ETF, the iShares ESG Aware MSCI USA ETF (ESGU), which had $15BN in AUM (see Pipelines Are ESG). ESGU looks so much like the S&P500 that their returns are 0.99 correlated.

.avia-image-container.av-1a121rl-0895813dc3402475a947e549eda57f4c img.avia_image{ box-shadow:none; } .avia-image-container.av-1a121rl-0895813dc3402475a947e549eda57f4c .av-image-caption-overlay-center{ color:#ffffff; }

In the past year, ESGU has lagged the S&P500 by 2.5%. This underperformance has come just as the concept is coming under fire. Tesla (which is in ESGU) was dropped from S&P’s ESG index, prompting CEO Elon Musk to tweet that “ESG is a scam. It has been weaponized by phony social justice warriors.”

Musk is right that it’s a scam, although he hadn’t been a vocal critic until recently. Tesla was dropped even though its “ESG score” was stable, because its sector peers improved theirs. S&P explained that it’s not enough to be “taking fuel-powered cars off the road.”

Tesla drivers are passionate owners, but many overlook that 61% of US electricity generation is from fossil fuels, including coal (22%). It varies by state, but buyers of electric vehicles in Kentucky, West Virginia and Wyoming where coal dominates electricity production (69%, 88% and 80% respectively) are generating more harmful emissions than if they bought a conventional car.

Tesla was the biggest company to be dropped, but others included Berkshire Hathaway and Johnson and Johnson. Wells Fargo was dropped for being non-compliant with the United Nations Global Compact, which says it’s “the world’s largest corporate sustainability initiative”.

HSBC’s head of responsible investing, Stuart Kirk, may have given his swansong by accusing policymakers of overstating the financial risks of climate change. In a delightfully incongruous presentation at the FT’s Moral Money Europe Conference, he said, “there was always some nut job telling me about the end of the world.” His message was a rejection of the orthodoxy which often lapses into hyperbolic predictions that life as we know it is in its final decade.

.avia-image-container.av-vlrrxt-f909ebafa2157cdf779f302a41d7e6fb img.avia_image{ box-shadow:none; } .avia-image-container.av-vlrrxt-f909ebafa2157cdf779f302a41d7e6fb .av-image-caption-overlay-center{ color:#ffffff; }

Kirk notes that the projections of economic loss are inconsequential. The UN’s IPCC report estimates as much as a 5% loss of global GDP by 2100 due to climate change. This is a trivial impact given that even 2.5% annual growth by then will leave the economy 6.86X bigger than it is today. If it’s only 6.52X bigger instead, few will care. It’s the difference between annual growth of 2.5% and 2.433%. Global stock markets aren’t visibly affected by the jump in news articles mentioning “climate catastrophe”.

Kirk is obviously ready for a career change. He complained about the inordinate time he spends with regulators discussing HSBC’s climate exposure, when he sees much more immediate threats such as cybercrime, inflation and pandemics. He has been suspended pending an internal review. Stuart Kirk will likely become a hero to those who believe that adaptation to a warmer planet deserves more attention than it receives.

ESG is being exposed as the emperor with no clothes. The SEC is about to crack down on misleading ESG investment claims by fund managers. SEC chair Gary Gensler said “It is easy to tell if milk is fat free. It might be time to make it easier to tell whether a fund is really what they say they are.”

Gensler might care to examine the Dow Jones Sustainability North America Index, whose owners display a sense of humor by continuing to include defense contractors Lockheed Martin and Northrop Grumman as constituents.

The main problem with ESG is its infinite malleability. ESGU, which now has $23BN in AUM, includes almost the entire S&P500. If everything is ESG, then nothing is. There is no clear differentiating feature. It’s been taken over by index providers and fund managers who have identified the profit potential in creating virtue-signaling investment products. ESG’s most important quality has been in attracting fund flows, which used to cause modest outperformance until the last year or so.

Unlike Dow Jones, ESGU doesn’t regard defense contractors as promoting sustainability, one reason why it’s been lagging the S&P500. However, it does include midstream energy infrastructure companies such as Kinder Morgan and Oneok. Cheniere is an addition since our last review of ESGU a year ago, but they have inexplicably dropped Williams Companies.

The Energy Information Administration tells us that biggest driver of America’s falling CO2 emissions has been switching power generation from coal to natural gas. Pipeline companies and Cheniere are doing more to keep the planet sustainable than any other company we can think of.

Elon Musk and Stuart Kirk are only the latest to challenge groupthink that has determined orthodoxy on climate change and the definition of doing good. There should be more to come.

We have three funds that seek to profit from this environment:

Energy Mutual Fund

Energy ETF

Real Assets Fund

Please see important Legal Disclosures.
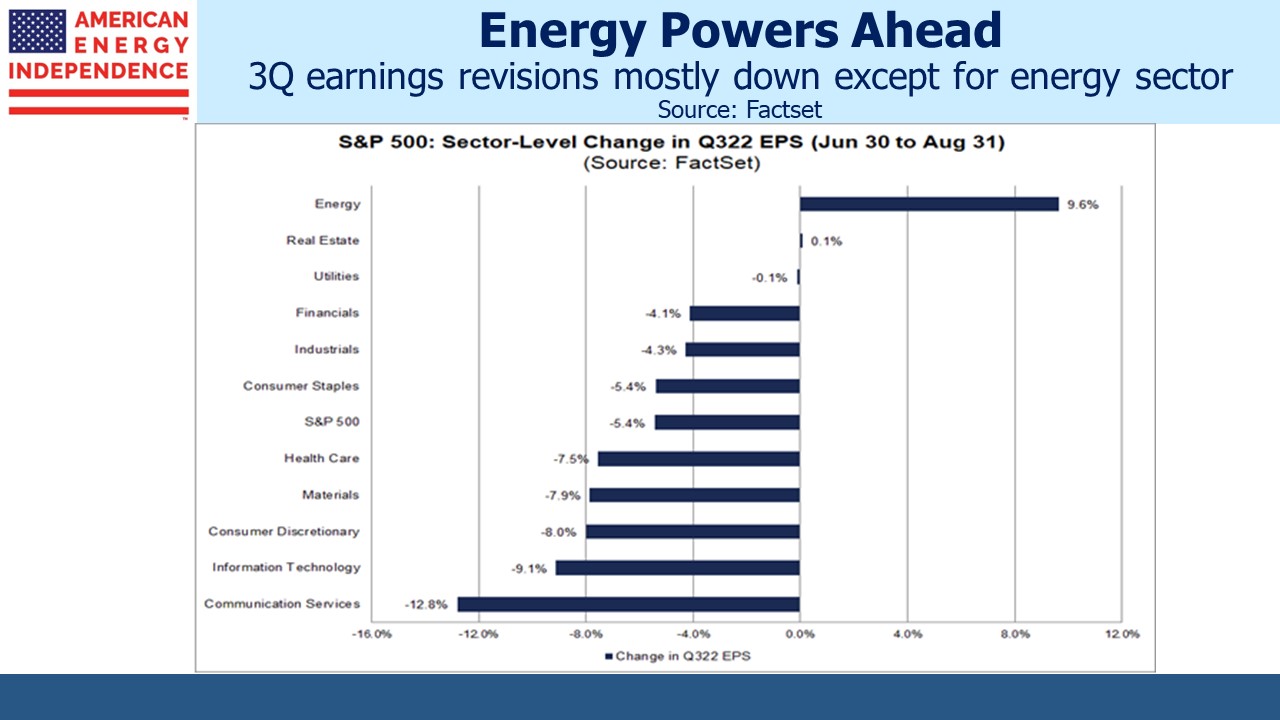


Pipeline Sector Extends Outperformance

The continued rally in the energy sector is steadily lifting past performance ahead of the S&P500 over multiple timeframes. The American Energy Independence Index (AEITR) now has a higher annual return than the S&P500 over the past one, two and three years. Even over five years the performance gap is closing. The 12.3% pa return on the S&P500 is 3.1% ahead of the AEITR. On the Covid low (3/18/20), the AEITR five year trailing return was –19.2% pa, 23.9% worse than the S&P500. It was a dark moment indeed for pipeline investors, and especially so for those focused on MLPs where the carnage was even worse. 

The subsequent recovery has produced some striking relative performance. The one and two year trailing performance figures cause some potential investors to question whether such a move will assuredly be followed by a collapse.  

.avia-image-container.av-4ke70k-4bc80664e338e19ec18d88acee5c0e1c img.avia_image{ box-shadow:none; } .avia-image-container.av-4ke70k-4bc80664e338e19ec18d88acee5c0e1c .av-image-caption-overlay-center{ color:#ffffff; }

The fundamentals remain very good. 1Q22 earnings generally beat expectations, in some cases (ie Cheniere) by a huge margin. Financial discipline continues to constrain growth capex, aided by pipeline protesters whose efforts further dissuade spending on new projects. Hug a protester and offer to drive them somewhere. 

The Covid recession and recovery dominate recent performance history. But it’s worth remembering that the pipeline industry had already shifted away from spending for growth in favor of increasing free cash flow before that. By late 2019, pre-Covid, we felt the sector was poised to outperform because the growth years and MLP distribution cuts of the Shale Revolution had alienated so many investors.  

Two months ago, the pre-Covid return (ie from 12/31/2019) on the AEITR moved ahead of the S&P500. As of Thursday, the AEITR is 8.3% ahead of the market. Surging inflation and Europe’s sudden desire for energy security are two important tailwinds for energy stocks. But the sharp drop and quick recovery that Covid inflicted on the pipeline sector is looking increasingly aberrant. It will always be part of the sector’s history. Becoming comfortable that it won’t repeat is a hurdle facing many potential new investors.  

Closed End Funds (CEFs) have a longer history of providing MLP exposure to retail clients than even the deeply flawed Alerian MLP ETF (AMLP, see MLP Funds Made for Uncle Sam). For example, the Cushing MLP & Infrastructure Total Return Fund (SRV) sports an inglorious fifteen year history of relentless capital destruction. It now trades at less than one tenth of its IPO price. In 2015 we were moved to note its sorry eight year performance of delivering less than a quarter of the return of its benchmark (see An Apocalyptic Fund Story). Although consistent performance has rendered its diminutive size ($70 million AUM) no longer a significant source of revenue to manager Swank Energy Income Advisers, it still serves to warn CEF investors of the damage leverage and poor management can inflict.  

CEFs were generally not a big factor in the Covid bear market, but they did play an outsized role in the MLP collapse, which hurt the entire midstream sector. Operating a single sector fund with leverage reflects an opinion that the companies in that sector should be operating with more debt than they currently do. In effect, it’s a rejection of the collective wisdom of all the CFOs and rating agencies that have arrived at the prevailing capital structure in use.  

.avia-image-container.av-vwlv50-9f0baf2d54aa71d6d6bd69a9f69469f6 img.avia_image{ box-shadow:none; } .avia-image-container.av-vwlv50-9f0baf2d54aa71d6d6bd69a9f69469f6 .av-image-caption-overlay-center{ color:#ffffff; }

Since the stocks within a sector will tend to be highly correlated with one another, there’s little diversification benefit which might otherwise justify the increased risk profile. Single sector closed end funds use leverage to increase the dividend they can pay. But maintaining that leverage requires them to add to their holdings in a rising market – and to reduce them in a falling one. 

When MLP prices collapsed in March of 2020, MLP CEFs had no choice but to delever, which required selling. They exacerbated the fall in prices for the pipeline sector.  

The reason investors shouldn’t expect a repeat is because the consequent value destruction left all the MLP CEFs smaller. They’re no longer managing as much money, because of locked in losses, so wouldn’t have as much to sell even if we endured a repeat of March 2020. The managers of sector-specific CEFs with leverage combine poor judgment with hubris. They include Goldman Sachs, Tortoise, First Trust and Swank.  

Many MLP CEF holders who hung on in the belief that what falls so far must surely rebound will have been disappointed. The 17 MLP CEFs listed on Nuveen’s website are on average still down 37% from their level at the end of 2019, pre-Covid. The AEITR has fully recovered its losses with an 18.5% pa positive return. 

The two lessons are: (1) don’t invest in single sector CEFs because the leverage will eventually create permanent losses, and (2) because MLP CEFs provided evidence of #1 in 2020, they can’t repeat. So prospective investors in midstream energy infrastructure can regard the worst of the March 2020 brief collapse in pipeline stocks as unlikely to repeat.  

We have three funds that seek to profit from this environment:

Energy Mutual Fund

Energy ETF

Real Assets Fund

Please see important Legal Disclosures.
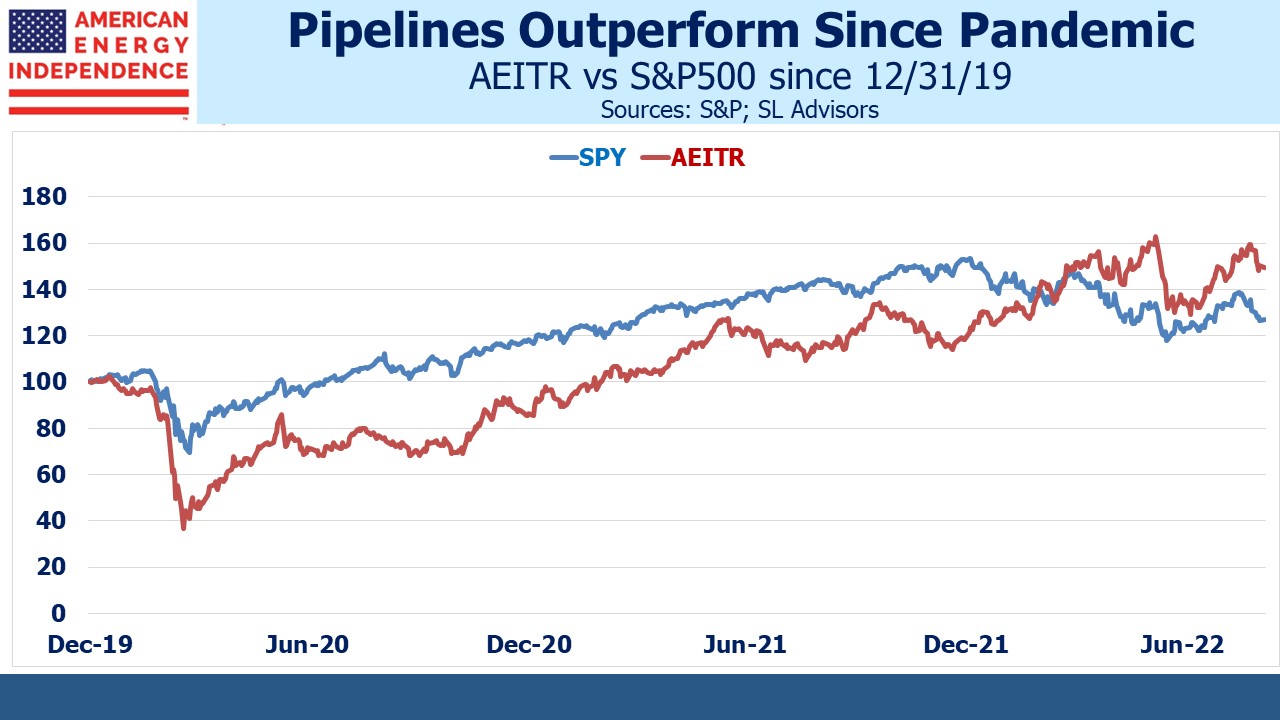


Different Audience, Different Energy Policy

Last week’s Economist magazine included an illuminating op-ed by Nigeria’s vice-president on “the hypocrisy of rich countries’ climate policies.” Like most emerging countries, Nigeria is simultaneously pursuing two goals; improving the access of Nigerians to energy, while reducing the country’s Greenhouse Gas (GHG) emissions.

Vice-president Yemi Osinbajo’s essay neatly captures the dilemma his and other governments face. He wants to “close the global energy inequality gap.” He noted that the 48 sub-Saharan countries of Africa (excluding South Africa) are home to a billion people and use less electricity than Spain’s population of 47 million. Osinbajo wants Nigeria to achieve annual power output of at least 1,000 kilowatt hours per person. Today per capita electricity consumption in Nigeria is less than a fifth of this goal. With the country’s population of 206 million expected to double by 2050, the vice-president estimates electricity output will need to increase by 15X.

Dramatically increasing domestic power generation is a popular message designed to resonate with Nigerian voters. That part of Osinbajo’s essay is targeted at his domestic audience. Then he turns to his audience of foreign OECD governments, noting that Nigerian president Buhari has “pledged that Nigeria will reach net-zero emissions by 2060.”

.avia-image-container.av-3reduc-1b679f1c576c4144bc16a6fd706f34ae img.avia_image{ box-shadow:none; } .avia-image-container.av-3reduc-1b679f1c576c4144bc16a6fd706f34ae .av-image-caption-overlay-center{ color:#ffffff; }

ClimateActionTracker.org estimates that Nigeria’s GHG emissions will increase by 21% over the next decade. The “Almost Sufficient” grade is generous since they’re set to increase faster than ever.

Climate change is not big concern among Nigerians. Last year the Yale Program on Climate Change Communication found that Nigeria polled dead last out of 31 countries on knowledge of the topic, with only 26% responding that they knew “a lot” or “a moderate amount” about it. The US equivalent was 71%. Only 58% of Nigerians were “very or somewhat” worried, close to the US at 68% and far behind Mexico (95%). That Nigerians and Americans are similarly worried about climate change is ironic because the US, with a per capita GDP 10X Nigeria’s, is far better able to pay for mitigation.

The result is that Nigeria, like many other poor countries, offers very different messaging depending on its audience. Domestically they prioritize raising living standards, which includes access to electricity. Internationally they offer solemn pledges to reduce GHG emissions.

The COP26 meeting in Glasgow last year pledged $8.5BN to South Africa to accelerate their energy transition, although it’s still unclear how or when this will be funded. Nigeria believes it needs a green package of $10BN per year over two decades, which will cover half the capital required to meet its net-zero pledge. Plainly, Nigeria won’t reduce emissions without substantial financial support from the US and other rich world countries.

.avia-image-container.av-k4xt1w-bd605c430c23167c163225bf53452a53 img.avia_image{ box-shadow:none; } .avia-image-container.av-k4xt1w-bd605c430c23167c163225bf53452a53 .av-image-caption-overlay-center{ color:#ffffff; }

Nigeria’s power sector generates about 12 million tonnes of CO2 equivalent, less than one per cent of the US at just over 1.5 billion tonnes.  If Nigeria’s goal of adding 15X more output was done with the same energy sources, it would add what 25 million Americans generate. It sounds modest. But applied across the rest of the non-OECD world and not limited to just the power sector, growth in emerging economies could easily offset whatever reductions the rich world can achieve.

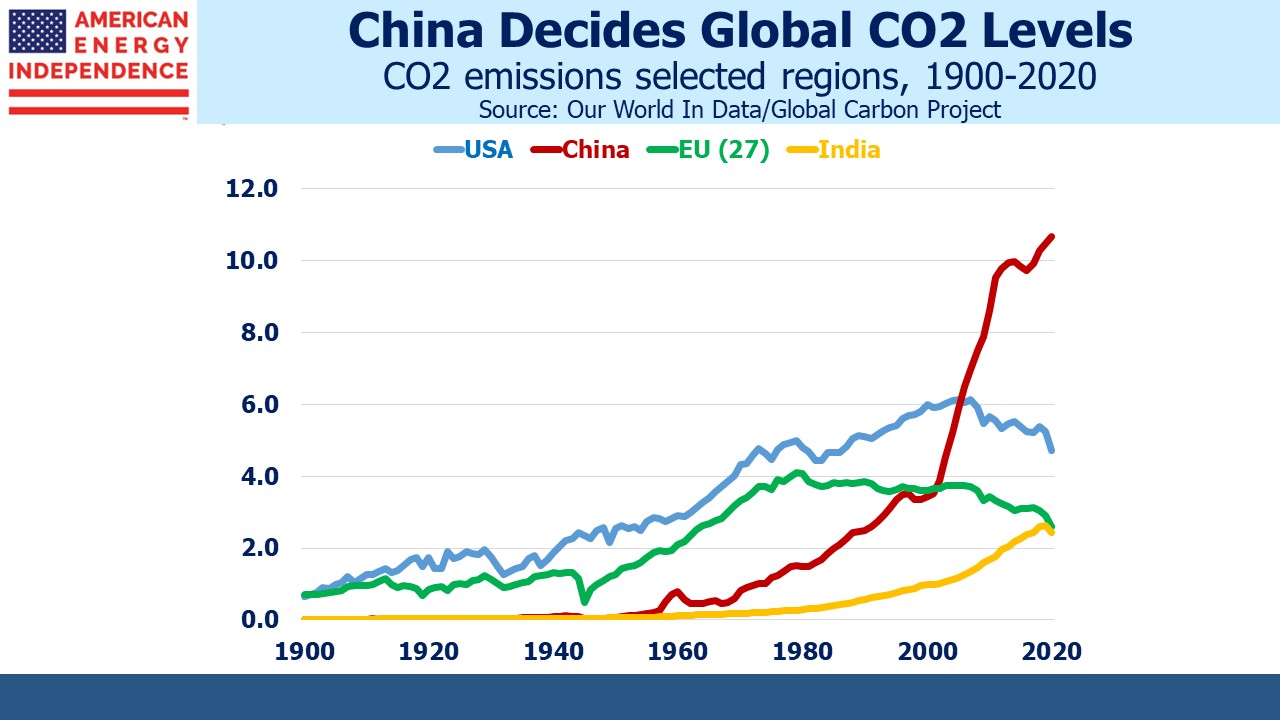
There’s a moral argument that the OECD countries who have used up most of the atmosphere’s assumed capacity for CO2 should cut their emissions aggressively while paying non-OECD countries to curb theirs. It’s a complicated issue. We’ll never subsidize China’s investments in clean energy. Moreover, western countries didn’t impose half a century of growth-impeding socialism on China or India, which they only began to shed in the 1990s. Both are making up for lost time, which is why their living standards are catching up. China is now the world’s biggest emitter, spewing out 2X the US which is number two. India is third. The world’s climate will be determined by China, India and other emerging countries.

The challenges are simple to articulate, if complex to solve. Poor countries are both more vulnerable to the negative effects of a warmer planet, and less motivated to tackle the issue without substantial OECD financial and technological help. Without a massive commitment, the world will learn to adapt to increased levels of CO2 in the atmosphere.

US climate extremists have successfully forced New England to import liquefied natural gas by, for example, blocking new pipelines from Pennsylvania. Their conviction that such efforts somehow address the non-OECD challenge outlined above betrays a misunderstanding that would be comical if it didn’t have as its objective condemning Americans to cold and darkness. It’s exacerbated by President Biden’s promise to, “…deploy clean energy for the benefit of all Americans—with lower costs for families, good-paying jobs for workers.”

US political leaders steer so far from confronting the issues, including higher costs and substantial foreign aid, that they’re encouraging wholly unrealistic and inadequate policy responses. This is why global demand for natural gas will continue to grow. Like western politicians, Nigeria’s v-p is tailoring his message to his audience.

We have three funds that seek to profit from this environment:

Energy Mutual Fund

Energy ETF

Real Assets Fund

Please see important Legal Disclosures.
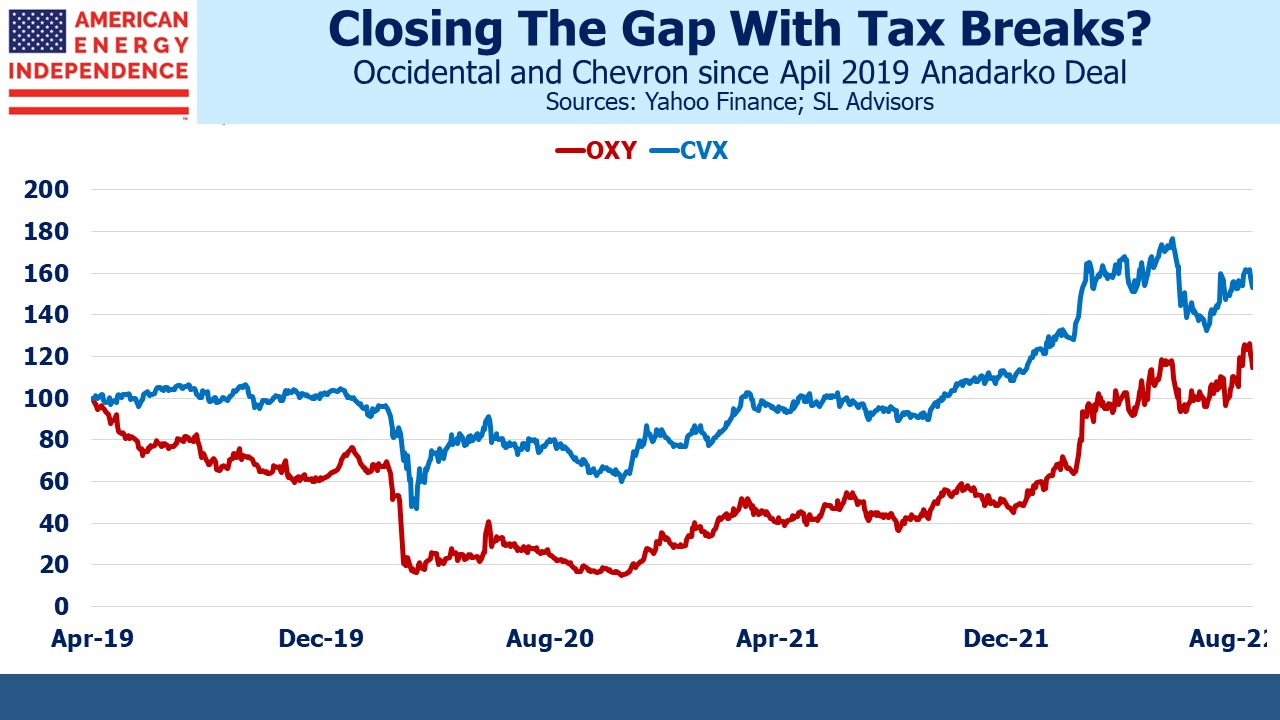


A Good Week For The Fed

Financial advisors probably feel that they’re more than earning their pay recently. Market volatility is high, which means clients want to know what’s going on. Advisors have in the past confided to me that one of their most important roles is to persuade clients from selling impetuously. Their original asset allocation was made after much careful consideration and ought not to be tinkered with just because the market’s moved a bit. Friday’s rally helped, but the S&P500 is still -15% for the year. If you have energy exposure, you’ll have done better.

Global stocks registered their sixth straight weekly decline, the longest streak since 2008. This is a testing environment for financial advisors.

By contrast, Fed chair Jay Powell can look back at the ten days following the last FOMC meeting, 0.50% rate hike and press conference with some satisfaction. Investors won’t hear it said this way but engineering an orderly fall in stock prices is one of the Fed’s goals. Former NY Fed president Bill Dudley, no longer burdened by the requirement to speak responsibly as a senior Fed official, has warned that the Fed’s going to tighten financial conditions enough to push up the unemployment rate (see Criticism Of The Fed Goes Mainstream).

.avia-image-container.av-2i18854-e9bfee03df3ece19ecee9edb9c91d4b6 img.avia_image{ box-shadow:none; } .avia-image-container.av-2i18854-e9bfee03df3ece19ecee9edb9c91d4b6 .av-image-caption-overlay-center{ color:#ffffff; }

The Fed’s reinterpreted mandate places greater importance on achieving maximum employment. Powell hasn’t offered any warnings that unemployment needs to rise. In a fascinating excerpt from his press conference, he noted that job openings were equal to almost twice the number of unemployed, and said they were trying to reduce this imbalance. A perfect outcome for the Fed would see a drop in job openings without a commensurate increase in unemployment, making possible the vaunted “soft landing”.

.avia-image-container.av-2aaw2u0-7abbd9ea8a169b49d1a2fe083aec9574 img.avia_image{ box-shadow:none; } .avia-image-container.av-2aaw2u0-7abbd9ea8a169b49d1a2fe083aec9574 .av-image-caption-overlay-center{ color:#ffffff; }

When you also consider the FOMC’s Summary of Economic Projections expecting unemployment to remain at 3.6% through 2024, this is further evidence that they are prioritizing continued full employment. They’ve been criticized for this by Larry Summers among others, because it seems inconsistent with simultaneously reducing inflation to 2.3% over the same time period.

The bond market became a little more convinced that the Fed will pull this off. Although the CPI and PPI reports showed prices continue rising at a fast clip, ten year inflation expectations derived from TIPs dipped to 2.74%, having recently touched 3%. Since CPI, which is the index TIPs follow, typically runs 0.3-0.4% higher than the Fed’s preferred Personal Consumption Expenditures index, they can plausibly conclude that investors are buying the narrative that inflation will return to 2% within a couple of years.

It doesn’t look like a good bet to us. The FOMC is dovish. The disinflationary effects of globalization are petering out. And the US fiscal outlook requires higher inflation so that negative real rates can ease the burden of our growing debt.

Moderating inflation expectations have caused the twos/tens spread to widen and moderated the inversion that exists in part of the eurodollar futures curve. An inverted yield curve is a forecast from the market of a looming failure of monetary policy, implying an overshoot in tightening that would require it to be reversed.

Hoping that reduced job openings will be sufficient to cool the economy, as Powell seemed to suggest during his press conference, seems wildly optimistic with no historical precedent. Raising rates beyond the 2-3% range the FOMC believes is neutral seems certain to require a pause to assess whether prior hikes are already having an effect.

At his press conference Powell explained, “So what that really means is, to get the kind of labor market we really want to get, we really want to have a labor market that serves all Americans, especially the people in the lower income part of the distribution, especially them.” This is a laudable public policy objective, if a dubious addition to the Fed’s objectives. Monetary policy is notoriously slow and blind to the individuals it impacts. Hence the eurodollar futures curve should be priced for cautious rate hikes next year that lower the odds of requiring a reversal.

.avia-image-container.av-1o7rofs-b21c4494a45d682d075e524c0923c0a2 img.avia_image{ box-shadow:none; } .avia-image-container.av-1o7rofs-b21c4494a45d682d075e524c0923c0a2 .av-image-caption-overlay-center{ color:#ffffff; }

I was chatting with an investor on Friday about the increasing incidence of 1% daily moves in the S&P500. Such moves are now more likely than not based on the past 100 trading days (see Pipelines Are Less Volatile Than You Think). He found it an interesting way to think about volatility, one that’s easily intuitive. Such 100 day regimes have existed only 8% of the time over the past quarter century.

Daily moves greater than 0.5% currently occur 70% of the time. 100 day periods like this have existed less than a fifth of the time.

2% daily moves remain uncommon but are creeping up, currently 15% of the last 100 trading days (including the 3.2% drop on Monday 9th).

.avia-image-container.av-1300tmg-2e47400cc4bd5fb7cf7cbbc015286ea5 img.avia_image{ box-shadow:none; } .avia-image-container.av-1300tmg-2e47400cc4bd5fb7cf7cbbc015286ea5 .av-image-caption-overlay-center{ color:#ffffff; }

.avia-image-container.av-pb1wqg-4c5e2321718eace0f549b84d34c91812 img.avia_image{ box-shadow:none; } .avia-image-container.av-pb1wqg-4c5e2321718eace0f549b84d34c91812 .av-image-caption-overlay-center{ color:#ffffff; }

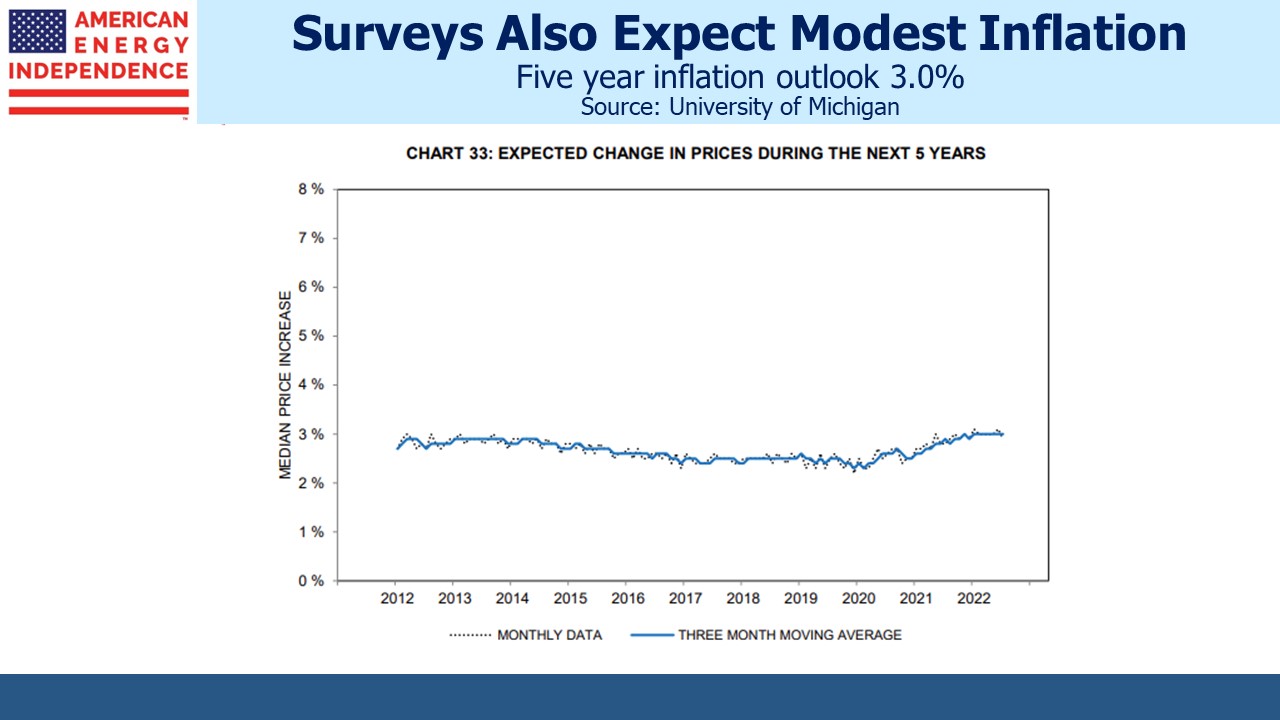
Even if increased volatility doesn’t lead to lower stock prices, it probably tempers exuberant economic activity. The University of Michigan’s consumer sentiment survey registered its lowest reading since 2013, with inflation cited as the biggest area of concern. Long term inflation expectations remained at 3%, slightly above the rate derived from ten year treasury securities.

In sum, lower stock prices, a steepening yield curve and falling long term inflation expectations are a positive grade on the FOMC’s report card. Investors may not feel quite as sanguine after another volatile week, but Jay Powell might permit himself a moment of quiet satisfaction.

We have three funds that seek to profit from this environment:

Energy Mutual Fund

Energy ETF

Real Assets Fund

Please see important Legal Disclosures.
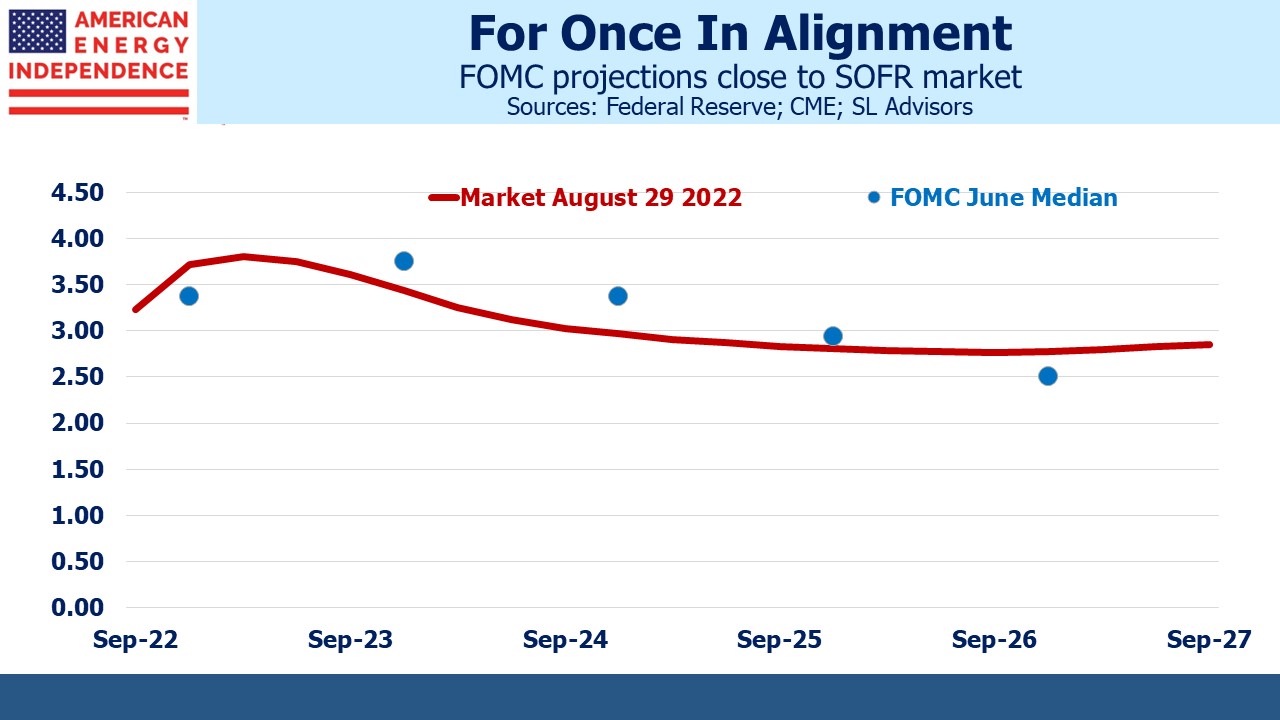


Pipelines Are Less Volatile Than You Think

If it feels like the market’s daily swings are giving you whiplash, you’re right. Following Monday’s rout, the number of daily moves in excess of 1% breached 50% over the past hundred days. In other words, a 1% or greater change in the S&P500 is now more likely than not.

This is unusual. Markets were remarkably calm in the second half of last year. Volatility picked up towards year end as it became clear the Fed was way behind in normalizing policy. Nonetheless, such periods are rare. In the last quarter century such regimes have only existed for 8% of the time. Oddly, this doesn’t augur poor returns. For example, in April 2020 market volatility crossed that “more likely than not” threshold and the subsequent one year return was almost 50%.

.avia-image-container.av-1po1jce-85f51ea195346bf0206bd49bc82d5256 img.avia_image{ box-shadow:none; } .avia-image-container.av-1po1jce-85f51ea195346bf0206bd49bc82d5256 .av-image-caption-overlay-center{ color:#ffffff; }

However, it does mean advisors will spend more time discussing the outlook with clients. Inflation, an unexpected war in Europe and China’s vain attempt to stamp out Covid are significant headwinds. Recession risks in Europe are rising too. Germany is scrambling to overcome its reliance on Russian natural gas. They are under increasing pressure to unilaterally stop imports, which would likely plunge Germany into a recession, and partial darkness.

Chancellor Olaf Scholz recently said, “It doesn’t help anyone if the lights go out here. Not us and not Ukraine,” But who really expects Russian gas to keep flowing reliably up until the moment Germany closes Nordstream One? Ending Russian gas supply is likely to be timed to suit Russia not Germany. Russia’s infrastructure precludes quickly rerouting their gas to Asia. A move that’s intended to harm Russia is unlikely to be implemented on Germany’s timeframe. So it’s probably going to be disruptive.

Value sectors including energy have returned with a vengeance. Bloomberg calculated that Cathie Wood’s ARK Innovation ETF (ARKK) has now underperformed the S&P500 since its launch in October 2014. Early this year ARKK crossed another ignominious threshold when we showed how poor has been the typical ARKK holder’s experience (see ARKK’s Investors Have In Aggregate Lost Money). ARKK’s since inception performance has not yet been exceeded by the American Energy Independence Index (AEITR), but rest assured that we shall note such in a future blog post if it occurs.

.avia-image-container.av-19qr8y6-c7ba6e6517264e58645d8e4f2b364161 img.avia_image{ box-shadow:none; } .avia-image-container.av-19qr8y6-c7ba6e6517264e58645d8e4f2b364161 .av-image-caption-overlay-center{ color:#ffffff; }

The AEITR did reach another milestone though – from the index inception date on 12/29/2010, it has now outperformed the S&P500. For most of the past decade investing in pipelines looked like a reliable way to lag the market. Regular readers know our confidence in midstream energy infrastructure has never been swayed by returns that at times presented powerful evidence of misplaced optimism. Ample history showing we have no skill at market timing means we’re still bullish on the sector – to us the reasons are abundant, just as the supply of reliable energy is constrained. Energy investors were cheered by Saudi oil minister Prince Abdulaziz bin Salman’s comment that, “The world needs to wake up to an existing reality. The world is running out of energy capacity at all levels.” I’m the driver you see smiling at the gas pump.

.avia-image-container.av-pqngry-29cd00970e208dc9384866058931f238 img.avia_image{ box-shadow:none; } .avia-image-container.av-pqngry-29cd00970e208dc9384866058931f238 .av-image-caption-overlay-center{ color:#ffffff; }

The pipeline sector is not only beating the S&P500. It’s also moving less. By the “more likely than not to move 1% or more” definition, the AEITR has the edge over the S&P500. This has rarely been the case over the past decade. The capital profligacy of the Shale Revolution caused volatility up and then down. Energy transition fears and Covid heaped further uncertainty. But they’ve been replaced by financial discipline, energy realism and the end of Covid (other than in China).

First quarter pipeline company earnings were very good, with most big companies beating expectations. Natural gas exports are creating more opportunities. Energy Transfer expects to move ahead with their Lake Charles liquefaction facility by the end of the year (see High-Energy Earnings Boost Pipelines). Even conservatively run Enbridge expects to profit from growing global demand for US natural gas. CEO Al Monaco recently said, “LNG exports are a big opportunity, with momentum building across the U.S. Gulf Coast, and now more so in western Canada.”

North American midstream energy infrastructure is steadily making up for lost ground over many timeframes. It’s doing so with no more volatility than the market, and in recent months has provided a very welcome negative correlation with traditional stock/bond portfolios. It’s worth noting that recession fears have had only a muted effect on energy prices. Crude oil is still around $100 and the Asian JKM benchmark for natural gas is at $27 per million BTUs for next winter, more than triple the US Henry Hub price. We continue to believe the pipeline sector offers attractive return potential to the long term investor.

We have three funds that seek to profit from this environment:

Energy Mutual Fund

Energy ETF

Real Assets Fund

Please see important Legal Disclosures.


High-Energy Earnings Boost Pipelines

Earnings for pipeline companies are generally devoid of excitement unless steady growth gets you animated, such is the stability of most business models. But 1Q22 earnings were full of positive surprises. Cheniere (CEI) blew away expectations with 1Q22 EBITDA 65% ahead of consensus. Most of their Liquefied Natural Gas (LNG) contracts are based on a fixed charge for liquefaction, but in some cases they’re able to market the LNG themselves.

Continued strength in global LNG prices drove the beat. CFO Zach Davis reported that because of cash flows, “We’ll be bringing down the share count. We’ll be reducing interest expense, and ideally, eventually yes, increasing that guidance, but we’ll stick with what we got today.” He was referring to long term guidance, because they increased their 2022 EBITDA and Distributable Cash Flow (DCF) guidance by 17% and 26% respectively.

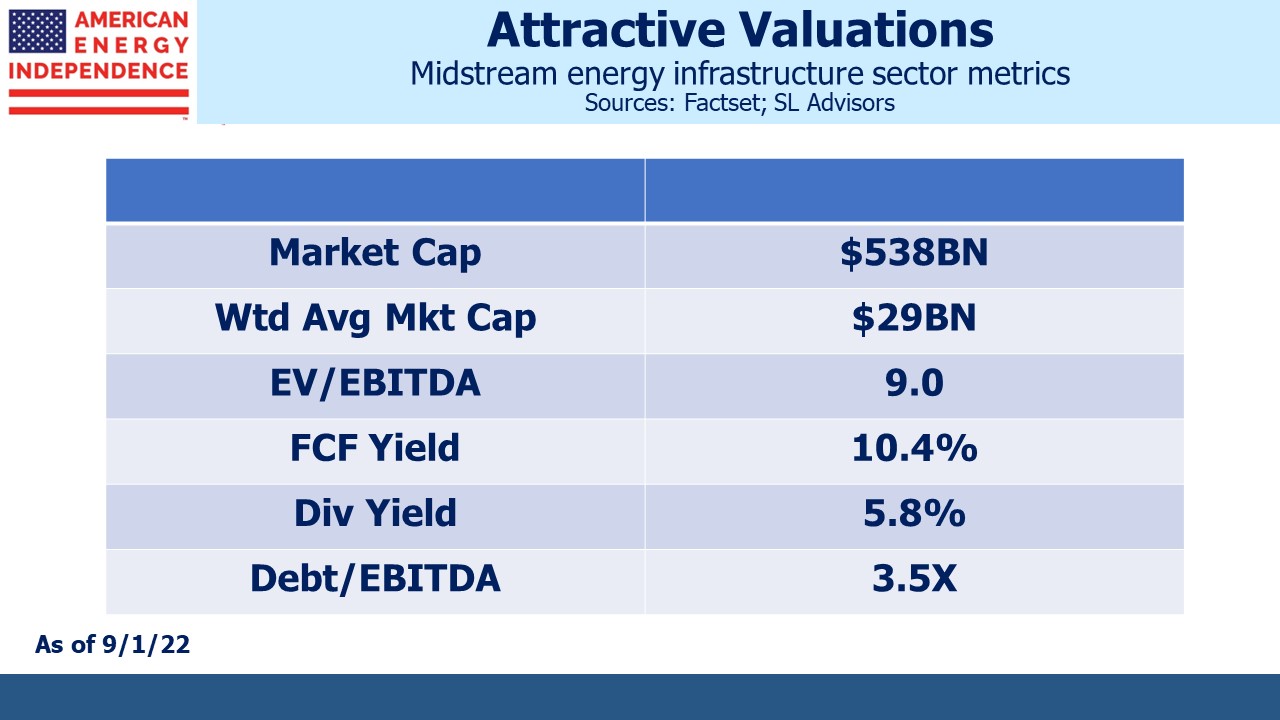
Enbridge (ENB), North America’s biggest pipeline company, beat consensus EBITDA by 2.2% and raised their dividend by 3.3% year-on-year. Dividend hikes are becoming a common theme across the sector. ENB has one of the more conservative management teams in the industry. Their C$3.44 per share payout equates to a generous 5.9% yield, 1.75X covered by DCF. ENB is also growing their energy transition footprint. They announced plans to develop a Carbon Capture and Sequestration (CCS) hub in Alberta, to capture CO2 emissions from local power generation and cement production. Like most of the big pipeline stocks, it still looks cheap to us.

.avia-image-container.av-27blrlm-c640d35af3f3dcd7bd4ee27162e36ca4 img.avia_image{ box-shadow:none; } .avia-image-container.av-27blrlm-c640d35af3f3dcd7bd4ee27162e36ca4 .av-image-caption-overlay-center{ color:#ffffff; }

Energy Transfer (ET), widely held by financial advisors we talk to, beat EBITDA expectations by 13% largely due to strong performance in natural gas pipelines. Co-CEO Marshall McCrea said on their earnings call, “In this quarter, our intrastate volumes were up 17%. Our interstate volumes were up 15%, our midstream volumes were up 14%. Our NGL’s record volumes, as I alluded to earlier, were up 17%.”

ET also expect to make a Final Investment Decision (FID) on their planned Lake Charles LNG export facility soon, having signed several agreement with buyers recently. McCrea saying, “we’re highly optimistic that we’ll have this fully contracted by the end of the year.”

.avia-image-container.av-1lvn4my-e4bf8b88526b048b0c27d2f0395430ee img.avia_image{ box-shadow:none; } .avia-image-container.av-1lvn4my-e4bf8b88526b048b0c27d2f0395430ee .av-image-caption-overlay-center{ color:#ffffff; }

Earnings beats and improved guidance were common, delivered by Kinder Morgan (KMI), TC Energy (TRP), Enterprise Products (EPD) and Williams (WMB) among others. Strength in natural gas pricing and volumes was widespread. Like ET, EPD saw strong demand in its Natural Gas Liquids (NGLs) segment where EBITDA of $1.2BN was 15% ahead of consensus.

.avia-image-container.av-1axolne-d9fdb04a83a204633a33bc11cae55a81 img.avia_image{ box-shadow:none; } .avia-image-container.av-1axolne-d9fdb04a83a204633a33bc11cae55a81 .av-image-caption-overlay-center{ color:#ffffff; }

The US moved to a net exporter of NGLs in 2010 and now ships 2.3 Million Barrels per Day (MMB/D). Propane, widely used in home barbecues and by farmers to dry crops, is over half this. EPD, ET and Targa Resources (TRGP) dominate the processing and movement of NGLs.

TRP raised growth capex by 9% and attributed it all to inflationary pressures on labor and materials, something we’re all accustomed to. Meanwhile Equitrans (ETRN) continued to press ahead with the Mountain Valley Pipeline (MVP), buoyed no doubt by vocal support from Senator Joe Manchin (D-WVa). MVP is all but complete, but has suffered repeated delays because of adverse court rulings on previously issued permits.

ETRN is now pursuing new permits from two Federal agencies and hopes to place MVP into service by 2H23. NextEra, a JV partner in MVP, was so pessimistic on MVP’s prospects that they wrote their investment down to zero in February. Their shrewd accountants have engineered a tax deduction on the full capital investment with the possibility of future returns on an asset carried at zero.

Since KMI kicked off pipeline sector earnings on April 25th, the American Energy Independence index (AEITR) has gained 3.5%, outperforming the S&P500 by 7.5%.

Fears of stranded assets due to the energy transition used to hang over the sector. Opposition to new pipelines from environmental extremists further contributed to negative investor sentiment. We concluded long ago that constraints on spending by pipeline companies was good for investors, albeit sadly not so good for consumers (see Partnering with Pipeline Protesters from June 2019). WMB CEO Alan Armstrong confirmed as much on their earnings call, when he said, “Thanks to the efforts of the environmental opposition and making pipeline permitting so difficult in the areas that we operate, it’s allowed us much higher returns in that space than would normally be allowed.” If you meet a pipeline protester, give them a hug and offer to drive them to their next event.

.avia-image-container.av-opdqai-04cbb4f4abd71bbb968417a8829c8905 img.avia_image{ box-shadow:none; } .avia-image-container.av-opdqai-04cbb4f4abd71bbb968417a8829c8905 .av-image-caption-overlay-center{ color:#ffffff; }

Failures of European energy policy are boosting the outlook for our energy sector. Because climate extremists have held more influence than in the US, over the past two decades Europe let its domestic oil and gas production drop by half. Although consumption has been falling, their increasing reliance on Russian oil and gas made them more supplicant than trade partner. Abandonment of this policy is already boosting the results of pipeline companies and their improved outlook. The EU has held a strong, wrong opinion on energy. By contrast, WMB’s Armstrong said of the US, “I think all of us would question whether we’ve actually had an energy policy or not.” He’s right. No policy is still better than a bad one, but we can do better.

We have three funds that seek to profit from this environment:

Energy Mutual Fund

Energy ETF

Real Assets Fund

Please see important Legal Disclosures.


Why The Fed’s Critics Will Become More Vocal

The ten year treasury yield touching 3% has drawn headlines, but the bigger story is that the increase in nominal yields has been driven by rising real yields. Ten year TIPs yield 0.18%, the first time they’ve been positive in over two years. Until recently, real yields had been declining irregularly for decades. $TNs of return-insensitive capital (central banks, sovereign wealth funds and others with inflexible investment mandates) is part of the reason.

The Fed needs tighter financial conditions in order to slow the economy. Higher real ten year yields help. Tighter monetary policy is most effective when it increases bond yields, because that’s where the economy and equity markets are more sensitive. Therefore, rising bond yields reduce the need for aggressive hikes in the Fed Funds rate.

.avia-image-container.av-1fyk37u-c9498d529c4265f442ac231836b880b4 img.avia_image{ box-shadow:none; } .avia-image-container.av-1fyk37u-c9498d529c4265f442ac231836b880b4 .av-image-caption-overlay-center{ color:#ffffff; }

Criticism of the Fed has been limited. Former Treasury secretary Larry Summers and former NY Fed president Bill Dudley are notable exceptions, and are well qualified to find fault publicly, as they have. Republicans have voiced unhappiness about elevated inflation, while Democrats seem to care more about the Fed’s approach to climate change. We may not like inflation, but since the cure is a weaker economy, we’ll like that a lot less.

Quantitative Easing (QE) was obviously maintained way too long, and the Fed is approaching its opposite, Quantitative Tightening (QT), cautiously. Much has been made of their decision to shrink the balance sheet, but they have over $1TN in treasury securities maturing within the next year. Letting these roll off won’t impact ten year yields. But they may sell Mortgage Backed Securities (MBS), which looks sensible because buying Fed buying of MBS has been supporting the strong housing market.

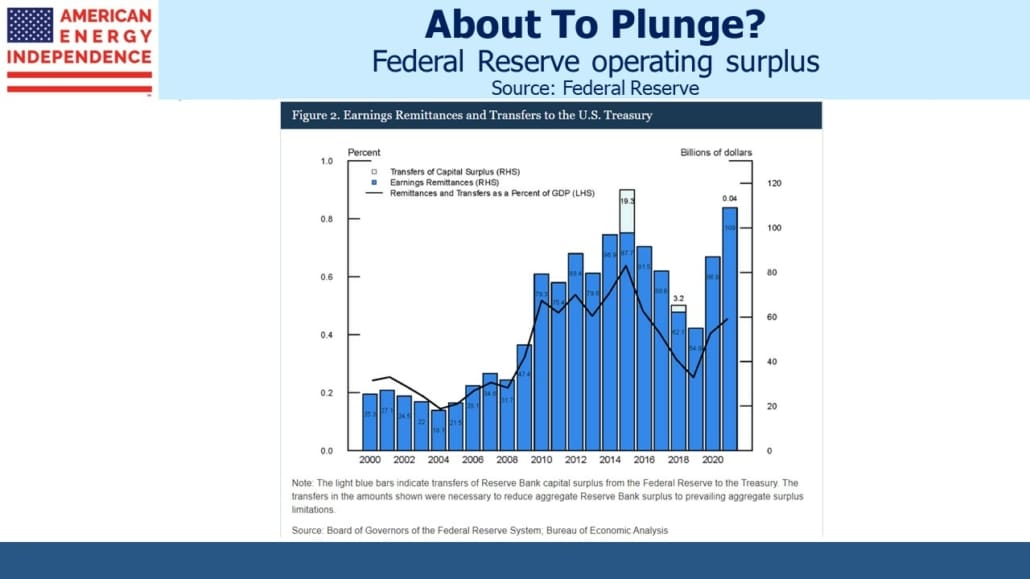
The Fed remits its operating surplus to the US Treasury every year. In recent years this has been swollen by positive net interest income from its $9TN balance sheet.

.avia-image-container.av-1buug16-6772482094cb399432377212ec937a56 img.avia_image{ box-shadow:none; } .avia-image-container.av-1buug16-6772482094cb399432377212ec937a56 .av-image-caption-overlay-center{ color:#ffffff; }

In its last fiscal year (ending September 2021) the Fed reported $122BN in interest income from securities. Its balance sheet averaged $8TN, so we can infer that the average interest rate on its portfolio is around 1.5%. After adjustments, net income of $107BN was remitted to the government.

The Fed’s FY2021 interest expense was $6BN, but this is now going up. Assuming the $1TN in securities that will mature within a year yield 0%, the remainder of the Fed’s balance sheet yields just over 1.7%. Short term rates will be at that level by year’s end if not sooner. The 2022-23 fiscal year will see a steep drop in the Fed’s annual remittance to the Treasury. It could even flip to where the Fed has an operating loss.

.avia-image-container.av-mlj3t6-8875490b66d48341d360500d22024606 img.avia_image{ box-shadow:none; } .avia-image-container.av-mlj3t6-8875490b66d48341d360500d22024606 .av-image-caption-overlay-center{ color:#ffffff; }

Auctioning MBS would generate realized losses for the Fed. They have over $2.6TN in MBS with maturities of greater than ten years. Assuming a duration of ten and a 2% increase in yields from when they were bought, for every $100BN in MBS the Fed sells they’d realize a $20BN loss.

None of this will surprise policymakers, who we can assume took all this into consideration when they began the latest round of QE in 2020. They worried about their exit a decade ago, when wrestling with how to reduce their balance sheet following the 2008 Great Financial Crisis (GFC). Back then St. Louis Fed president James Bullard called it a “recipe for political problems.” They began tightening monetary policy in late 2015, and took almost four years to reach 2.4%. The Fed moved so slowly to unwind the GFC balance sheet that it wasn’t far below its 2016 $4.5TN peak before Covid led to a second round of QE. From 2015 to 2019 their remittances to the Treasury fell by almost half.

The Fed could argue that losses from QE are proof of its benefit. The higher rates that follow reflect QE’s success in arresting the economic decline that necessitated it. This is a sound economic argument, but not one that’s been tested yet. It’s the opposite of what deft currency intervention produces – a central bank that steps in to offset extreme moves in its currency is buying low/selling high – as long as it’s successful. Sometimes it isn’t. The 1992 collapse of Sterling against the Deutsche Mark overwhelmed the Bank of England, netting George Soros’s hedge fund an estimated $1BN profit on “Black Wednesday” (September 16, 1992).

QE is a buy high/sell low strategy. Because of the Fed’s error in maintaining overly accommodative policy for too long, they now must tighten more aggressively. It’ll take time, but the budgetary consequences of their poor decisions will reach the political classes in another year or so, in time for the 2024 presidential election. The Congressional Budget Office estimates that a 1% increase in rates above official projections increases the interest expense on Federal debt by $200BN. Their most recent forecast was for ten year treasury yields to average 1.6% through 2025.

Slower normalization of monetary policy and lethargic balance sheet reduction will allow higher inflation while smoothing the drop in Fed remittances to the Treasury. Such a debate won’t make it into the FOMC minutes, but will be on the minds of chair Jay Powell and his colleagues.

We have three funds that seek to profit from this environment:

Energy Mutual Fund

Energy ETF

Real Assets Fund

Please see important Legal Disclosures.