Why MLPs Did What They Did in September
Why the market did what it did is far and away the most common question we receive. We’re not market timers and so don’t devote much effort to figuring out near term direction. But people want to know, and we’ve developed a narrative that we think explains recent sharp moves.
Regular readers of this blog are used to me attempting different ways to say the same thing, which is that MLPs are cheap. In September they became cheaper still. If you need reminding of the case, you might peruse recent posts such as Why MLPs Make a Great Christmas Present, Listen to What the Oil Price is Saying, or MLPs Now Look Attractive Relative to Equities. The Alerian Index yields 8%. The case remains, even while prices have dropped. On Thursday, Enterprise Products Partners (EPD), a $72BN enterprise value midstream MLP with significant crude oil and Natural Gas Liquids business, declared a $0.385 quarterly dividend. This represented a 5.5% year-on-year increase and their 54th distribution increase since going public in 1998. It yields 5.56%.
Our Separately Managed Account (SMA) clients remain steadfast, and we have seen inflows from existing and new clients in recent months. Mutual fund clients vary a little more. Many are long term investors focused on understanding the fundamentals and therefore unwilling to let market fluctuations shake them unless supported by altered business conditions. But some do rely on recent price movements to support their conviction, or put another way lose confidence when prices are falling.
It’s clear in the many quarterly account reviews with clients for which Financial Advisors (FAs) are preparing. The third quarter hasn’t been pretty for investors generally; MLPs simply represent the more extreme type of adversity being faced. Some $60BN in mutual funds, ETFs, ETNs and closed end funds exist to provide MLP exposure to retail investors without those dreaded K-1s. Not all these funds are poorly structured, but many are. Owning MLPs via a C-corp structure offers the desired exposure with the simpler 1099 tax form, albeit with the highly unattractive feature of a 35% corporate tax liability (see The Sky High Expenses of MLP Funds).
Expense ratios of as high as 9% are somehow an acceptable price for the K-1 averse would-be MLP investor. The 35% tax roughly means you get 65% of the return. It’s therefore reasonable to assume that the holders of such securities, or the FAs who select them on their client’s behalf, are not the most discerning investors. It’s unlikely they spend much time examining the underlying holdings and their distribution yields, growth rates and capex plans. These are the investors for whom investment analysis begins and probably ends with a price chart. Year-to-date performance for 2015 that was by September 29th -35%, close to equaling 2008’s -36.9%, was challenging for a great many of these.
Fund flows have clearly been negative, supporting the notion that fund sellers have been an important factor in recent weakness. Barrons noted that closed end funds were forced to sell because they were hitting their leverage limits, an example of the stupidity of investing with borrowed money whether you’ve done so directly or through your choice of fund. Moreover, indiscriminate selling of MLPs across the sector bore out the wholesale exit by a certain class of holder. Some writers inferred the market’s rejection of Energy Transfer Equity’s (ETE) acquisition of Williams Companies (WMB) when it was finally announced on the morning of Monday, September 28th. But there was very little new in the ultimate transaction that wasn’t already widely known the Friday before. So why was Energy Transfer Partners (ETP) down 6.5% on Monday? All that changed was that ETP would now be able to connect its pipeline network in useful places to the WMB network. ETP isn’t otherwise involved in the transaction, controlled as it is by its GP, ETE. We are invested in EPD, ETE and WMB.
We think there are a couple of other explanations. One is that the Deferred Tax Liability (DTL) on many of the poorly structured MLP funds came close to flipping signs, as unrealized gains evaporated with a market that had wiped out three years’ prior returns. The consequence of a taxable MLP fund moving from an unrealized taxable gain to an unrealized taxable loss is that they no longer have a DTL. Its mirror, a Deferred Tax Asset (DTA), which might be expected to act like a net operating loss in that it creates a potential future tax benefit, can’t exist for open-ended funds. Hence the Alerian ETF (AMLP) began offsetting its DTA with an equal but opposite “Valuation Allowance”. It’s likely that most if not all taxable MLP funds could be shown to have reached this state, if they published such figures on a daily basis like AMLP. Taxable MLP funds that cross from a DTL to a DTA expose their holders to 100% of the downside (since there’s no longer a DTL cushion) but only 65% of the upside (since gains remain taxable). Some of these funds started showing daily returns equal to the index on down days, a truly unpleasant asymmetry for many investors, and no doubt an additional inducement to sell for those paying attention.
Many FAs we’ve talked to have been concerned about upcoming quarterly account reviews with clients, since although MLPs had a terrible quarter many other sectors were weak as well. September 29th was the last day when you could sell an underperforming fund so as to keep it off the quarter-end client statement. Discussing a tough quarter can be easier if the offending investments are no longer in the client’s portfolio. The market certainly behaved as if indiscriminate selling climaxed on that day. If MLPs were private and investors had to form opinions by studying their financial statements instead of looking at a stock chart, there wouldn’t be much of a story.
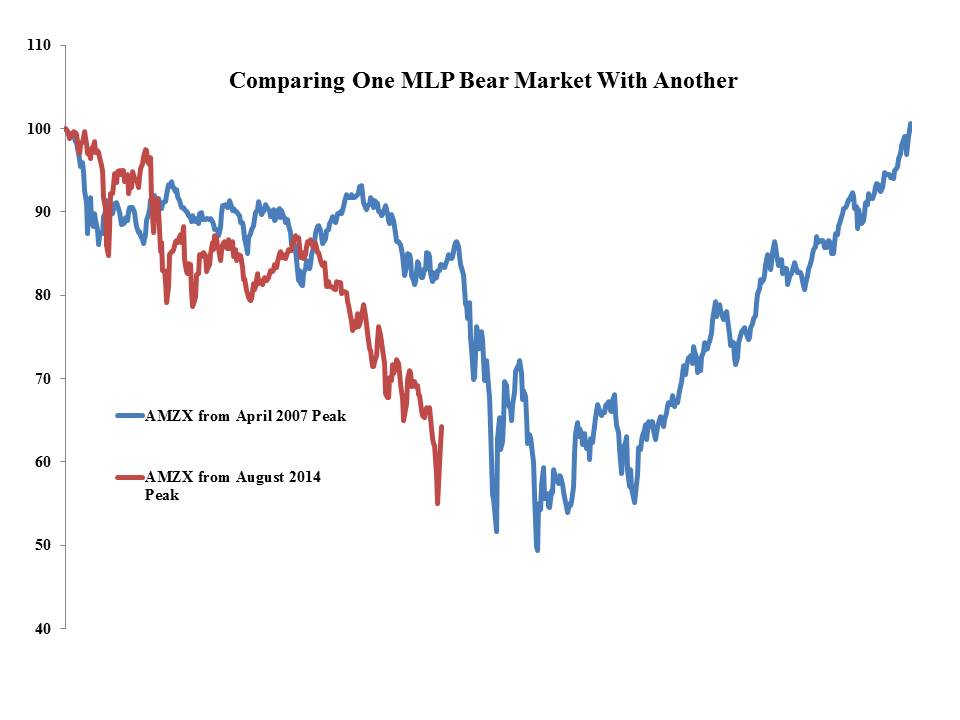
The chart below compares the Alerian Index from its peak preceding the 2008 Crash with its current path from the August 2014 peak. We’ve come down a long way.