Where America Gets its Power
One of the challenges facing solar energy in providing electricity is that demand often peaks at the beginning and end of the workday. When people are preparing to head to work or school, electricity demand rises. The second peak occurs during early evening during dinner. Solar output peaks around midday, inconveniently between the twin household peaks.
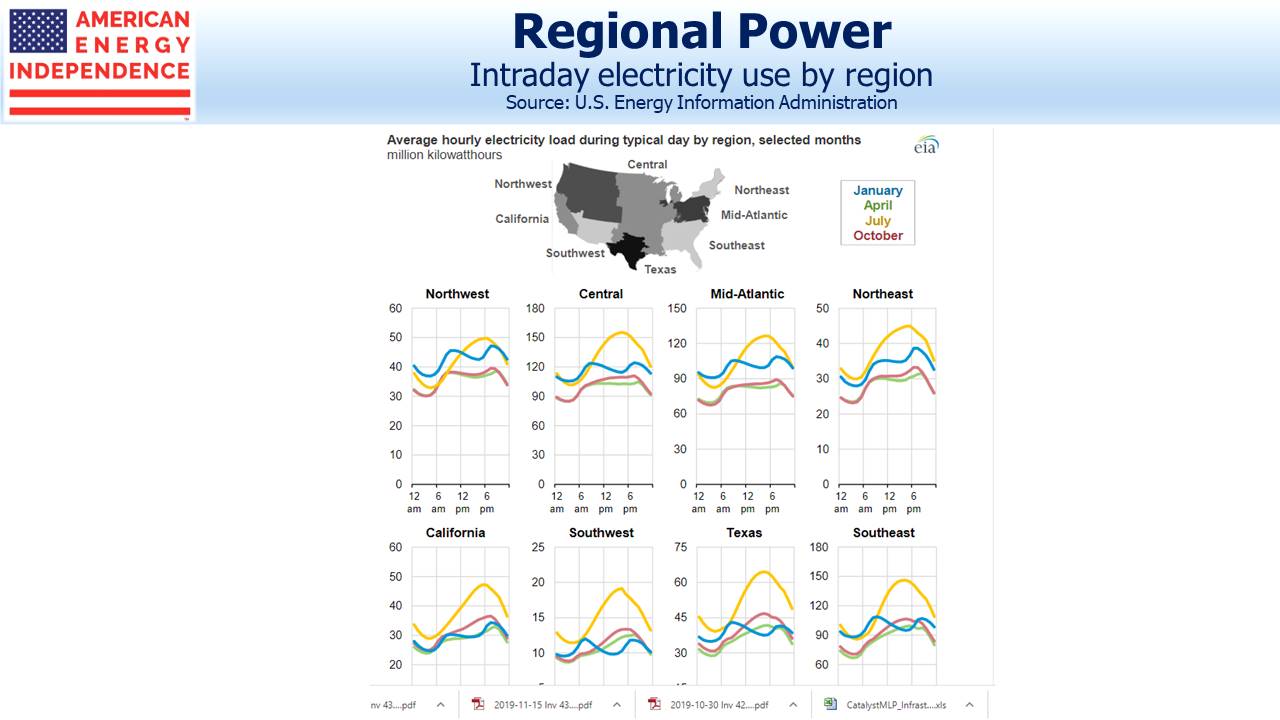
The Energy Information Administration (EIA) produces more detailed data on electricity consumption that shows intra-day consumption by region and at different times during the year. It presents a much richer picture of how we use electricity.
The twin peaks around breakfast and dinner apply most clearly during winter. There are clear regional differences too. In the southwest, consumption during the day is barely above nighttime, which is normally the trough in all cases. In the northeast and Pacific coast, evening demand is higher than morning, while in Texas and the southeast the reverse is true. It’s probably driven by relatively fewer hours of daylight in northern latitudes, but perhaps Texans watch more morning TV as well.
In summer, the need for air conditioning dominates, and intra-day electricity consumption is highest around mid-afternoon in every region, which aligns more conveniently with solar output. As a result, demand is highest in the summer, with spring and fall being lowest.
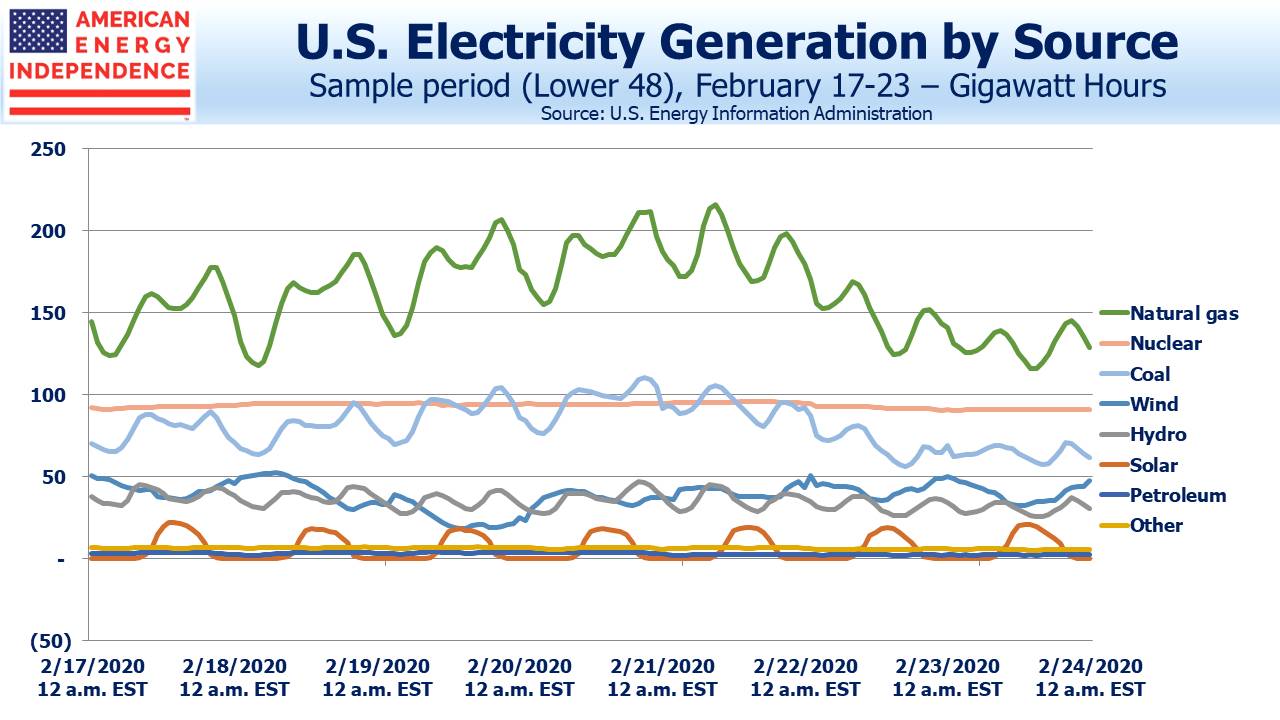
You can also see how we source our electricity on an hourly basis. The chart takes a recent seven-day period. Solar and wind are intermittent, so they produce when they can. Natural gas and to a lesser extent coal produce when they’re needed, which highlights a huge advantage fossil fuels have over renewables. Often the intra-day peak for natural gas is when renewables generation is low. Coal burning power plants are less able than natural gas plants to change output easily in response to shifts in demand. Over the sample period, natural gas output had a -0.40 correlation with wind, neatly capturing the symbiotic relationship that exists between the two. As a grid increases its reliance on renewables, fluctuations in output must be balanced either with battery storage or natural gas. Nuclear output is steady, making it a poor renewables partner, although an energy policy focused on reduced emissions would favor increased nuclear power.
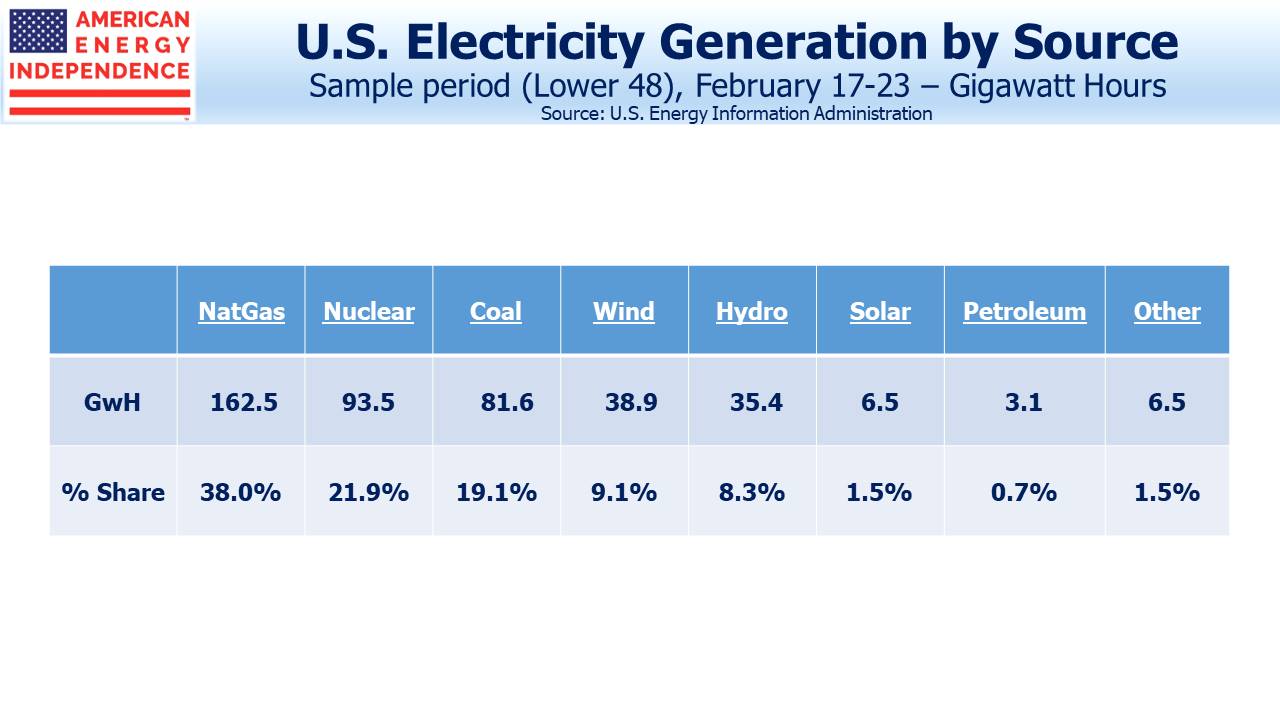
Although renewables receive substantial press coverage, solar provided only 1.5% of our electricity in mid-February. Wind has been more successful, at 9.1%. But the big change in mix has been the steady displacement of coal by natural gas, which drove America’s 2.5% drop in CO2 emissions last year. Natural gas burns cleaner and runs when it’s not sunny or windy. It’s part of our energy future.


