What Investors Ask Your Blogger
Recently I’ve given presentations to a couple of investment clubs in Naples, FL. Usually I speak about midstream energy infrastructure, but I was also asked to expand on Our Darkening Fiscal Outlook, recently published on our blog,
The Q&A is always enjoyable at such events. Below are some common themes that came up.
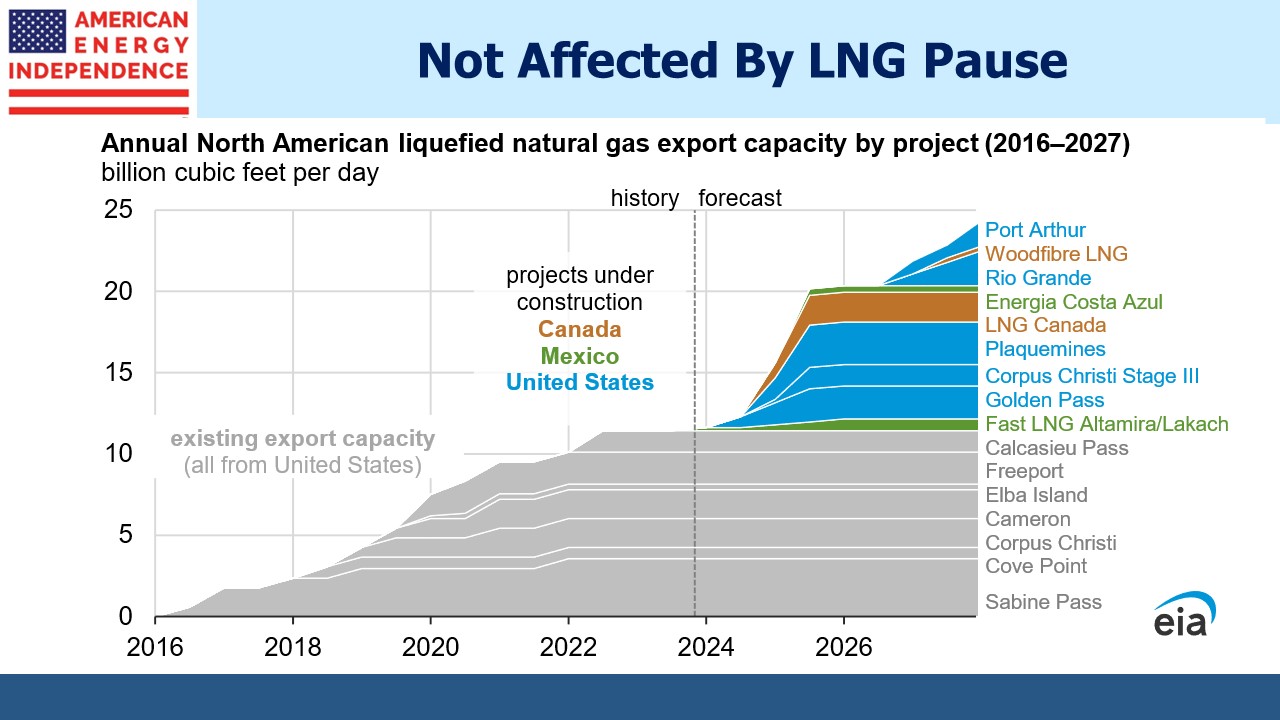
Don’t weak natural gas prices show that Biden’s pause on approving new LNG export terminals is hurting US producers?
The White House directed the Department of Energy (DOE) to consider the overall climate impact of approving further LNG exports. They didn’t cancel existing approvals, so North American LNG export volumes are still on track to roughly double over the next four years. This includes new terminals in Canada and Mexico.
As noted previously, the pause is unlikely to reduce emissions since Asia will simply burn more coal. Pakistan announced last year a quadrupling of coal-generated power because of high LNG prices. But it is causing uncertainty. For example, Japan’s Kyushu Electric is postponing negotiations with Energy Transfer about buying LNG from their planned Lake Charles terminal until it’s clear it will be built.
Today’s weak US natural gas prices aren’t related to the DOE pause, since it only affects the construction of new terminals which are several years out. Prices are weak because of a relatively mild winter (although I can report Naples has been unusually cold). Chesapeake recently announced they’ll be reducing natural gas production because of low prices. With natural gas well below $2 per Million BTUs, it’s clear that domestic producers and foreign buyers would both benefit from increased trade.
Will there be more mergers in the midstream sector?
Investment bankers have been busy in the energy sector over the past six months or so. The number of MLPs keeps shrinking although we expect Enterprise Products and Energy Transfer to retain their pass-through status given high insider ownership. Western Midstream Partners (WES) might be sold at some point, and that would further reduce the number of MLPs. It would also create a deferred income tax recapture event for holders if bought by a c-corp. Magellan Midstream agreed to Oneok’s acquisition last year despite the tax bill it created for long-time investors. Presumably WES holders might similarly accept a merger-induced tax bill if they felt the terms were right.
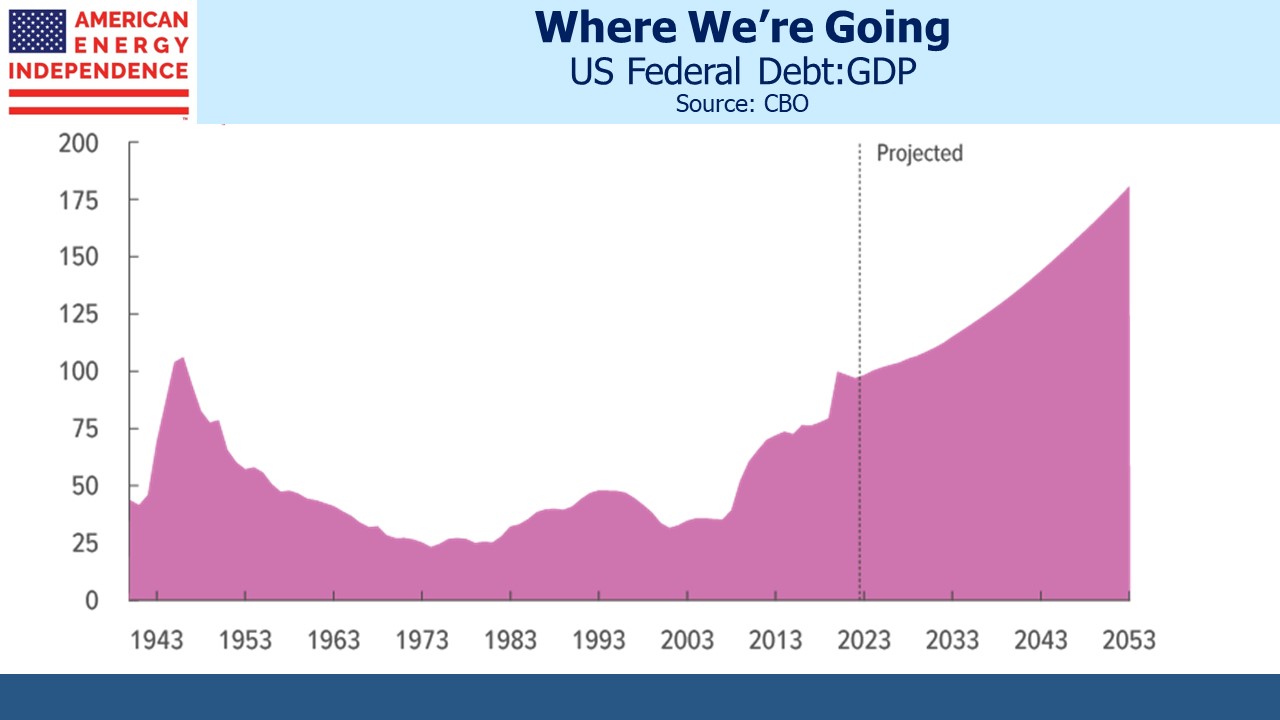
When will our dire fiscal outlook provoke a crisis?
A chart showing the stratospheric path of US indebtedness is sufficient to make the case that a debt crisis is inevitable. So why hasn’t it already happened? Thirty year bond yields of 4.5% do not reveal reluctant buyers. But then Argentina has defaulted nine times since independence in 1816 and is always able to come back for more. It’s unclear why any return-oriented investor would ever buy Argentine debt, but there are sufficient undiscerning bond buyers that in 2017 they issued 100 year bonds.
Bond underwriters know how to have fun at others’ expense. Let’s hope there were no CFA charterholders making such purchases.
Since at least as far back as the Great Financial Crisis of 2008-09, a surplus of return-insensitive capital (central banks, sovereign wealth funds) along with inflexible mandates at others such as pension funds has kept yields low.
The Federal Reserve owns almost a fifth of our Federal debt, a portion the Congressional Budget Office expects to remain unchanged. Research suggests that quantitative easing reduced bond yields by as much as 1%. This contributes to the present conundrum whereby monetary policy is generally regarded as restrictive whereas the inverted yield curve leaves ten year treasuries at 4.3%, or 2% above expected inflation over their lifetimes.
3.3% GDP growth, 3.7% unemployment and a stock market at new highs all suggest that rates are not much of an economic headwind.
Can I trust the inflation numbers?
It’s always fun to demonstrate why inflation statistics are deceptive. See Why It’s No Longer Enough To Beat Inflation. In brief, there is no government conspiracy to understate inflation. It’s just that the economists at the Bureau of Labor Statistics measure what they can, not what you think.
“A basket of goods and services of constant utility” is what they measure. Statisticians strip out quality improvements, because they provide more utility. So consumer electronics such as iphones show up as falling in price because more features for the same cost equals a price cut in BLS-land.
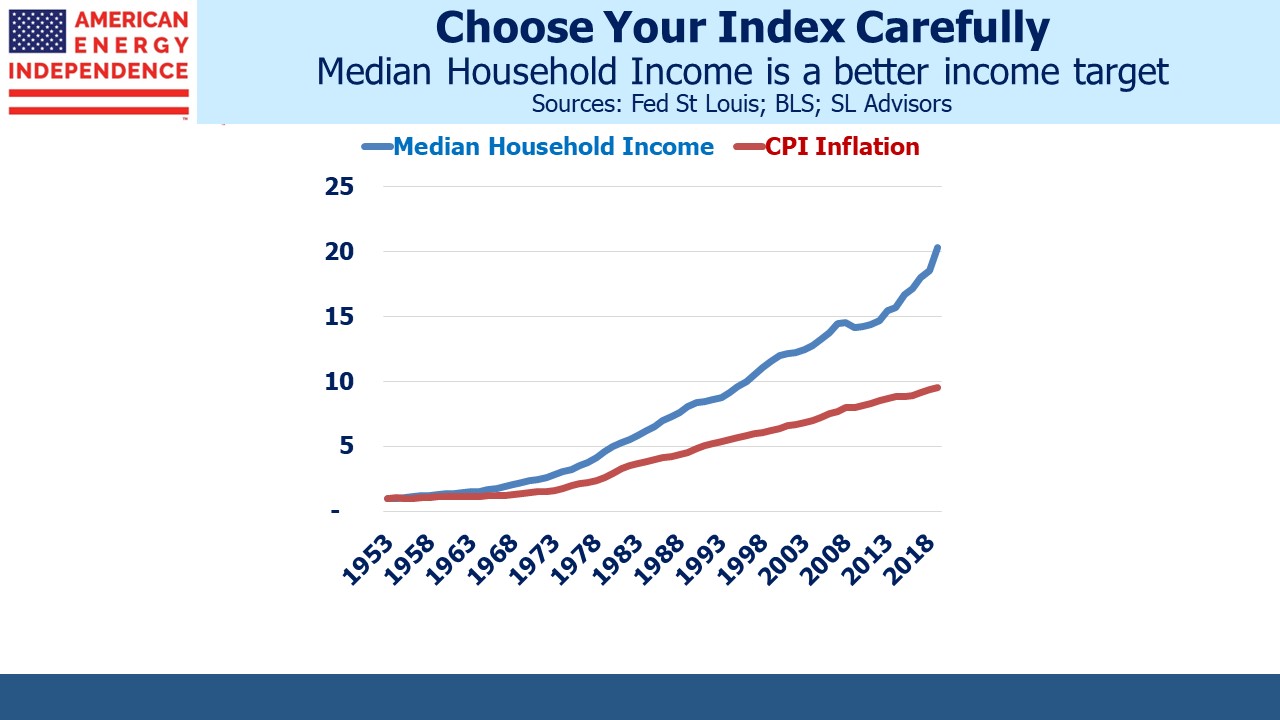
What most investors want to know is the rate at which their spending capacity needs to grow so that they don’t feel any poorer. Since living standards grow, simply keeping up with CPI will leave you worse off relative to the median.
Whenever you read “in today’s dollars” the writer isn’t giving a true picture of what it felt like to buy, say, a color TV in 1953 which cost $1,500.
That’s around $15,000 “in today’s dollars” because using CPI you need $10 today to buy what $1 did back then.
2022 median household income was $92,750, so that TV looks as if it cost about two months pay for the typical family. But in 1953 median household income was $4,242, so it really took over four months of pay to buy the TV.
The correct comparison would keep the portion of household income needed to buy the item the same as in 1953. Multiplying the $1,500 1953 TV by $92,750/$4,242, or 21.86, gives almost $33K. That’s the more meaningful representation of what a 1953 TV cost. It keeps the portion of household income needed to buy the TV the same in 2022 as in 1953.
There’s no need to mistrust the BLS. But if your purchasing power doesn’t keep up with median household income, you’ll gradually become poorer by comparison with the rest of the country.
We have three have funds that seek to profit from this environment:


