Warnings Of Inflation Grow
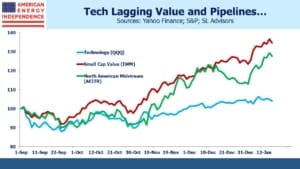
In early November when Pfizer’s vaccine announcement triggered a strong rally, technology stocks lagged small cap value. Having been out of favor for years, the Russell 2000 sprang to life, drawing in buyers at the expense of tech.
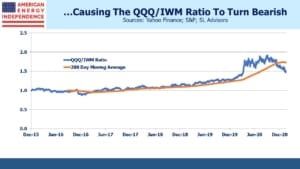
The relative movement of tech to value, defined as the ratio of the Nasdaq and Russell 2000 indices, crossed through its two hundred day moving average. This signaled an end to tech’s previous ascendancy, at least for those who follow charts.
The pattern has continued since, with the ratio now solidly below its two hundred day. It looks like a new trend has begun. Pipeline stocks are beginning to show up on recommended lists. US News included Kinder Morgan (KMI) among their ‘7 Best Value Stocks to Buy for 2021.’ Barrons regularly pushes midstream energy infrastructure for yield. The components of the American Energy Independence Index, undoubtedly a value play, still yield over 8% on a market cap weighted basis even after rallying 12% in January.
Coincident with this shift in leadership, signs of inflation are appearing. Liquefied Natural Gas (LNG) prices have soared in Asia because of unusually cold weather. JNK LNG, the regional benchmark, recently traded up eightfold from last April with some Asia-bound shipments trading at 10X the price of the US Henry Hub benchmark last week. This is great news US LNG exporters.
The JNK squeeze is dramatic but temporary. However, other commodities have also been rising sharply. Crude oil has firmed up on hopes that vaccinations will allow a return to our former lives by summer. China’s sharp economic rebound has more than doubled the price they pay for iron ore compared with March. Even rice has risen over a third since October. Prices for hot rolled steel have doubled. Inflation is increasingly a conversation topic among investors, and is drawing more media attention such as Higher inflation is coming and it will hit bondholders in yesterday’s FT.
Gold has been weakening in recent months, but Bitcoin has soared, perhaps becoming the refuge of choice for some fleeing fiat money.
The Federal government is doing its best to cause bond investors sleepless nights. This week incoming President Biden will press Congress to approve an additional $1.9TN in pandemic relief, our third package in a year. The Federal Reserve is actively seeking inflation above its 2% target, to compensate for years of undershooting.
If inflation doesn’t rise, it won’t be because we didn’t try. It’ll reflect the continuation of disinflationary forces that have constrained it for so long.
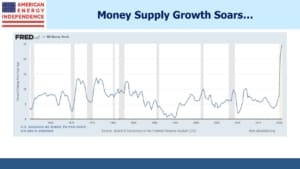
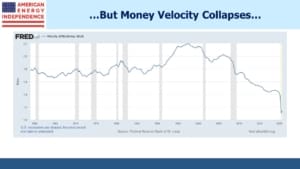
Money Supply as measured by M2 is growing at the fastest rate since records exist. However, nominal GDP is not similarly rising, since money velocity is plunging to new depths. During the 2008-09 financial crisis, when the Fed’s Quantitative Easing led to M2 growth less than half as strong as it is now, some feared a resurgence of inflation. However, the extra liquidity sat in bank reserves and was only slowly recycled into the economy.
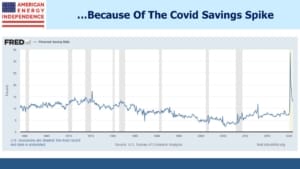
The difference today is that money market funds for institutional and retail accounts are $4.3TN, far higher than a year ago. The US savings rate soared above 30% last April, and although it’s been falling since then it remains historically high. By contrast with 2008-09, these balances are readily available to fund consumption.
There is substantial dry powder for households to spend, should they so wish.
But there’s also substantial overseas demand for US treasuries, which yield the most of any G7 nation. Japan holds $1.3TN, and China $1.1TN. Theoretically, interest rate parity means that yield differentials among different sovereigns shouldn’t matter once the cost of FX hedging is factored in. But as this article implies, Japanese buyers of ten year treasuries aren’t using ten year forward FX trades to hedge their risk – they’re most likely hedging within one year, where interest rate differentials are narrower and liquidity better, making it cheaper. In effect, they’re taking yield curve risk between short term and long-term rates, but it’s been working for years. With the Fed unlikely to raise rates in the near term, it probably still looks low risk.
The bottom line is that, as long as U.S. inflation remains low, long term rates are likely to remain low too. But as lockdowns finally end, many months of frustrated purchasing power could be unleashed. How that plays out will determine the path for bonds. The market isn’t pricing in repeat of the ‘Roaring 20s’, a century after the first one.
We are invested in all the components of the American Energy Independence Index via the ETF that seeks to track its performance.
