Vote No on the Energy Transfer-Williams Merger
The Energy Transfer-Williams merger continues to be a bizarre spectacle. While the Williams (WMB) Board in an SEC filing noted that a majority was in favor of the merger, their body language says otherwise. They are speaking in code. The filing notes that anticipated synergies from the transaction are virtually zero and that the new ETC stock for which WMB holders will exchange their shares will not pay a dividend for two years. On top of this, three former CEOs of WMB published a letter noting the move by Energy Transfer Equity (ETE) CEO Kelcy Warren to dishonestly enrich himself at the expense of other unitholders (see Is Energy Transfer Quietly Fleecing Its Investors?). They emphatically recommended against the merger. WMB has complied with the merger agreement by recommending a YES vote, but that’s a technicality, required to avoid a $1.48BN break-up fee. Neither company wants to do the deal, but both want to avoid triggering penalties or legal liability for failing to close. WMB even disclosed in a subsequent SEC filing that a dividend cut was likely if they remain independent, so for WMB holders it appears that in either case payouts will be smaller. The stock barely retreated on this news – perhaps the 12% free cashflow yield already provides sufficient support.
We read between the lines and voted NO. We’re comfortable with our modest exposure to Kelcy Warren, but don’t wish to increase it by trading in our WMB stock. We are invested in ETE and WMB.
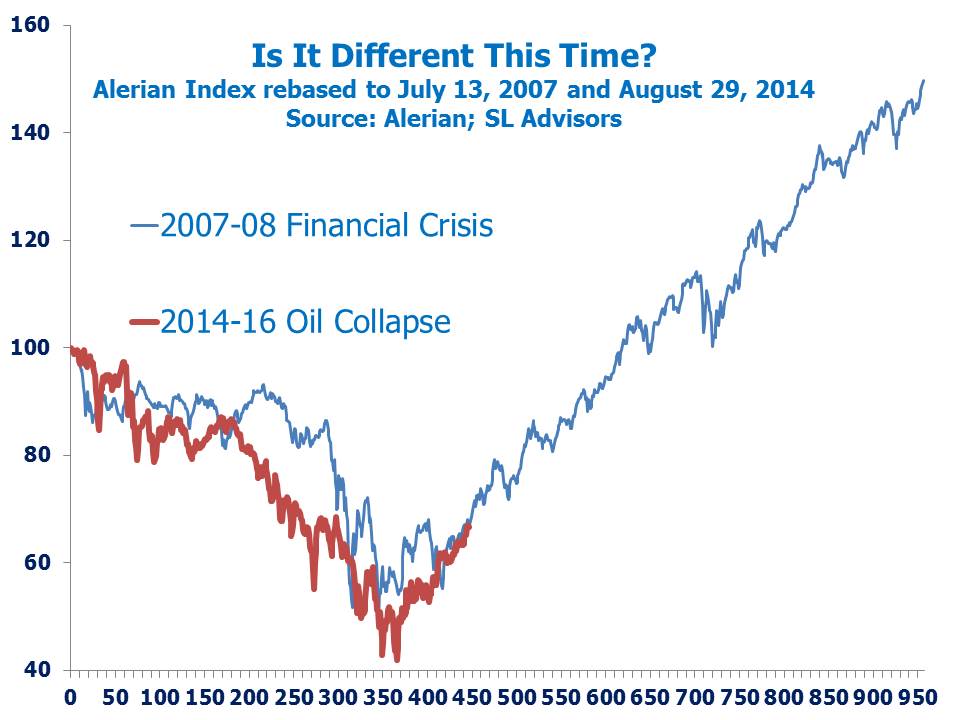
The chart below is a helpful visual that puts recent moves in the Alerian Index into perspective. The 2015 MLP Crash (which looks like it ended on February 11, 2016) looks similar to the 2007-08 Financial Crisis, at least in terms of the price moves. For much of 2015 MLPs endured their own personal market disaster while other sectors of the equity market outside of energy paid little heed. At 58.2% it was the biggest drop in the Alerian Index’s history, going back to 1997. For those who find such comparisons useful, big drops in the sector have been followed by proportionately big recoveries. So for example, the 52.3% drop in 2007-08 was followed by a 139% recovery over the following two and a half years. As the chart shows, if past is prologue there’s still a long way to go. As we are frequently reminded though, past performance is not indicative of future results. Therefore, our constructive outlook on the sector is predicated on fundamental supports such as valuations and the positive long-term outlook for U.S. hydrocarbon output as we head towards energy independence.