Using More Of Every Energy Type
On Monday the Energy Institute (EI) published the 72nd edition of the Statistical Review of World Energy. BP handed off this responsibility last year. They probably felt that saying anything about energy consumption would inflame climate extremists without commensurate benefit.
The EI launched the publication with a webinar, which predictably was both upbeat on renewables while lamenting their slow penetration. The interesting data in the review mostly concerns fossil fuels, which one panelist complained remain at 82% of primary energy consumption despite renewables being cheaper. Unspoken was that it might be the result of a conspiracy by energy companies to willfully deny themselves the higher profits widespread solar and wind could provide. Or maybe they’re just not cheaper.
Renewables (defined to exclude hydropower and now four fifths solar and wind) nonetheless reached a 7.5% share of the world’s primary energy consumption last year, up almost 1%. China is the biggest consumer of renewables power at 29% of the global total. They’ve grown their consumption at almost 25% pa over the past decade. China provides many energy superlatives.
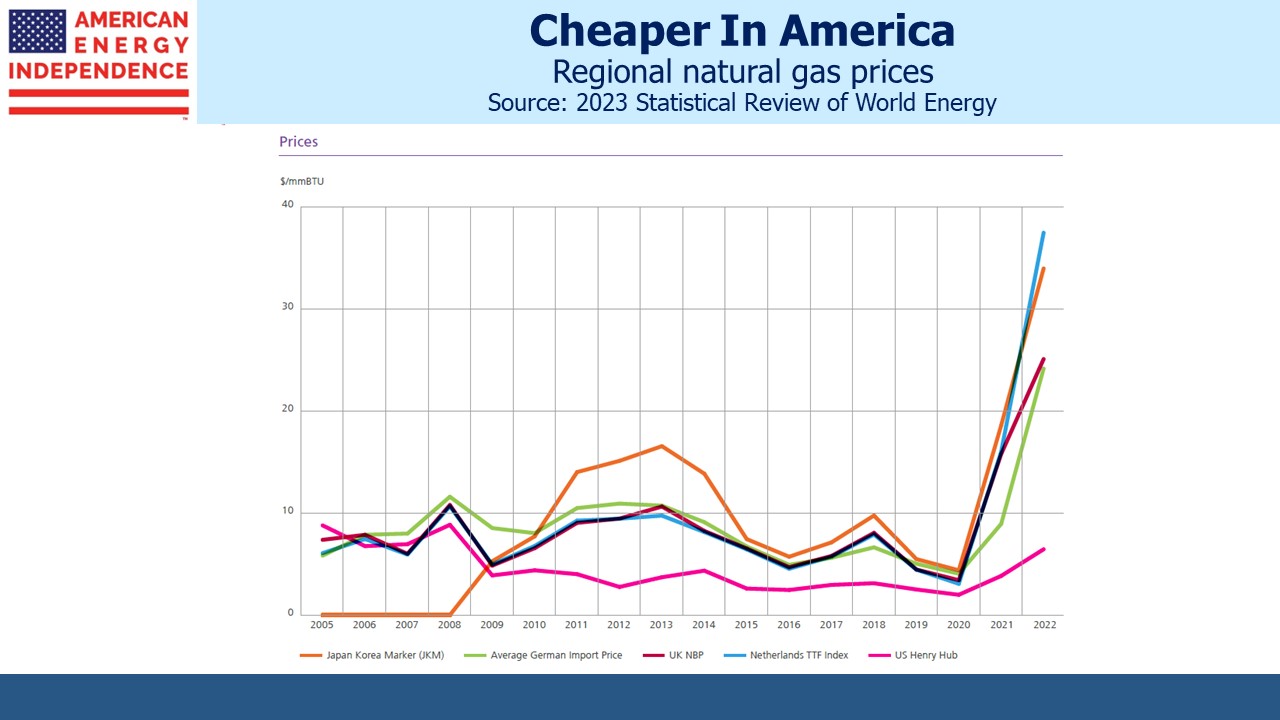
Some may be surprised to learn that global natural gas consumption fell 3% last year, but this was a demand response to Russia’s invasion of Ukraine. Prices paid by Europeans jumped as much as threefold, and in Japan almost doubled. US prices rose too but remain far below other global benchmarks.
The result was that natural gas consumption fell in every region of the world except the US, where it rose 5%. The US consumes 22% of global output and is also the biggest producer with a 24% market share.
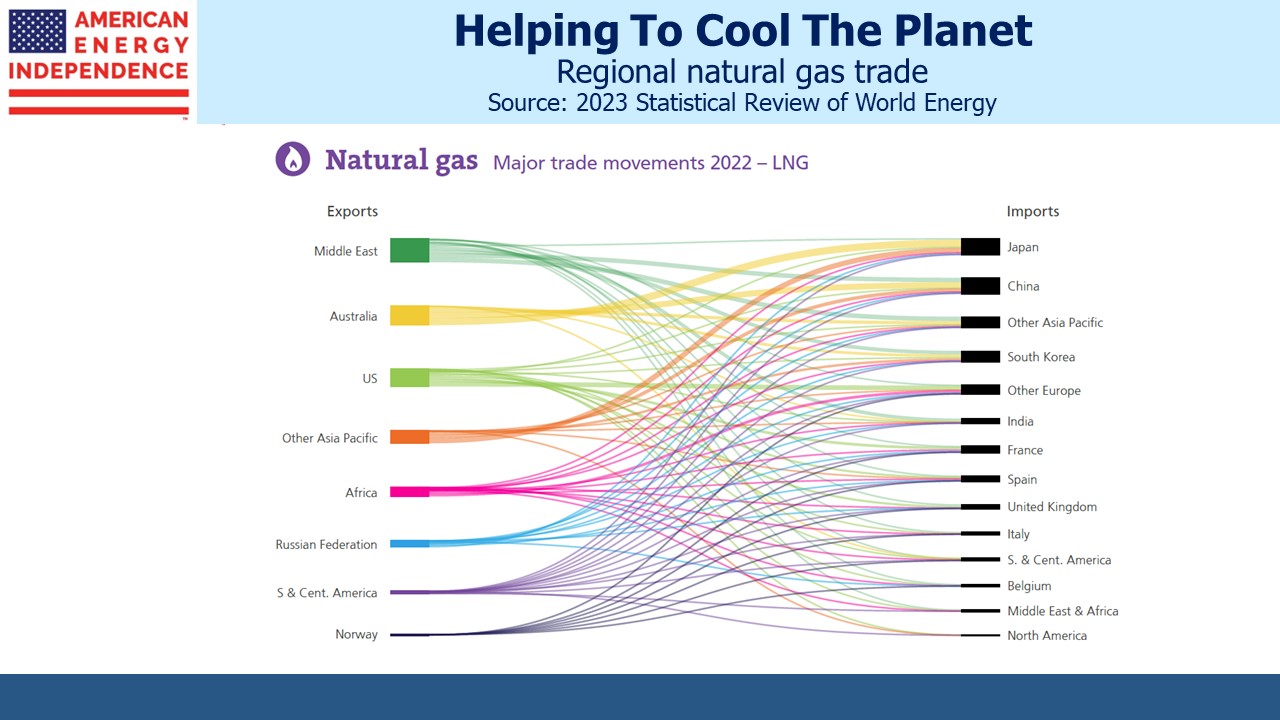
Regular readers are familiar with the growth in US Liquefied Natural Gas (LNG) exports, up from almost nothing a decade ago to 104 Billion Cubic Meters (BCM) last year. Global trade in LNG used to be dominated by Asia, but last year European LNG imports rose 57%. The global LNG trade reached 542 BCM, up from 516 BCM the prior year with a ten year Compound Annual Growth Rate (CAGR) of 5%. Japan replaced China as the top LNG importer as the Chinese lockdown slowed domestic economic activity. However, China is expected to displace Japan this year or next. Increased LNG typically reduces coal demand, a goal most will find desirable.
Coal consumption grew slightly, although surprisingly not in Europe in spite of their need to replace Russian natural gas. Energy conservation and slower growth caused overall energy consumption to dip in the EU, while sanctions had a similar effect on Russia. China continued to burn over half the world’s coal, increasing slightly from 54.6% to 54.8% of global consumption. This is 9X the US, where consumption has been declining at a 5.5% CAGR.
The best news on China is its continued growth of nuclear power, which has a 15% CAGR over ten years. The US remains the global leader in nuclear, producing roughly 2X the output of China. But this lead will shrink as China continues to build new power plants.
The climate change debate pits OECD countries with high living standards against developing countries whose desire for western lifestyles requires more energy use. US per capita energy consumption is 2.5X China’s and an astonishing 20X Africa’s. Our figure is flat over the past decade, while for the non-OECD countries the ten year CAGR is 1%. Poorer countries still have a lot of catching up to do.
Our CO2 emissions from energy have a ten year CAGR of –0.5%, compared with 1.6% for China. If CO2 levels eventually reach a point that harms the planet, it’ll be because China’s emissions were the tipping point.
If you care about US natural gas consumption and exports, the review was full of encouraging realism.
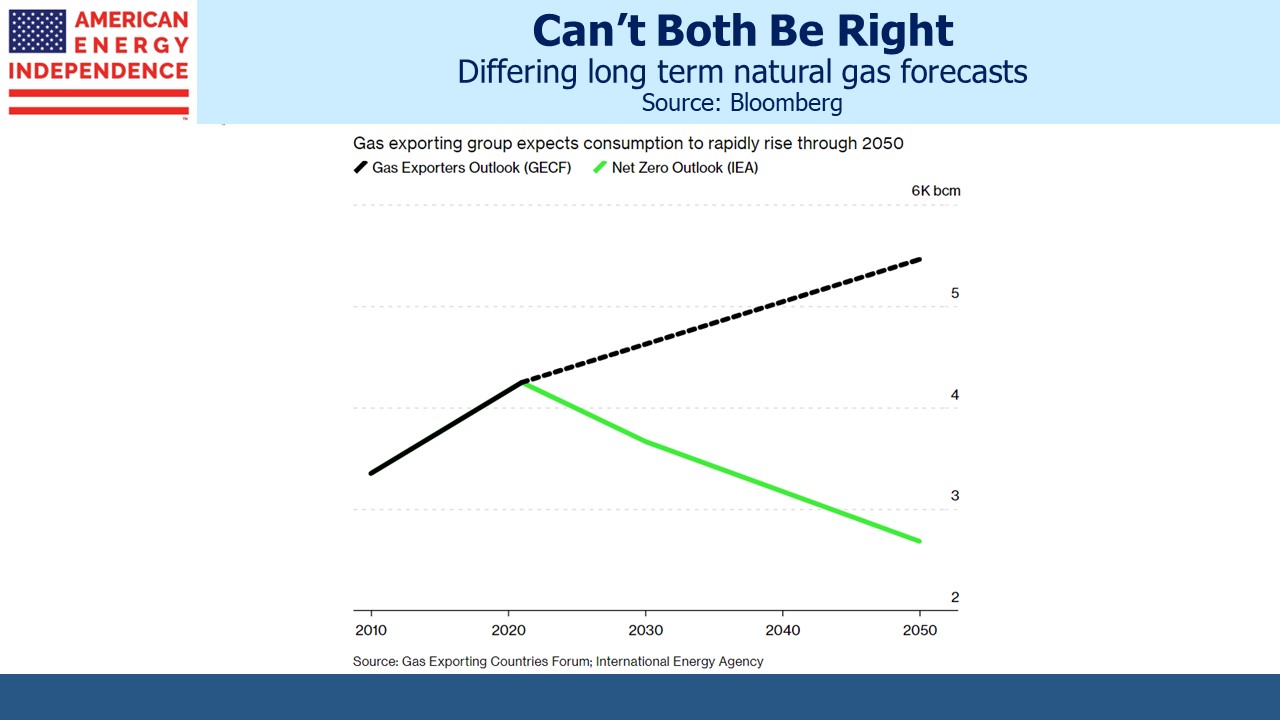
The world’s major energy companies are confirming the long term future of natural gas with their spending decisions. The forecasts of declining global consumption are what’s required to hit increasingly unlikely net-zero emissions targets, such as the IEA Net Zero Outlook in the chart.
China keeps signing long term LNG purchase agreements, including one recently with Qatar. On Monday China’s ENN Natural Gas’s Singapore subsidiary signed a 20+ year deal with Cheniere. Shell’s CEO recently told investors “Liquefied natural gas will play an even bigger role in the energy system of the future than it plays today,”
This all fits well with America’s growing dominance in the global LNG trade.
The US Energy Information Administration (EIA) warned that much of the country is at risk of energy shortfalls this summer. US power generation has grown at 0.5% pa over the past decade, so the problem isn’t caused by soaring demand. But solar and wind edged up to 15% of electricity generation last year, from 14% in 2021. Their intermittency is increasing our risk of power outages. The eastern part of the country is assessed as low risk, so living in NJ has its good points. But if your air conditioning doesn’t work when you need it in July, blame the climate extremists.
We have three funds that seek to profit from this environment:


