Unsettling The Climate Change Consensus
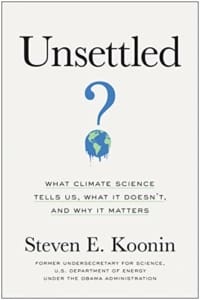
Do scientists spin the truth in order to explain complex answers simply? That is the suggestion scientist Steven Koonin makes in his new book Unsettled: What Climate Science Tells Us, What It Doesn’t, and Why It Matters.
Koonin speaks with some authority – his career includes being BP’s chief scientist 2004-09 followed by serving in the Obama administration as Under Secretary for Science 2009-11. He has a PhD from MIT in Theoretical Physics. Koonin applies his scientific background to the complex area of climate change.

Koonin is no climate denier. He readily acknowledges that human activity is increasing CO2 emissions, warming the planet. From there, he walks the reader through two huge uncertainties – how much global warming have we caused, and how bad will it be anyway.
The UN’s Intergovernmental Panel on Climate Change (IPCC) has issued a series of reports which led to the 2015 Paris agreement, where countries agreed that limiting global warming to 1.5 degrees Celsius above pre-industrial levels was necessary to avoid irreversible damage to the planet. Humanity’s future hinges on this binary outcome.
In a world of soundbites, “The Paris Accord”, “Zero by 2050” and “Saving the Planet” have all become shorthand rallying cries galvanizing action by governments, corporations and investors worldwide. The implication of certainty grates with Koonin’s scientific mind which accepts degrees of uncertainty around virtually any forecast. Using computers to model the climate (as distinct from weather) taxes the powers of even today’s supercomputers.
Global warming is likely to raise sea levels – but it turns out this has been the case since at least 1900, long before human use of fossil fuels drove CO2 levels higher. While it’s true that the 3mm rate of annual increase over the past twenty years is higher than over the past 100, the 1930s saw a similar rate.
The media often blames extreme weather events on climate change – we’re better at measuring hurricanes, which before satellites were only recorded where they encountered people on land or at sea (assuming they survived). Nonetheless, it’s hard to see any link between the fluctuations in hurricanes and rising CO2 levels.
None of this is intended to eliminate the likelihood that we’re warming the planet – simply to demonstrate that the consequences are hard to isolate.
Moreover, Koonin notes that weather-related catastrophes are killing fewer people, drawing on research from Bjorn Lomborg’s book False Alarm; How Climate Change Panic Costs Us trillions, Hurts the Poor, and Fails to Fix the Planet.
Food production, which we’re warned will collapse with warmer temperatures, has risen with a warmer planet.
The UN reported record world cereal production last year. Inconveniently, rising CO2 levels are improving plant growth. The UN cites a report that satellites show a marked increase in leaf coverage for 25-50% of vegetated areas.
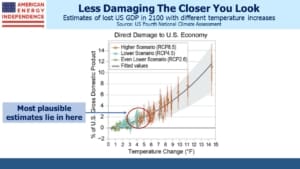
The U.S. Global Change Research Program (USGCRP) is a Federal agency charged with assessing the impact of climate change. Their Fourth National Climate Assessment was published in 2018, and is full of warnings. But the economic consequences, as Koonin notes, seem insignificant.
The Assessment estimates the economic cost of different scenarios. Although the chart extends as far as a 15° F temperature increase by 2100, most serious forecasts of inaction are in the 3-5° range. Assuming 2% real GDP growth, the U.S. economy will grow from $21TN to $102TN by the end of the century. If climate change makes it 2% smaller (i.e. $100TN), that would mean annual growth was 1.97% instead of 2%. The chart looks dramatic, but the plausible economic cost seems inconsequential.
This really gets to Koonin’s point, which combines uncertain climate forecasts with unclear consequences to ask why there isn’t any cost-benefit analysis done on the world’s response to rising CO2. Bjorn Lomberg and Alex Epstein (the latter in The Moral Case for Fossil Fuels) make similar arguments. Increased energy use has improved living standards for billions of people. Koonin notes that the World Health Organization has said that indoor cooking with wood and animal waste is the most serious environmental problem in the world, affecting up to three billion people. This will not be solved with solar panels and windmills in rural areas of emerging countries.
The science is uncertain, and the range of possible outcomes includes some very dire ones too. Prudent risk management of the only planet we have demands some steps towards mitigation. Perhaps some of the scientists who do this work, despairing of the difficulty in communicating complex uncertainty, have resorted to simplifying the message in order to promote changed behavior they sincerely believe is needed.
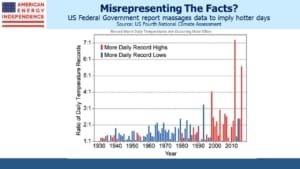
Koonin explores this. In the USGCRP’s Fourth Assessment, they include a dramatic chart that shows more record daily high temperatures. This is why hot days cause the media, and our friends, to blame global warming. But the construction of the chart is odd. It takes the number of new record highs divided by the number of new record lows and plots this ratio. Koonin shows that what’s actually happened is that the average coolest temperature has increased, while the average hottest is about the same as in 1900. Our nights have been getting less cold – our days are not warming. The climate is getting milder.
The chart begins in 1930, so you’d expect a lot of record highs and lows at the beginning of the sample period. This will keep the ratio of the two close to 1.0. As decades pass, the growing prior history will make new records less common, which will also cause the ratio of new highs to new lows to fluctuate more.
Fewer record cold days with unchanged record highs has caused the ratio of the two to rise sharply. But why display the information in this way? Taking the ratio of new highs to new lows from a fixed date in the past is not at all intuitive, and it portrays a very different picture of temperatures than the actual data. At best it’s an example of sloppy work, and at worst it’s an effort to present a biased picture so as to prompt more urgent action.
Because political discourse requires you to be for or against, critics call Koonin a climate denier, That is to ignore his thoughtful embrace of scientific uncertainty, and his advocacy for informed choices that try and balance cost/benefit. Too few climate extremists read the science, and if they truly believed humanity’s existence was threatened they’d quickly embrace natural gas power generation so as to phase out coal, and far greater use of nuclear energy.
The obsession with solar panels and windmills belies lack of serious thought and is why global emissions keep rising – most people care until the energy transition costs them money, which it most assuredly will or we’d have already transitioned. Steven Koonin’s book is a welcome contribution to more informed debate about climate change.
We are invested in all the components of the American Energy Independence Index via the ETF that seeks to track its performance.

