The Subtle Inflation Pressure From Housing
The Administration’s explanation for the less than transitory inflation relies on supply bottlenecks and a faster than expected rebound in energy demand. Both are wrong. The Wall Street Journal recently made an interesting argument that inflation will persist (see Another Reason Inflation May Be Here to Stay).
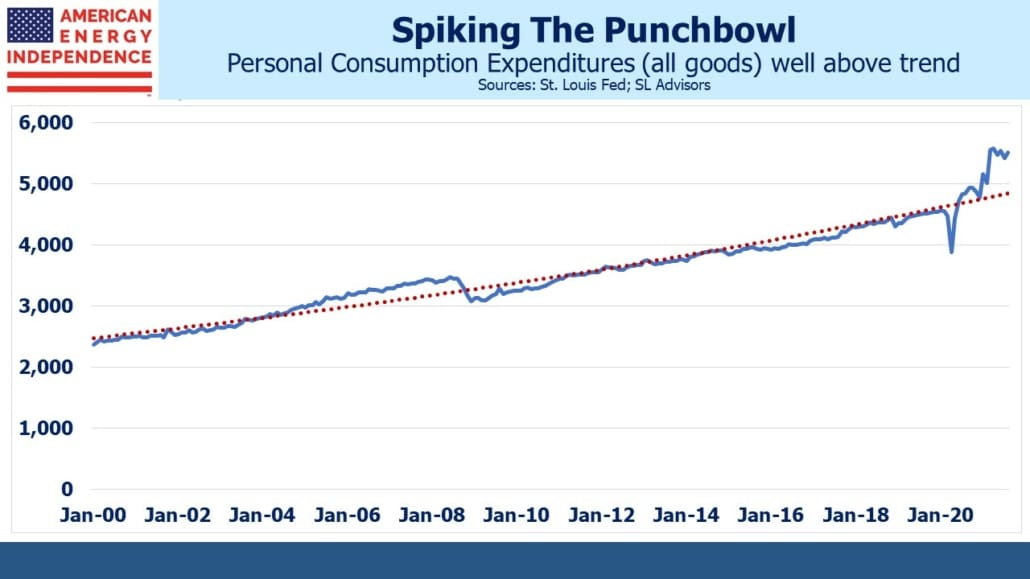
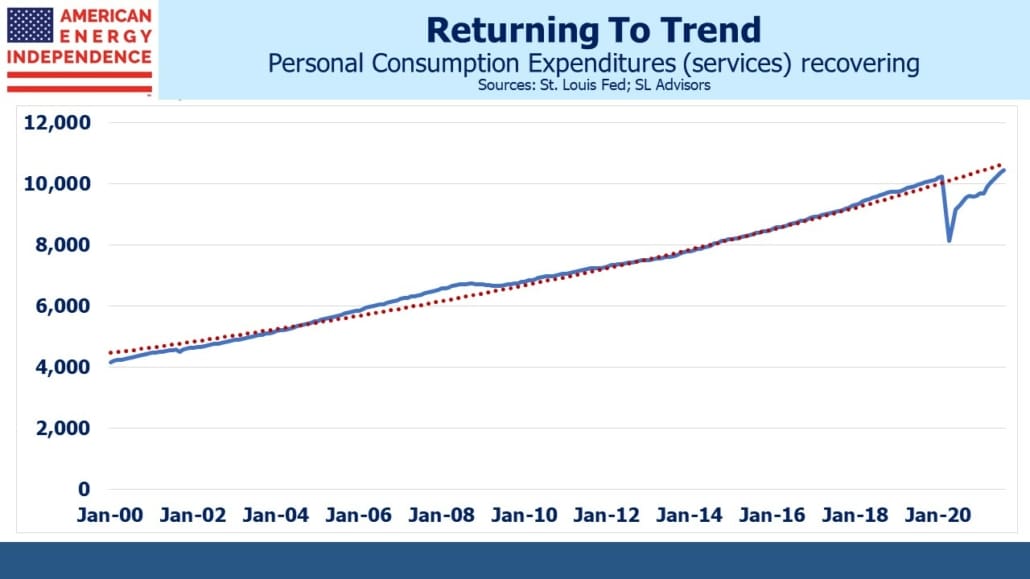
Personal Consumption Expenditures (PCE) on all goods (i.e. both durable and non-durable) is running well ahead of the long-term trend. March’s $1.9TN covid relief plan marked the end of Joe Biden’s presidential honeymoon. Critics of this and other elements of excessive fiscal stimulus point to the reason goods purchases are so strong with consequent higher inflation. Apparently, government planners expected prior spending patterns to be repeated, but services expenditures don’t show the same above trend trajectory.
In short, more of this $1.9TN was channeled into goods purchased online, and less than expected on services, reflecting that a portion of the population remains wary about going out to dinner, movies and other entertainment.
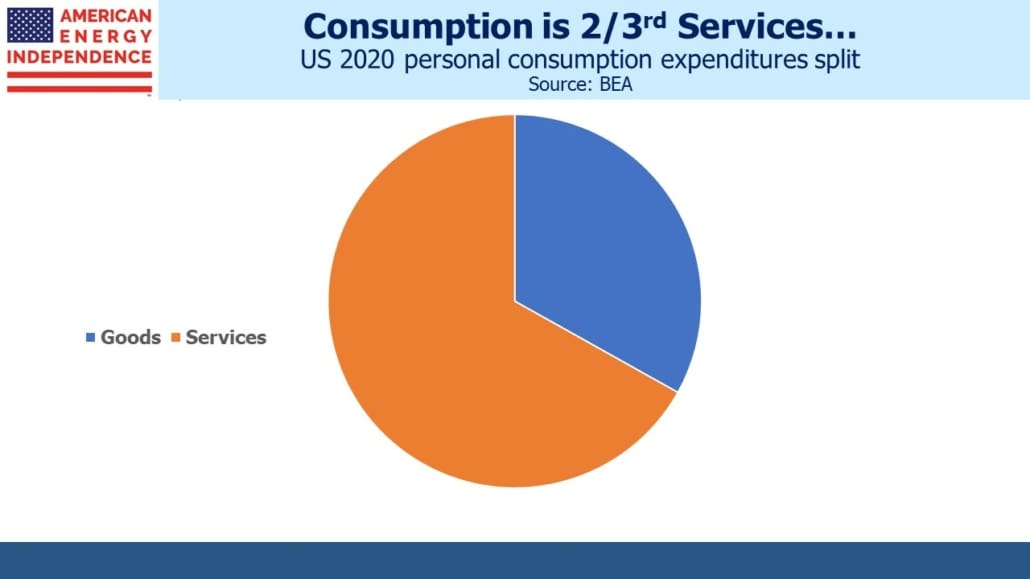
Services represents two thirds of PCE and goods only one third. So it might seem plausible to assume goods inflation will moderate, reinforcing the discredited transitory narrative.
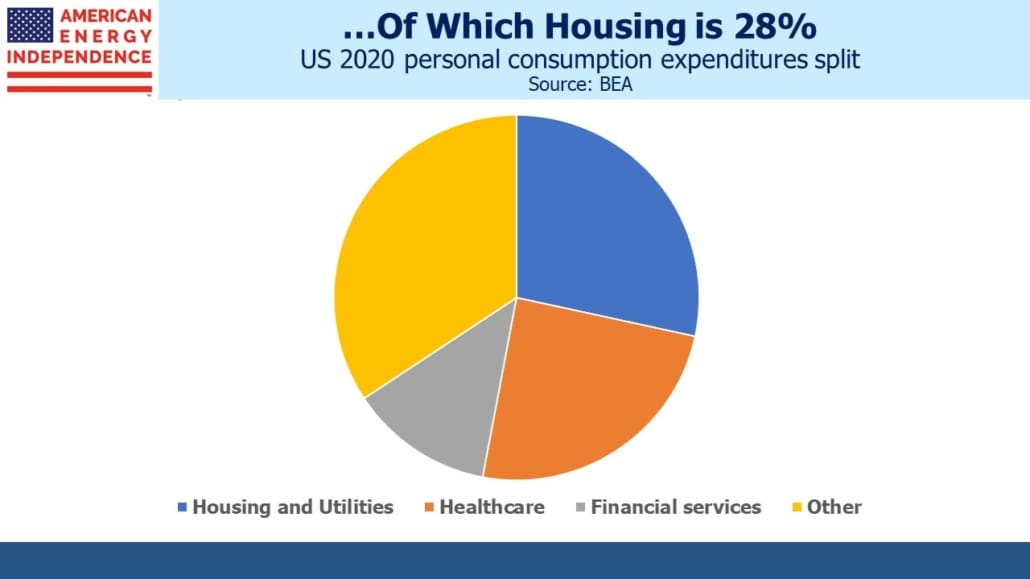
However, as the Wall Street Journal points out, housing and healthcare make up over half of services PCE. With the government largely picking up the cost of Covid-related healthcare on top of Medicare and other Federally-financed programs, this sector is distorted.
But the Housing and Utilities component is dominated by rents – both actual and imputed. The WSJ notes that leases come up for renewal infrequently, and that eventually the buoyant real estate market will translate into higher rents.
This may be true – but the WSJ overlooks the fact that two thirds of American households own their homes. For them, the cost of shelter is based on Owners’ Equivalent Rent (OER), the often criticized estimate of the value of the shelter (a service) their home provides. This shows up in the services PCE.
For those unfamiliar with the distortions caused by OER, inflation is all about the cost of goods and services, not assets. A home is an asset that provides shelter, a service. Inflation statistics try and separate the two, by surveying home owners on what they think they could rent their house for. This is the estimated value of shelter. Because home ownership is so common in the US, a large chunk of estimated housing costs are based on OER. (for a more detailed explanation, see Why You Can’t Trust Reported Inflation Numbers). The Bureau of Economic Analysis published a revised explanation of housing costs earlier this year.
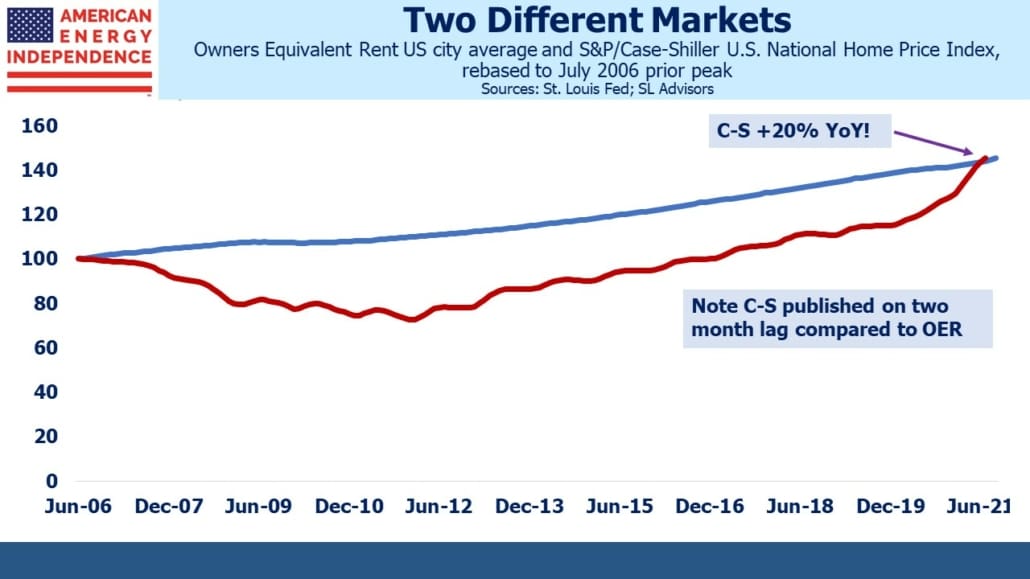
OER is a creation only a Bureau of Labor Statistics economist could love. It’s not supported by any cash transactions, but it’s used to estimate around $2TN of PCE. As the chart shows, it bears little relationship to the Case-Shiller index which tracks actual house prices – probably because most homeowners are puzzled when confronted with the survey question about rent. A defense of OER is that, over very long periods of time (i.e. a decade or more) it tends to track home prices – and sure enough since the last peak in home prices prior to the 2008 Great Financial Crisis the two series’ have similar returns.
Where next for OER? It’s hard to forecast since it’s drawn from survey responses and not actual transactions. But it’s unlikely to decrease its growth rate, and at least some homeowners might be expected to raise their imputed rent estimate in response to the strong housing market.
A rising OER will drive the services PCE higher, causing its trajectory to return to its prior trend or even exceed it. Although there won’t be any increase in cash receipts as a result, calculated spending on services will be higher and so will inflation, since CPI also derives its housing methodology from PCE.
Easing supply constraints may allow goods inflation to moderate, although there are no signs of that yet. Whether it does or not, services inflation seems likely to move higher. This will maintain the pressure on the FOMC to respond to inflation, even though OER doesn’t impact household budgets in the same way that, say, rising gasoline prices do.
It may even cause some at the Fed to comment about the weaknesses of OER, although strength in this metric would simply be a delayed reflection of the actual appreciation in home prices we’ve all seen. Either way, inflation is likely to remain persistent not transitory, a term Fed chair Powell retired at his Congressional testimony yesterday.
Join us on Thursday, December 16th at 12 noon Eastern for a webinar where we’ll provide an update on the midstream sector during rising inflation.
We have three funds that seek to profit from this environment:
Please see important Legal Disclosures.
