The Hard Math Of The Energy Transition
Getting to zero emissions by 2050, the goal set by the UN in order to limit global warming to 1.5° C above pre-industrial times, is technically well within reach. Not with intermittent solar panels and windmills – extracting all the minerals necessary for their manufacture plus enormous battery back-up in implausible. Kinder Morgan’s enhanced oil recovery process pumps CO2 into mature oil wells to push out additional crude. This is Carbon Capture, Use and Sequestration (CCUS). The CO2 emitted by power plants, cement and steel factories and other industrial users can also be captured for permanent burial without being used (CCS).
There is reported to be bipartisan support for a CCS tax credit of up to $150 per metric tonne (MT), a level many in the industry believe would spur investment in the necessary infrastructure. The US emits just under 5 Billion Tonnes (BT) of CO2 from fossil fuel combustion annually. As a simple example, assuming transportation went fully electric, swapping gasoline for natural gas to produce more electricity, at $150 per MT we’d spend $750BN eliminating energy-related CO2. This is just under 4% of GDP, roughly the same as our defense budget.
JPMorgan estimates that to sequester 15-20% of US CO2 emissions via CCS would require moving 1.2 billion cubic meters of CO2 – more volume than US crude oil production. This would require a lot of new infrastructure.
Direct Air Capture (DAC) removes CO2 from the air. This is another technically feasible strategy, especially if the world misses the UN’s goal and needs to remediate. Although one might think the atmosphere is swollen with CO2, it’s currently around 412 parts per million, or 0.0412%. This relatively low concentration means a lot of air needs to be processed to remove a MT of CO2. By contrast, power plant emissions range from 1-15% CO2 and chemical/industrial plant emissions are from 20-95%.
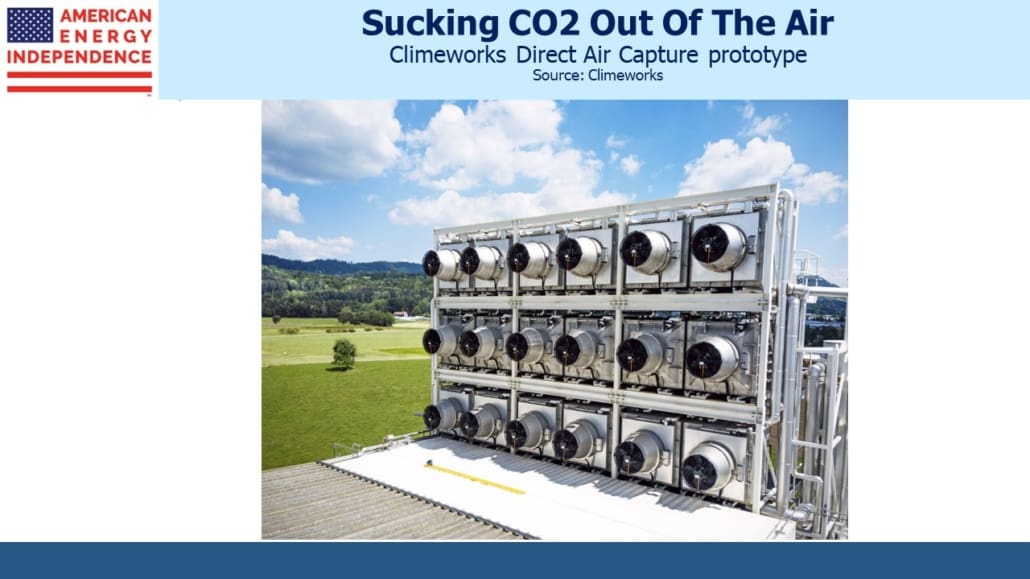
JPMorgan recently published a research paper examining prospects for DAC. There are two main technologies, one using a liquid and the other a solid which bind to the CO2 in air passed over them. Climeworks operates a prototype facility in Switzerland. DAC uses energy. JPMorgan estimates 4.9GJ per MT of CO2 removed, or 1.37 Megawatt Hours (MwH).
To put this in perspective, if the US chose to remove the 5 BT of energy-related CO2 released annually, this would require 6.8 Terawatt Hours (TwH) of electricity. We currently generate 4.1 TwH – and if this 6.8 TwH of additional electricity wasn’t generated from 100% renewables there would be further CO2 capture required.
JPMorgan estimated a range of costs for DAC of between $191 and $454 per MT. At some scale the price could be at the low end of the range but could also exhaust availability of critical inputs, increasing costs.
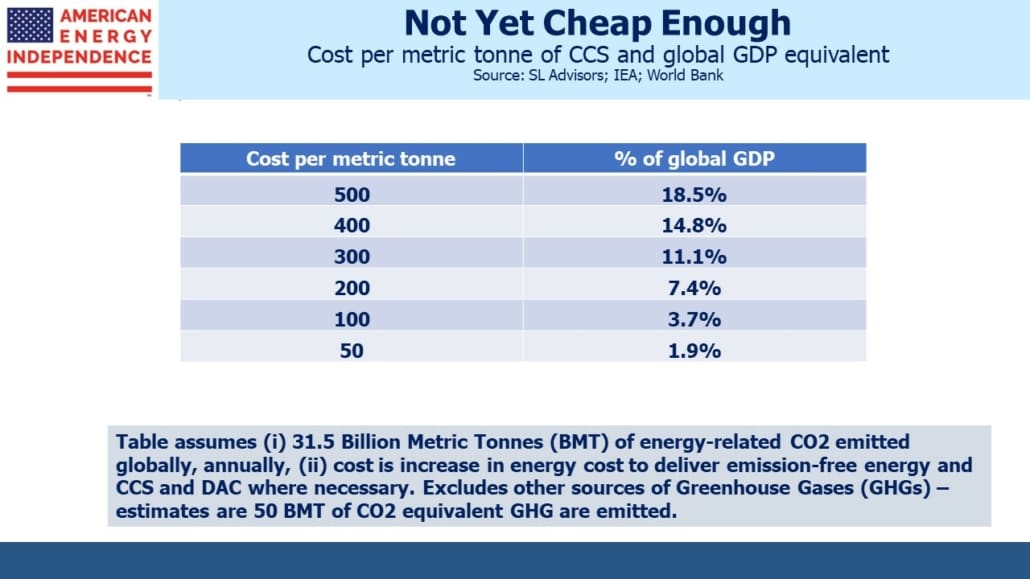
The table shows the cost in terms of global GDP of removing the 35 BT of energy-related CO2 that’s emitted. None of the figures are politically acceptable in today’s environment. Even at $50 per MT it would be just under 2% of global GDP.
Note that this analysis only considers the 35BT of energy-related CO2 emitted globally. Total emissions of Global Greenhouse Gases (GHG), including methane, are estimated at 50 BT CO2 equivalent.
This also assumes the world relies fully on capturing CO2 to reach the “Zero by 50” UN goal. Increased use of renewables, coal-to-gas switching, much more nuclear power and development of hydrogen are all being pursued to varying degrees. The EU trading system for carbon permits currently prices CO2 emissions at around €90 (US$94.50) per MT. This can be thought of as the low end of the range of cost to reach Zero by 50 because current trends and policies suggest we’re not on that path. Applied globally, that is equivalent to 3.5% of GDP just to remove our energy-related CO2 emissions.
There is lots of innovation going on. For example, NextDecade estimates that they can provide CCS services at a cost of $57 per MT (before financing). Given the financial payoff for technologies that can reduce or eliminate emissions cheaply, we should expect plenty of positive surprises.
Carbon taxes, tax credits and permits provide a rough guide to the low end of the range of cost involved in transitioning to zero-emission energy. They’re generally set at a level needed to at least partially subsidize renewables, or to impose an appropriate cost on emissions, depending on your view. They need to be high enough to induce behavioral change.
Their cost reflects the ability of clean technologies to replace our current energy systems. The cost of carbon can also be thought of as incorporating the probability that we’ll achieve substantially reduced CO2 levels. A falling cost would indicate improving competitiveness of alternate energies.
That isn’t happening, at least not yet. There is no indication that the world is willing to spend anywhere close to 3.5% of GDP in fighting climate change. US gasoline prices are relatively low compared with most other countries, and yet their rise this year prompted the Administration to blame Covid, Putin and just about everything other than their own policies while symbolically releasing crude from the Strategic Petroleum Reserve.
There is little public support for paying more for energy. Which means that the most likely outcome is continued growth in the consumption of all kinds of energy; modest gains in market share for intermittent solar and wind; and learning to cope with a warmer planet.
We have three funds that seek to profit from this environment:
Please see important Legal Disclosures.

