The Changing Pipeline Investor
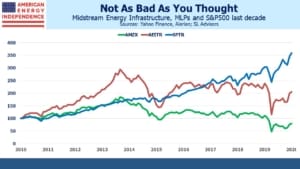
The S&P500 (SPTR) had a strong decade, returning 13.6% p.a. from 2011-20. By contrast, MLPs had a lousy ten years, delivering –1.2% p.a. The reasons have been well documented on this blog and scarcely need repeating. The Shale Revolution induced overinvestment which led to excessive leverage. Distribution cuts followed, driving away many traditional MLP investors.
But midstream energy infrastructure didn’t do nearly as poorly as MLPs. The broad-based American Energy Independence Index (AEITR) returned 7.5% p.a. MLPs have dragged down the overall sector for several years. The Alerian MLP Index (AMZX) does a poor job of representing the pipeline sector nowadays, with most of the industry having dropped the MLP structure in search of a wider set of investors.
Pipelines lagged the S&P500 to be sure, but much of the miss occurred last year. In the nine years prior to last year (I.e. 2011-19) annual returns are 13.1% and 10.1% respectively. Covid hit the energy sector hard, but strongly growing free cash flow and rising commodity prices offer reasons for optimism this year.
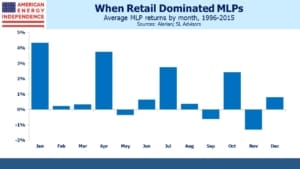
There’s also evidence that income-seeking buyers, long a core investor base for MLPs, are less relevant. For a couple of decades there existed a clear intra-year seasonal pattern around MLP returns. Because of the high yields, sellers would often wait until just after a quarterly distribution to sell. Buyers would similarly invest just prior to a distribution. This created a quarterly pattern in which the first month of the quarter, typically the record date for quarterly distributions, saw higher than average returns.
Holding a stock so as to receive the dividend is a pointless strategy, unless there are tax considerations. Stock prices, including MLPs, adjust for the payout once they go ex-dividend. It’s an example of some retail investors misunderstanding this. Clearly, over 1995-2015, sales timed just before a distribution would have generated better returns, as would purchases just after.
The K-1s also give a January boost – if you’re planning to buy an MLP in December, waiting a month avoids a K-1 for the year, just as selling in December avoids one for the following year.
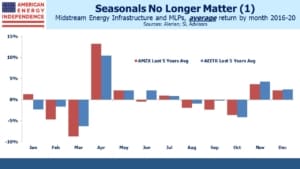
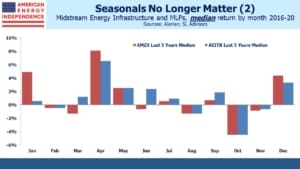
But in the last five years, higher volatility and distribution cuts have reduced the importance of quarterly distributions as a factor in timing buys or sales. Because 2020 was so volatile, it distorts average returns by month over the past five years; however, the median shows a similar result. The overall sector, as represented by the AEITR, shows a more muted pattern than MLPs, probably because of its broader, institutional investor base.
The result is that only January and April now show reliable above-average returns. Returns are positive 70-80% of the time, depending on the index. July and October no longer stand out. Trading around quarterly distributions has lost importance – that the effect remains visible in January/April could be random, or at least not related to payouts. The S&P500 has a modest January effect too, likely reflecting year-end portfolio decisions by investors.
What the data shows is that pipelines haven’t been nearly as bad an investment as MLPs alone indicate. Corporations, especially the Canadians which are prudently managed, have made the difference. And individual investors focused on distributions are a diminishing part of the overall investor base.
We are invested in all the components of the American Energy Independence Index via the ETF that seeks to track its performance.


