Rate Hike Or Not, The Same Problems Persist
On May 22, 2013 then-Fed chairman Ben Bernanke inadvertently added “taper tantrum” to the lexicon of terms used to describe the impact of the Fed’s activities. That date marks the formal beginning of the Fed’s efforts to prepare financial markets for an eventual tightening of policy — or the start of the removal of accommodative policy, to use their description. In the belief that transparent policy deliberations reduce the possibility of a monetary surprise with its consequent financial market upheaval, the Fed’s public statements, release of projections and even the ubiquitous “blue dots” showing the rate forecast of each FOMC member have all been provided to help us. In fact, for almost four years I’ve been constructing an “FOMC Futures Curve”, which is what short term interest rate futures would look like if FOMC members were the only participants. It’s been absorbing for brief moments around four times a year when they provide updated information. Many might find it a nerdy preoccupation, but having spent a good part of my career in Fed-engineered darkness over their intentions, the shift to greater openness begun under Greenspan has been fascinating.
Forward guidance presumably is intended to let us know what the Fed will do before they do it. As we head into a two-day FOMC meeting on September 16-17, opinions are evenly split about whether they’ll raise rates. Perhaps we ought not to be surprised in either outcome, but it seems to me that if there’s no consensus after years of openness, the communication strategy has failed. The problem with providing meaningful forward guidance is that it involves a commitment, and a commitment reduces your ability to change your mind. The window into the Fed’s deliberations has simply revealed that they want to retain maximum flexibility until the day they meet. Announcing a hike with a delayed effective date would soften the blow (see Advice for the Fed) but it’s too late for that.
Following the FOMC’s announcement and the elimination of near term uncertainty, investors will be faced with the same dilemma as before: how are they to invest so as to preserve the purchasing power of their assets after taxes and inflation? Whether ten year treasury yields move up 0.25% or not this week, the paucity of assets offering acceptable returns will remain Dilemma #1.
Suppose a taxable investor visits her financial advisor with the objective of constructing a portfolio with a 6% return and moderate risk. Assuming our investor is facing a 30% average tax rate (combination of Federal and state taxes on capital gains, dividends and ordinary income), a pre-tax 6% is 4.2% afterwards. 2% inflation (the Fed’s target) knocks that return down to 2.2%. Then there are the advisor’s fees, and the possibility that returns won’t be as hoped. 6% doesn’t seem that demanding given all of this, and yet the building blocks with which to achieve it are limited.
Public equities yield around 2%, and assuming the fifty-year average dividend growth rate of 5% prevails (for a total return of 7%), stocks clearly are part of the portfolio. Bonds (as defined by the iShares Aggregate Bond ETF which tracks the Barclays Aggregate Index) yield 2.4%. Since the yield at which you buy a bond heavily impacts your total return, it’s going to be hard to do much better than 2.4% with investment grade debt. Moreover, the ability of bonds to offset a falling equity market is limited given their already low yields. Backward-looking models may justify them, but to us they look like returnless risk. Moving up the risk spectrum to High Yield gets you 5.5% (as defined by the iShares High Yield Corporate Bond ETF). There is some chance for capital appreciation — but this year capital losses have more than wiped out coupon income reflecting the preponderance of energy names in the index.
REITs yield 4.4% (as defined by the Vanguard REIT ETF), and this, combined with some modest growth may deliver a return that at least equals the investor’s 6% target.
Regular readers can by now guess where this is going. The Alerian MLP Index, yields 7.25%, and MLP distributions even grew in 2009 following the financial crisis. However, MLPs are down 23% so far in 2015. In fact, they’ve fallen that much since the end of April, creating an unpleasant backdrop to an otherwise glorious Summer for anyone more than tangentially involved.
There is a bear story to MLPs, as those prescient enough to sell at the highs of August 2014 well know. A 33% drop can’t happen without a fundamental story, and the collapse in oil is challenging the expected production growth of U.S. shale plays with its attendant reduction in needed infrastructure. The growth story that has driven MLP prices is in doubt.
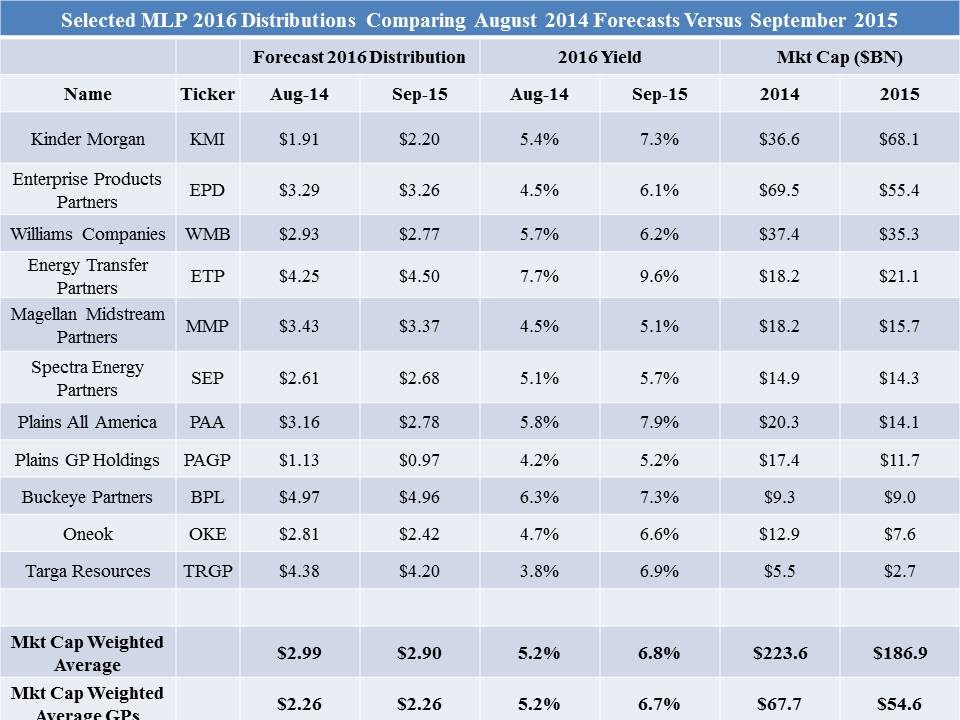
It’s therefore instructive to examine metrics on a number of businesses as they were in August 2014 and how they appear today. The table below shows forecasts for 2016 distributions from selected MLPs (chosen unscientifically because we are invested in them or the General Partners that control them), and shows how those 2016 forecast distributions have changed from the market peak in MLPs 13 months ago to now. The data is from JPMorgan but such figures are typically heavily influenced by company guidance.
Looking at the numbers, you certainly wouldn’t think we’d seen a collapse in oil. The 2016 forecast distribution for this group is modestly lower at $2.90 (cap-weighted) versus $2.99 a year ago. The market cap of these companies (excluding Kinder Morgan since during the intervening period it combined with its two outstanding MLPs to create a substantially larger entity) has fallen by 16%, hence the 2016 yield has risen from 5.2% to 6.8%. Just looking at the General Partners in this group (KMI, OKE, PAGP and WMB) provides a similar result. The operations of these firms and their cashflow generating abilities have on average not shifted that much. Plains All America (PAA) and its GP (PAGP) have seen forecast reductions because of their crude oil exposure. The same is true of Oneok (OKE).
But overall, the fall in their security prices has simply driven up their yields. These names are representative — they’re all midstream, which is to say they operate toll-like business midels with limited direct commodity exposure. There are MLPs concentrated in Exploration & Production (upstream) and others that run refineries (variable distribution MLPs), but we don’t care about those.
So for the investor seeking a 6% portfolio return, the most compelling reason to exclude MLPs is the 23% drop since April which has made few people happy. However, looking beyond the undoubted voting by many investors who have abandoned the sector, 7% yields combined with 8-9% growth rates (the cap-weighted forecast on the group of names listed) seems pretty compelling for long-term investors willing to look beyond recent price action and focus on the fundamentals by including MLPs, perhaps even with an overweight, in their portfolios.