Plain Talk, Fuzzy Math
Plains All American (PAA) held their investor day last week. Continued growth in output from the Permian in West Texas is driving new pipeline construction, for which PAA is at the forefront. Limited pipeline capacity has hurt economics for some drillers that have resorted to trucks to move their crude, which is far more expensive.
PAA’s Supply and Logistics (S&L) business thrives on infrastructure constraints, since it allows them to exploit basis differentials using spare capacity on their pipeline network. From 2014-17 S&L EBITDA collapsed by 90%, as spare capacity came online. It has since rebounded to $450MM, around two thirds of its 2014 peak.
One analyst asked about the impact of new pipelines, both on the S&L business (where PAA expects to see EBITDA drop 50% next year) as well as on existing pipelines which face possible cannibalization of demand:
“You’re creating your own weather when you think of the S&L impact…there’s a lot of moving parts here…Loss of marketing, loss of basin flows, loss of potentially some spot barrels on Bridgetex”
Executives wouldn’t be drawn into discussing the impact in more detail, which was a pity because an investor day is supposed to offer an opportunity to dig more deeply into a company’s business. The response was:
“The guidance for this year fully reflects our views of how that impact is…we’ll give guidance later in the year for 2020… I don’t think we’re going to specifically work towards guidance during this meeting today, that’s not the intent.”
This interaction captures the conundrum facing investors. The Shale Revolution’s dramatic increase in oil and gas production isn’t yet profiting midstream infrastructure investors. One reason is fear that the industry will overbuild, pressuring pipeline tariffs and leading to projects that fail to cover their cost of capital.
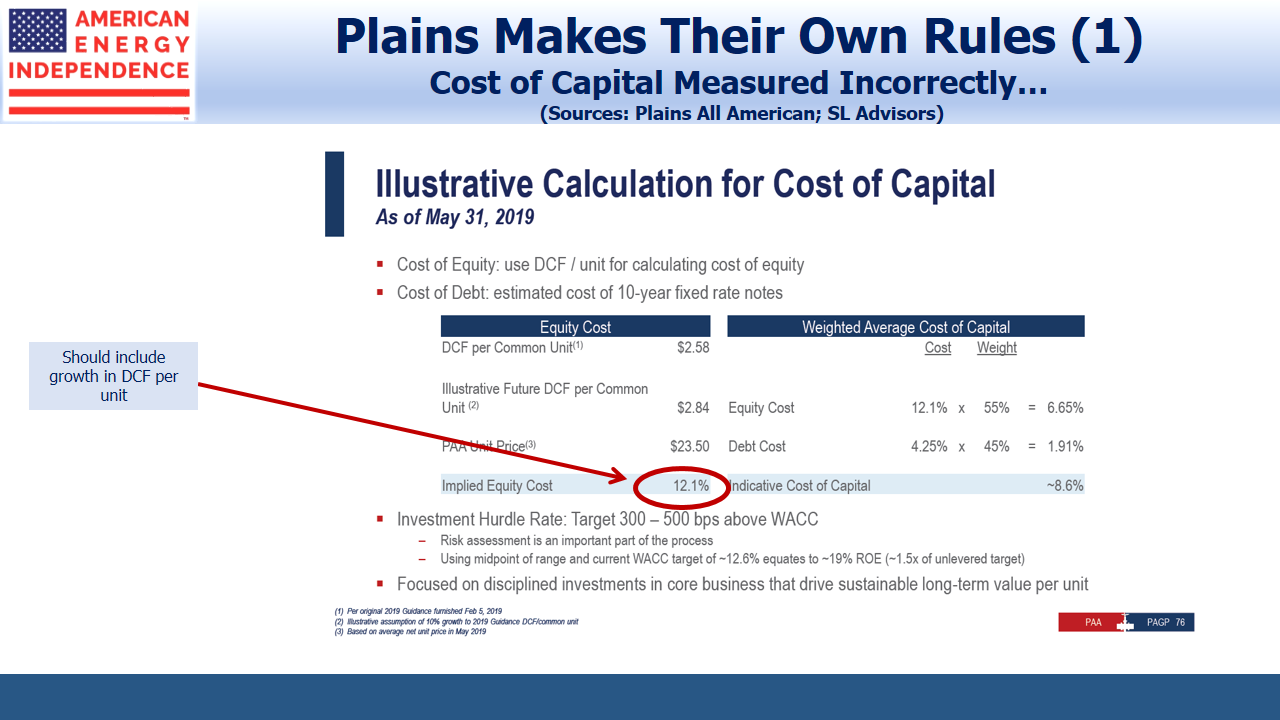
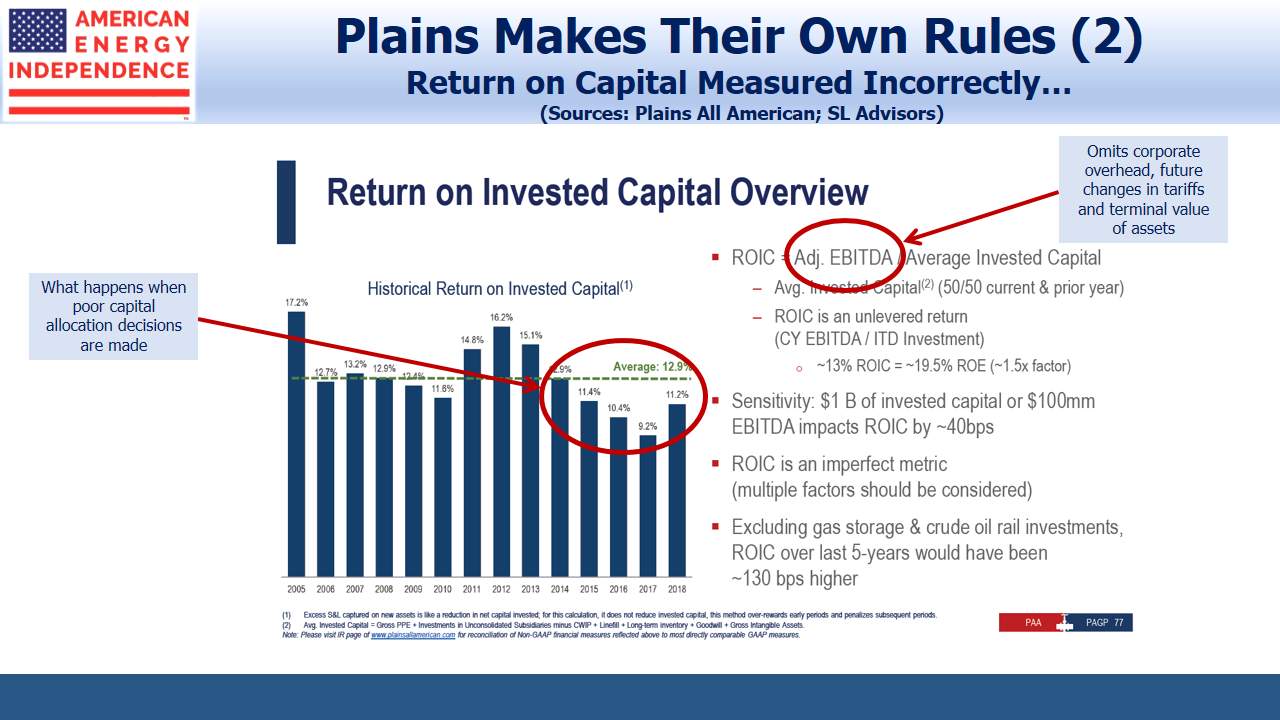
PAA laudably tried to demonstrate financial discipline with two slides illustrating how they think about their cost of capital versus their return on invested capital. For any company, the spread between these two is the main source of profits.
So it was disappointing to see errors and omissions. Distributable Cash Flow (DCF) as a cost of equity was based simply on the current DCF yield without adding anticipated long term growth, though investors are told to expect such growth of 10% this year and presumably further growth beyond.
The problem in using current EBITDA as the basis for assessing projects is that it doesn’t reflect the long term return on assets with years of useful life and fluctuating tariffs. It omits corporate overhead, maintenance, cost for potential delays and cost overruns. Most investors calculate the net present value of cashflows from a proposed investment, discounted using a rate appropriate to the risk.
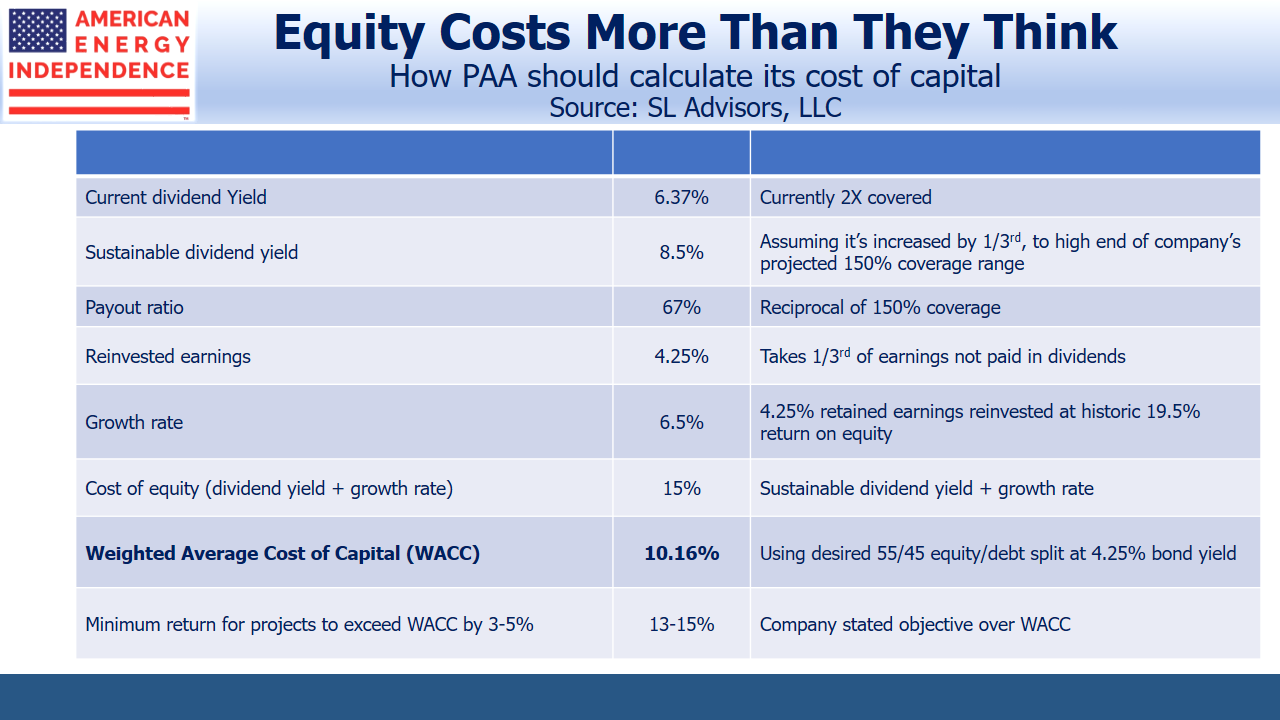
PAA isn’t calculating their cost of equity properly. More correct would be to use the dividend yield plus long term expected growth rate. The growth rate is derived from the portion of retained earnings not paid out (i.e. 1 minus the payout ratio) times the return on equity, which PAA shows has historically been 19.5%.
Although they’re targeting 130-150% coverage of their distribution, it’s currently 2X. Raising the dividend such that it was 150% covered would give them a yield of 8.5% (versus 6.37% currently). 150% coverage equals a 67% payout ratio. 1 minus the payout ratio, or 33%, times their 19.5% ROE, implies a 6.5% growth rate, which should be added to the projected 8.5% dividend yield.
So PAA’s own figures and assumptions suggest their cost of equity is really around 15%, not the 12.1% they presented. PAA’s Weighted Average Cost of Capital (WACC), using their desired 55/45 equity/debt split and with a 4.25% interest rate on their debt, is almost 10.2%, 1.6% higher than they presented.
Since they seek an investment return of 3-5% above their WACC, any project needs a return of 13-15%. Riskier projects need an even higher return than this. The Alpha Crude Connector acquisition failed to meet this hurdle.
This minimum return on new projects is further illustrated through their desired leverage of 3-3.5X Debt:EBITDA. Assuming they continue to finance their investments with 45% debt, anything new must have an EBITDA multiple (i.e. cost of investment divided by EBITDA) of no higher than 7X. 3.25 leverage (the midpoint of their 3-3.5 range) divided by 45% debt share of finance is 7.2, which equates to around 14% (1 divided by 7.2), the midpoint of the required return we calculated based on their WACC.
The 55/45 ratio between equity and debt could be unsustainable if EBITDA falls. For example, a manageable 4X Debt:EBITDA leverage ratio would become an unsustainable 8X if EBITDA later dropped by half. Building in the possibility of lower tariffs in the future means debt should be less than 45% of the capital, which raises the WACC since equity is more expensive.
It’s also why you want to own strategic assets that don’t face huge drop-offs in revenues after initial contracts expire.
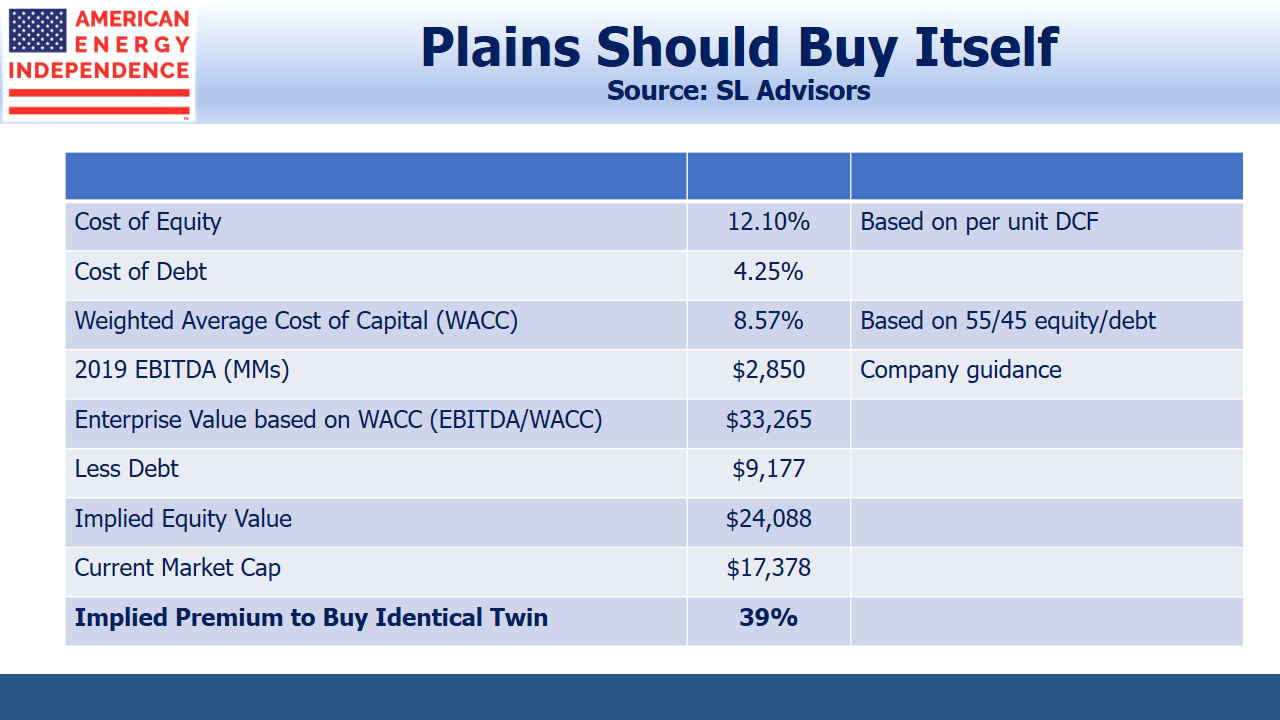
The flaw in PAA’s math can be illustrated by showing that they’d be willing to raise capital at today’s cost to buy an identical enterprise to their own, with identical EBITDA. Using their own cost of capital and 2019 EBITDA, they’d value this twin at over $33BN. Adjusting for debt, the twin’s equity would be worth $24BN, compared with PAA’s current market cap of only $17BN. Their math allows that PAA could pay up to a 39% premium to buy a business identical to what they own before the acquisition would no longer be accretive.
This is why investors are usually unenthusiastic when management teams announce another growth project. PAA, like most of its peers, should be more willing to repurchase shares.
The stock’s poor performance over the past five years is due to poor capital allocation decisions, probably driven by faulty logic such as described here.
No sell-side analyst pointed this out, but the shareholders who have lived it understand the flaws in PAA’ internal investment process.
Meanwhile, PAA is a cheap stock, trading at just 8X cash flows that are growing, assuming management is more prudent with investors’ money than over the past five years. The industry’s fortunes will turn on correctly calculating the spread between cost of, versus the return on, invested capital.
We are invested in PAA, via Plains GP Holdings.
SL Advisors is the sub-advisor to the Catalyst MLP & Infrastructure Fund. To learn more about the Fund, please click here.
SL Advisors is also the advisor to an ETF (USAIETF.com).


