Pipelines Moving Up and Left: More Return With Less Risk
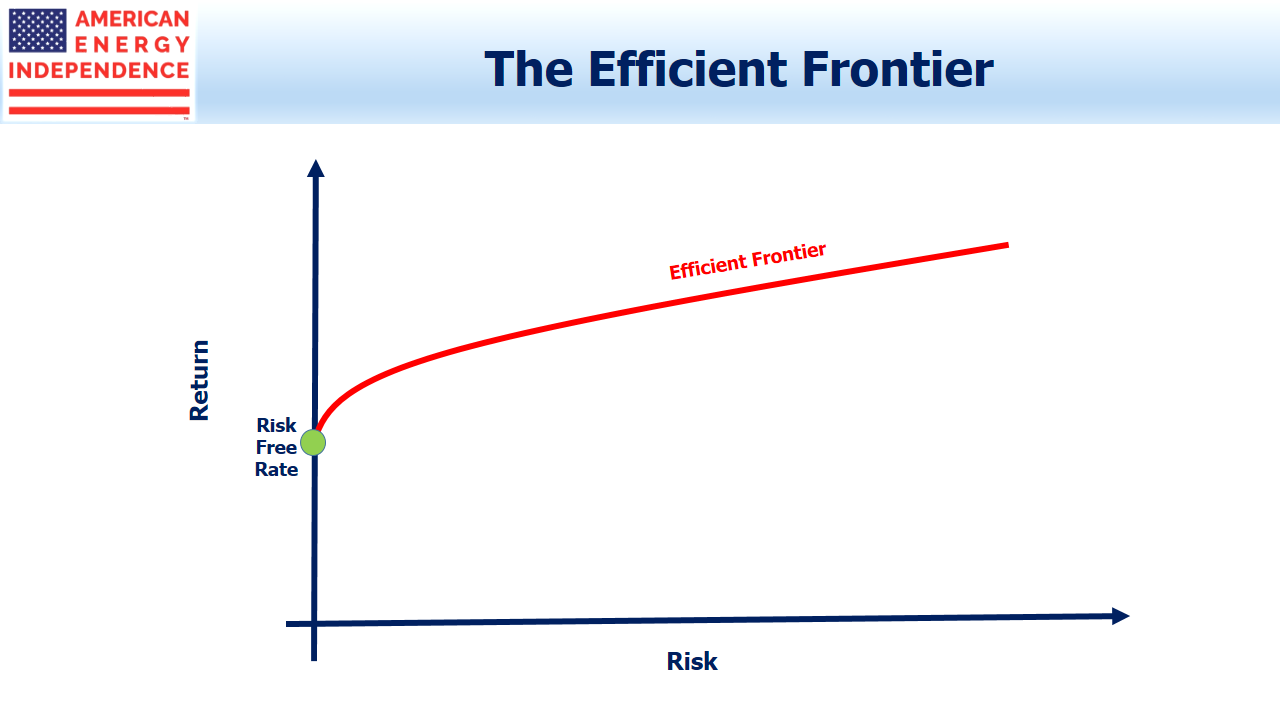
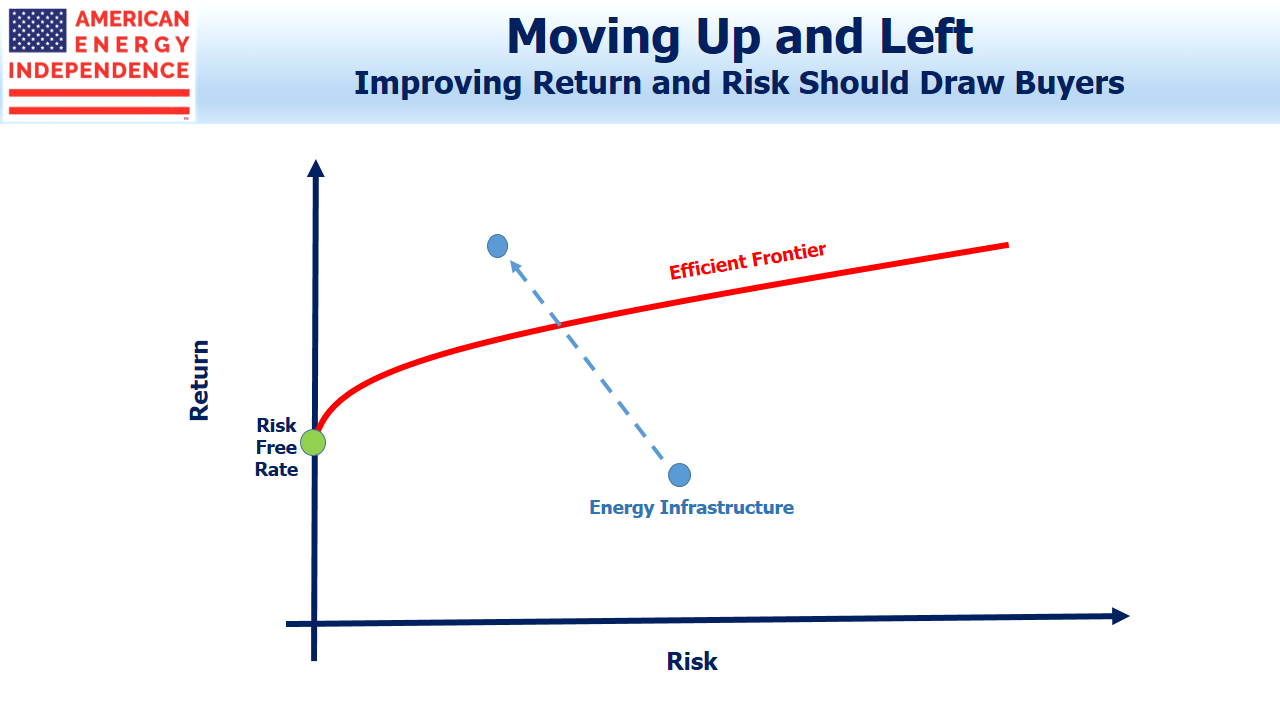
The Capital Asset Pricing Model (CAPM) is a widely accepted theoretical framework for valuing securities. An important feature is the Efficient Frontier. This reflects the concept that, although there’s an almost infinite number of portfolios that an investor can hold (think of all the individual stocks and bonds out there), a small number of these portfolios offer a combination of return and risk that’s better than most.
For example, if two portfolios had the same risk, the one with the higher return would be preferable. We can always figure out with hindsight what was the efficient portfolio — identifying the right one going forward is more difficult.
CAPM is a useful theoretical framework but has its shortcomings. One of the biggest is the idea that more risky investments deliver a higher return. It seems intuitively self-evident, but there’s plenty of research to show it’s not true. Beta, a measure of how risky a stock is compared to the market (which has a Beta of 1.0), suggests that high beta stocks (Beta > 1.0) should deliver higher returns than the market. Otherwise, investors wouldn’t own high beta stocks because they wouldn’t be getting sufficiently compensated for the increased risk.
The real world often fails to conform to neat algebraic solutions, and it turns out that low beta stocks do better. They don’t move as much and offer less excitement. Low Beta stocks receive less coverage on CNBC, since traders want movement. But they are Aesop’s tortoise, reaching the finish line ahead of their more energetic competition.
This weakness in CAPM is called the Low Beta Anomaly, and for those interested in learning more you can read Why the Tortoise Beats the Hare.
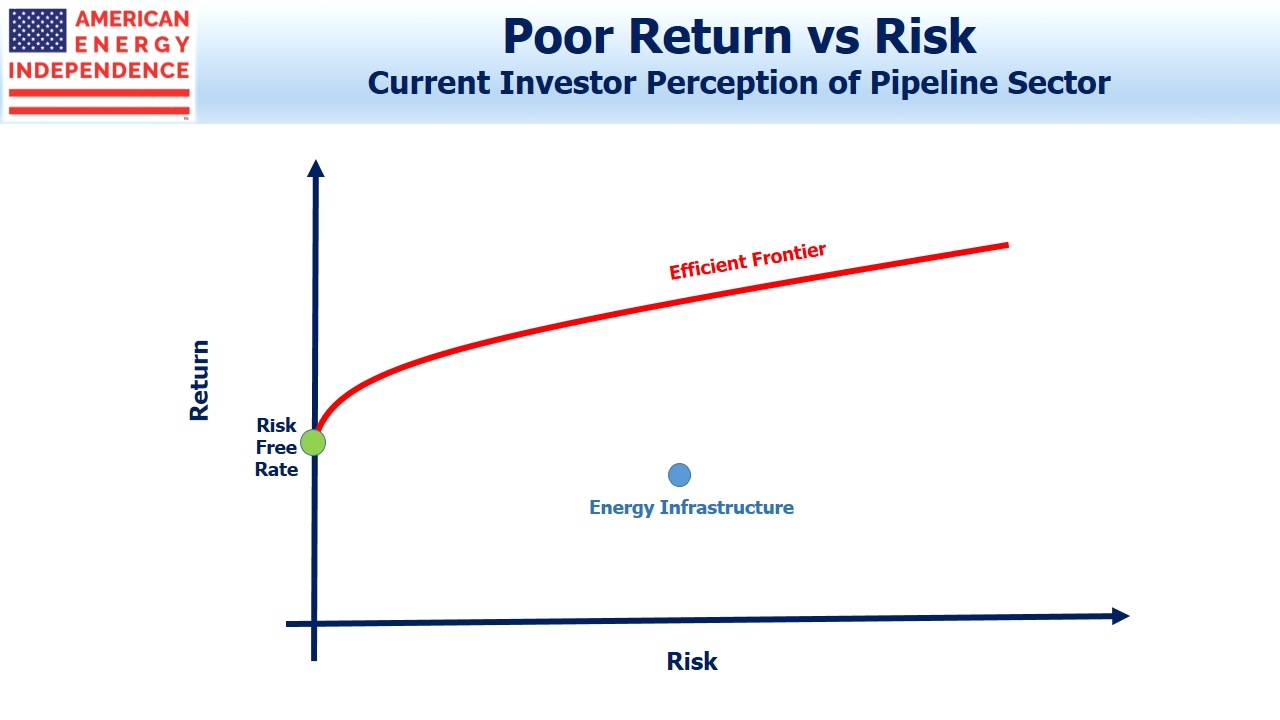
Returning to the Efficient Frontier, although we can’t be certain what investments provide the most CAPM efficiency, we can make informed assumptions about whether they’re becoming more or less attractive within this framework. Investors complain about heightened volatility in midstream, and likely assume more of the same in assessing the sector. For many, Energy infrastructure sits well within the Efficient Frontier boundary, making it unattractive.
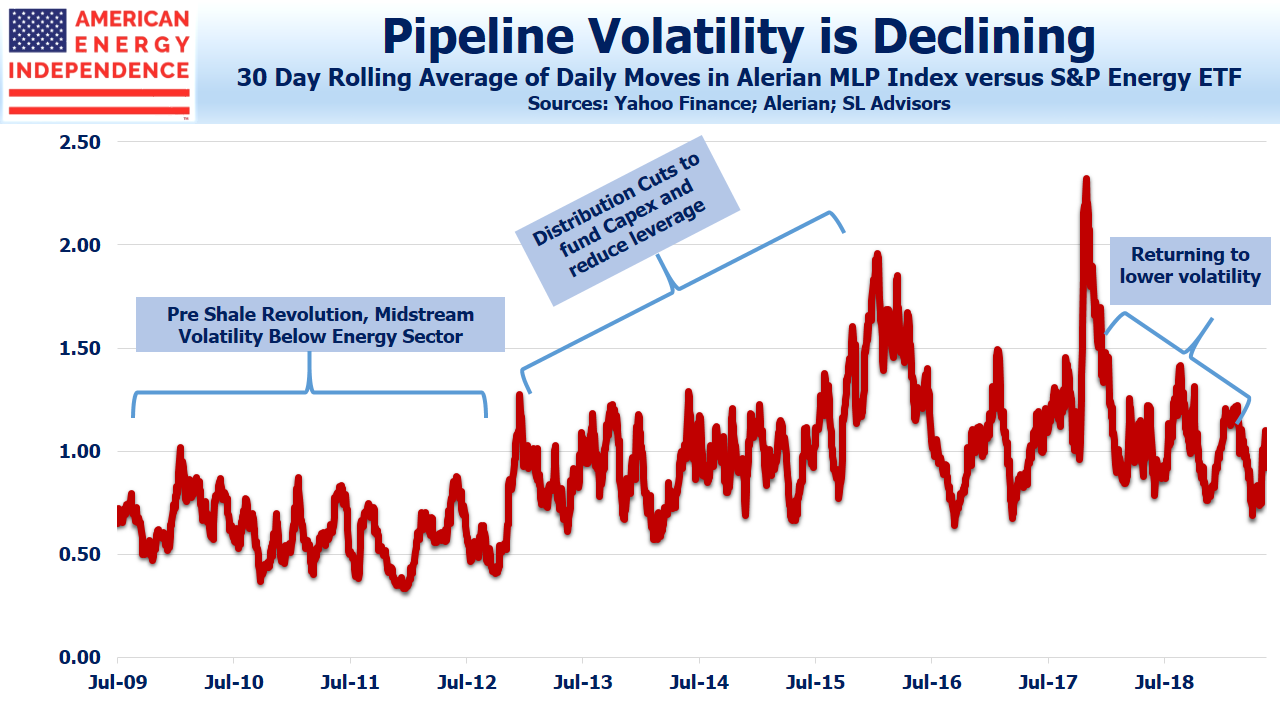
But Energy Infrastructure, as we wrote last week (see Pipeline Stocks Get That Warm Feeling Again), is becoming less volatile, especially when compared with broad energy as represented by the S&P Energy ETF (XLE). On the Efficient Frontier chart, this is moving it to the left, meaning it’s becoming less risky.
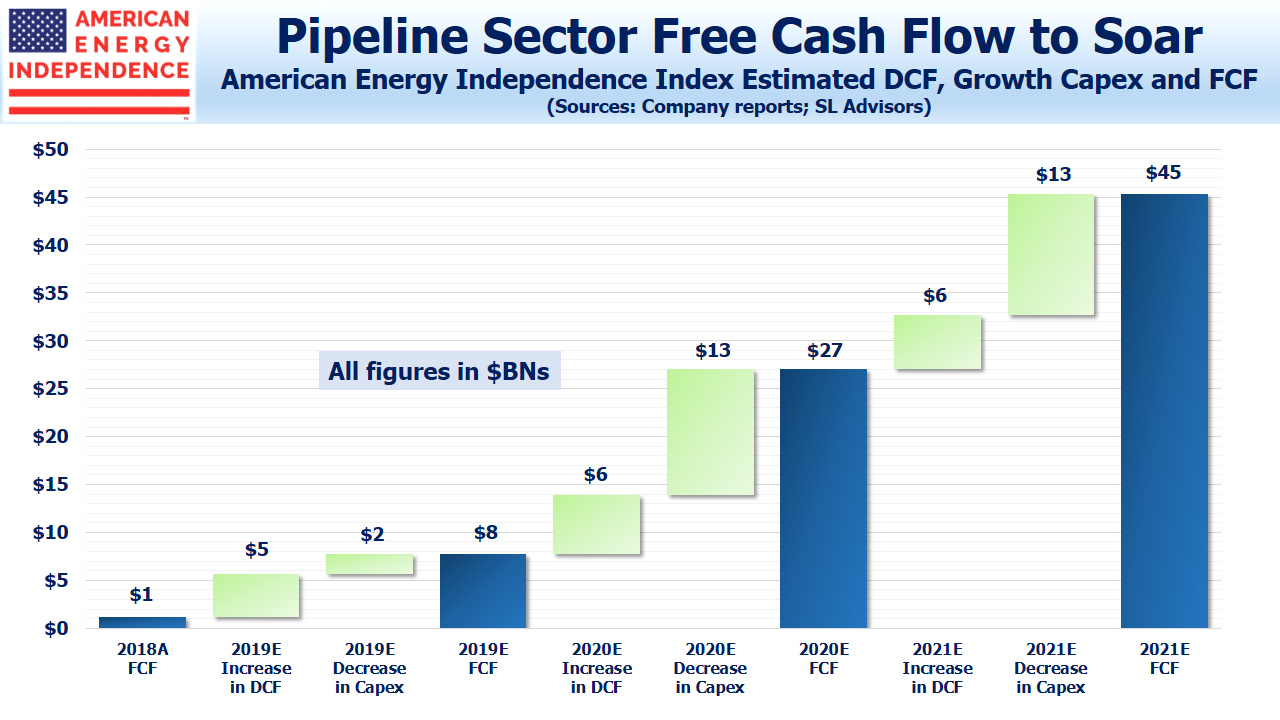
Returns are also improving, as defined by Free Cash Flow (FCF) generation. We wrote about this a few weeks ago (see The Coming Pipeline Cash Gusher). The members of the broad-based American Energy Independence Index generated just $1BN in FCF last year, which is an inconsequential return on around $540BN in market cap. However, a combination of lower spending on new projects (lower growth capex) plus improving cash flow from existing assets (higher Distributable Cash Flow, DCF) is set to boost sector FCF significantly over the next three years. By 2021 the $45BN in FCF we estimate would produce a FCF yield of over 8%, higher than the S&P500.
Making volatility forecasts is an imprecise task, and most investors will be satisfied with using historical data. This shows decreasing volatility, or risk. But it’s certainly possible to make return forecasts and they don’t need to have any relationship with recent history. Rising FCF should persuade investors that their return assumption for the sector can be revised up.
In the context of CAPM, higher return with less risk mean that the sector is shifting up and to the left, making it more attractive. The Efficient Frontier is a theoretical concept, and investments selected from along that line can all be judged efficient, with the different combination of return and risk reflecting investor preference.
As this virtuous combination of rising return with falling volatility becomes apparent, we think some investors will conclude that midstream energy infrastructure lies beyond the Efficient Frontier. This should attract inflows from investors who use this type of framework to assess opportunities.
When CAPM provides a buy signal, the much-sought generalist investor will have finally turned to pipelines. Over the next couple of years, the sector should benefit from this development.
SL Advisors is the sub-advisor to the Catalyst MLP & Infrastructure Fund. To learn more about the Fund, please click here.
SL Advisors is also the advisor to an ETF (USAIETF.com).
