Our Darkening Fiscal Outlook
There are two ways in which our looming fiscal catastrophe draws closer. One is through the passage of time, as entitlements grow with more aging Medicare recipients. The other is through worsening projections from the Congressional Budget Office (CBO).
Both are happening.
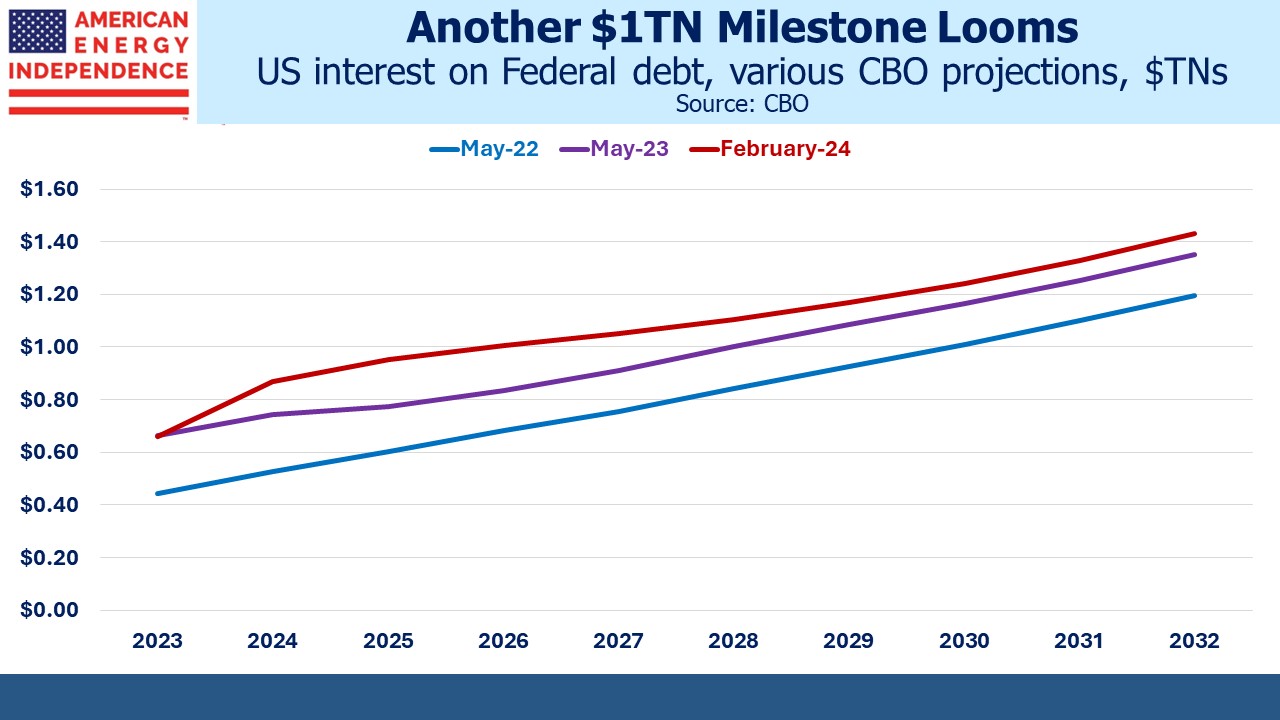
Start with interest expense. In the CBO’s May 2022 ten year Budget and Economic Outlook, this line item was forecast to hit $1TN in 2030, eight years hence. Last May, the CBO brought this date closer by two years, to 2028. And in the February outlook just released it’s now 2026. Since 2022 the $1TN date has gone from eight years out to just two.
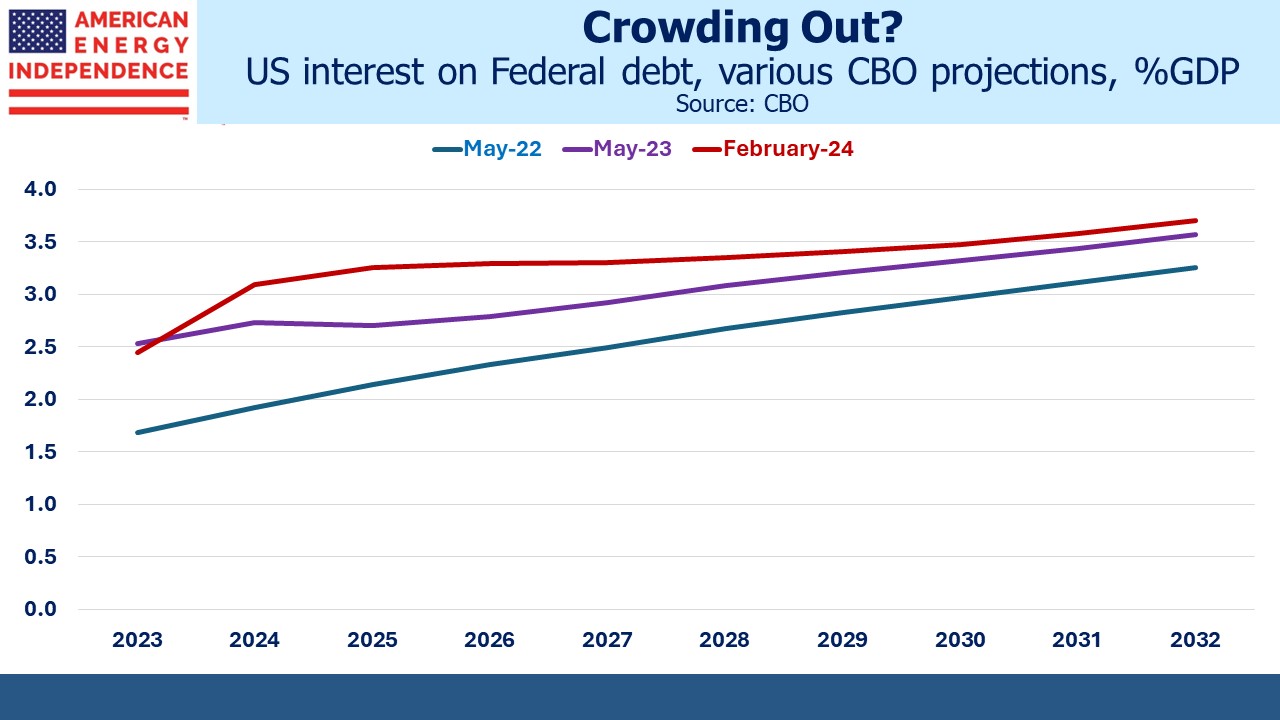
Inflation ran higher than projected in 2022, which also pushed up nominal GDP. But even as a % of GDP, the interest expense figures have worsened. This year we’ll spend 3.1% of GDP on interest, rising to 3.7% in 2032.
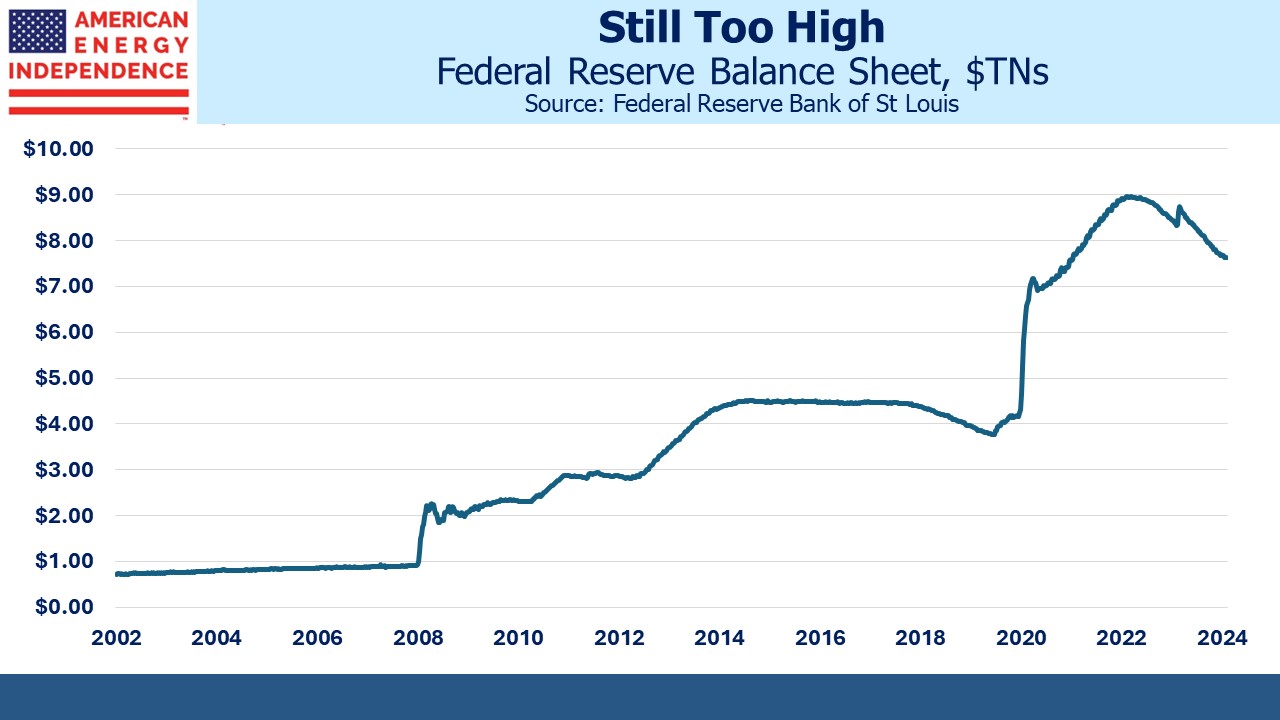
Projections for the Fed’s balance sheet are moving higher as well. Ever since Ben Bernanke unleased Quantitative Easing (QE) during the 2008 Great Financial Crisis (GFC), the Fed has struggled to bring its bond holdings back down to the level that’s needed to operate monetary policy. Fearful of causing a spike in bond yields, they rely on maturing bonds rolling off to shrink their holdings.
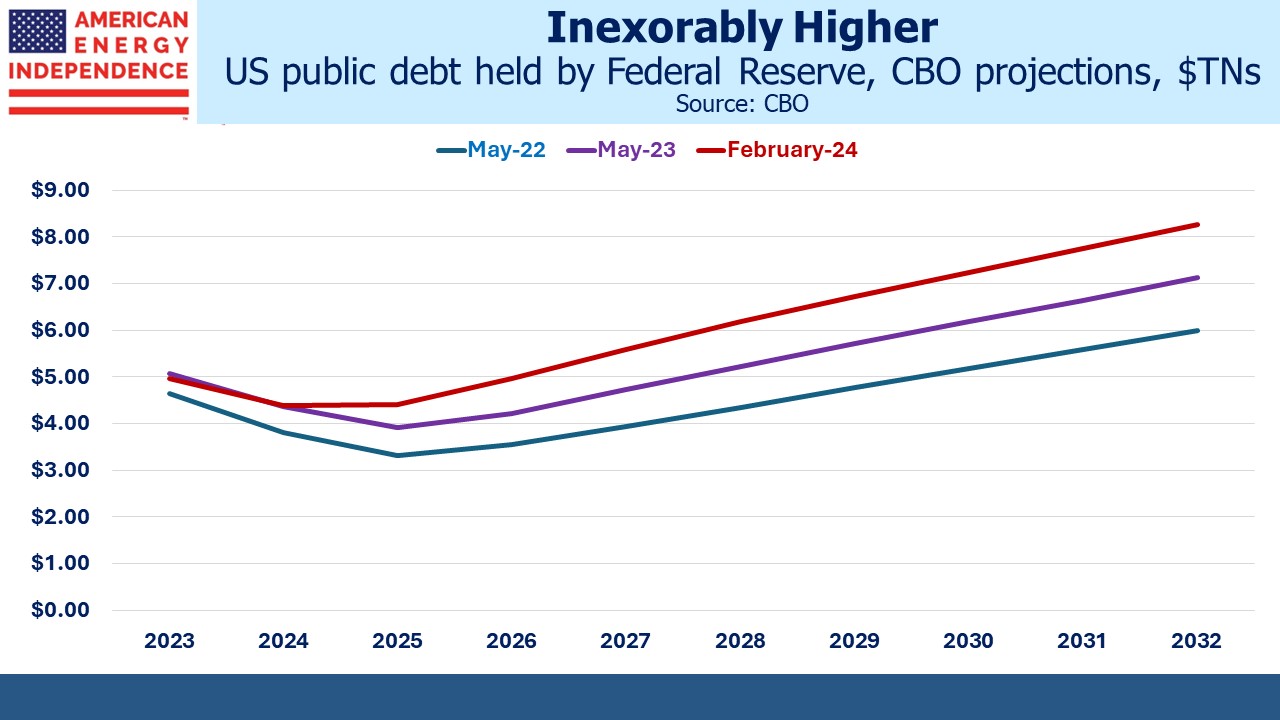
The Fed’s balance sheet is currently $7.7TN, of which $4.7TN is US treasury securities. Most of the balance is Mortgage-Backed Securities (MBS). Two years ago, the CBO expected the Fed’s holdings of US treasuries to drop to $3.3TN by 2025. Now they’re projecting $4.4TN and expect it to be back at $4.7TN by 2026. An excessive balance sheet has become an enduring feature of our monetary policy.
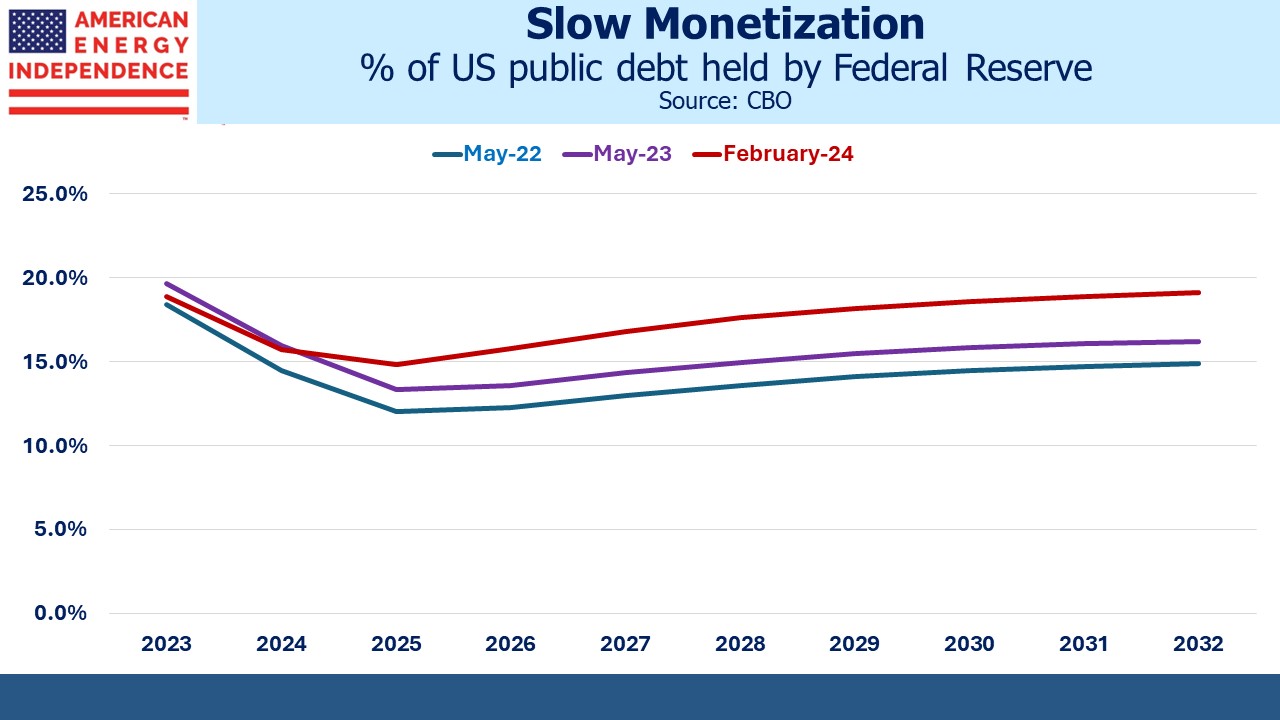
When such holdings become permanent it represents a partial monetization of our debt. Moreover, the Fed’s % of outstanding government debt is now projected to be 19% by 2032, 4% higher than the CBO was forecasting a couple of years ago.
The CBO doesn’t forecast MBS holdings, but virtually all these securities have an average life greater than ten years. Prepayments will knock this down, but MBS has also become a permanent item on the Fed’s balance sheet.
The CBO assumes real GDP growth of 2.0% pa. Recessions are usually unexpected and forecasting them is hard. But when the next one occurs, ample fiscal stimulus will be part of the solution and inevitably the Fed will feel compelled to start QE again.
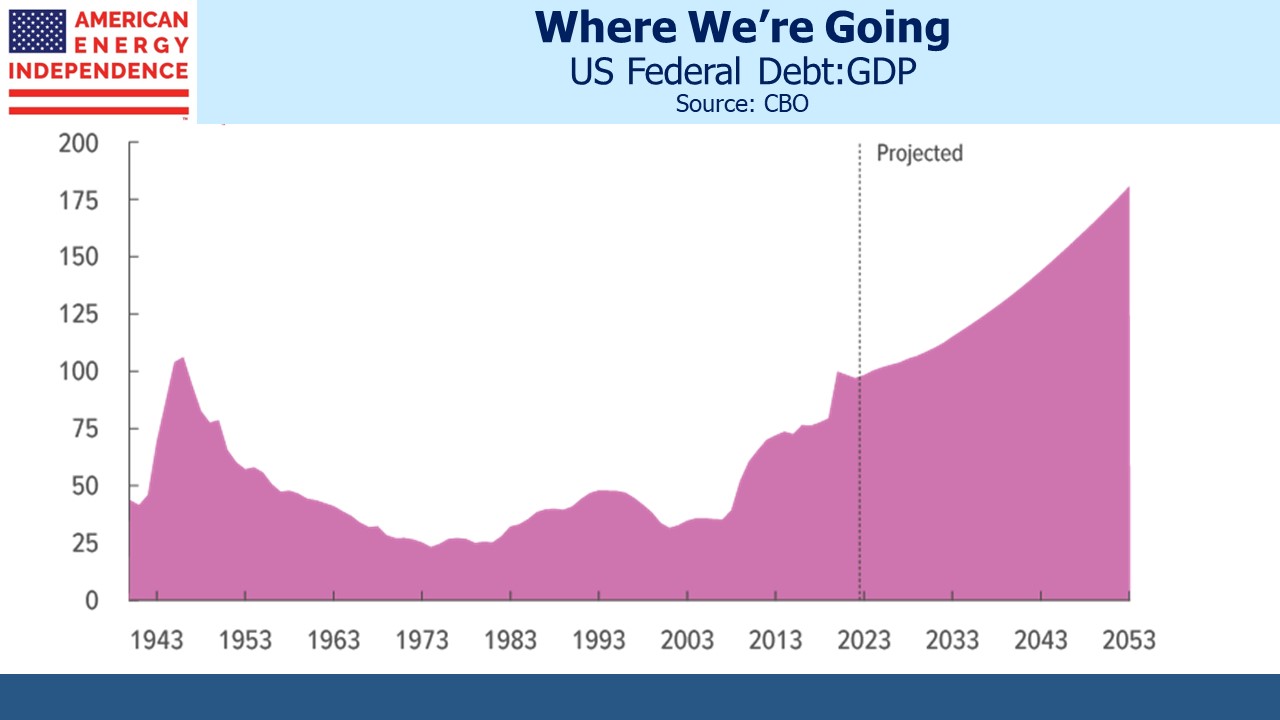
The only good thing about our deteriorating fiscal outlook is that the perennially forecast day of reckoning hasn’t come. We’re still muddling along. We’re about to head up the steep path into unknown territory as shown in the last chart.
Federal debt held by the public will reach 99% this year and is headed higher. However, when adjusted by Federal financial assets and debt held by the Federal Reserve it’s 75%. Japan’s equivalent figure is 119%.
Japan’s defining economic challenge over the past couple of decades has been deflation. GDP growth averaged less than 0.5% pa over the past decade. Many economists blame this partly on their high levels of government debt.
It’s unlikely an extended period of anemic growth would be politically acceptable in the US. The depression of the 1930s defines American economic policy, in that every president is expected to preside over economic growth. Germany’s equivalent is avoiding a repeat of the inflation of the 1930s under the Weimar Republic that led to Hitler’s ascent.
Japanese voters have accepted mediocre GDP growth far longer than would be the case in the US. If excessive US debt led to Japanese-style deflation here, fiscal stimulus and QE would quickly follow.
How this issue resolves itself is of great importance to the long term investor. QE depresses long term yields and impedes the Fed in its ability to constrain growth when inflation is above target. Barry Knapp of Ironsides Macroeconomics regularly warns about the harm to profitability of all but the biggest US banks caused by the persistent inversion of the 3 Month/10 Year portion of the yield curve. Loans priced off the long end of the treasury curve don’t yield enough to generate acceptable profits for banks whose marginal cost of wholesale funding is close to the Fed Funds rate.
And yet US economic growth remains strong with unemployment low. An unintended consequence of QE is the pressure the Fed’s bond holdings put on regional bank profitability by keeping yields low. It also probably means they need tighter monetary policy than would otherwise be the case at the short end, since long-term yields aren’t that restrictive.
Inflation expectations are the likely casualty rather than GDP growth. Eventually our excessive debt along with increasing debt monetization will cause slow but steady currency debasement, the time-honored refuge of profligate governments. We believe owning infrastructure and other real assets is how investors should position themselves.
We have three have funds that seek to profit from this environment:
