Natural Gas Demand Still Stable
Crude oil drew the headlines this week. Trump’s Wednesday tweet forecasting a 10 Million Barrel per Day (MMB/D) agreed supply reduction (“Could be as high as 15 Million Barrels”) caught markets off guard. The demand collapse is astonishing. The world was consuming around 100 MMB/D of crude oil and liquids before the coronavirus. Estimates are for a 20-25% drop in April. Every producer is feeling the financial pain, which ought to concentrate minds as OPEC holds an emergency video meeting on Monday.
Natural gas demand is both more regional and more stable. Some midstream energy infrastructure companies, such as Williams (WMB) and Cheniere (LNG) are entirely natural gas focused, even though their stock prices move with energy sentiment. Crude moves the S&P Energy ETF (XLE), of which they are components, so their stock prices follow.
U.S. natural gas production is heavily influenced by domestic prices. Although in recent years we’ve become a net exporter, over 90% of output is consumed domestically. Given the collapse in global crude demand, we’re interested in domestic natural gas demand.
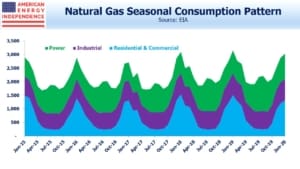
The seasons dominate. Winter is the peak period as households and commercial buildings need heat. The power sector uses more in the summer as electricity demand rises for air conditioning. The chart shows the monthly pattern.
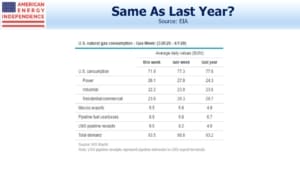
The Energy Information Administration (EIA) releases weekly data, which can provide a clue about how demand is being affected by the shut down’s effect on the economy.
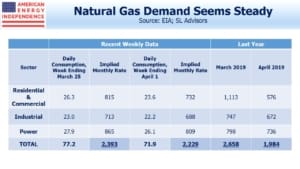
We’ve taken the last two weeks, which cover late March to April 1. Since consumption is typically falling this time of year, a sequential weekly drop is normal. Multiplying by 31/7 to get the monthly rate, those two weeks are running at 2,393 Billion Cubic Feet (BCF) and 2,229 BCF respectively. These two figures sit comfortably between last year’s March total of 2,658 BCF and April’s 1,984 BCF.
Looking a little more closely, power demand is stronger than a year ago, continuing a trend of natural gas substituting for coal. And lower crude production will also mean less associated natural gas output from areas like the Permian, which will benefit those drillers focused on pure-play natural gas.
There’s no historical precedent for what we’re experiencing, and it wouldn’t be surprising to see natural gas consumption falling even after adjusting for the seasonals. So far, that doesn’t seem to be happening which supports the encouraging updates provided by natural gas oriented pipeline corporations.
We are invested in WMB and LNG.


