Miscounting America’s Crude
Wednesday’s report on crude oil stocks from the Energy Information Administration (EIA) showed a sharp jump in storage of 1 million barrels per day (MMB/D). Given the already fragile mood around tariffs slowing GDP growth, crude oil prices predictably slumped.
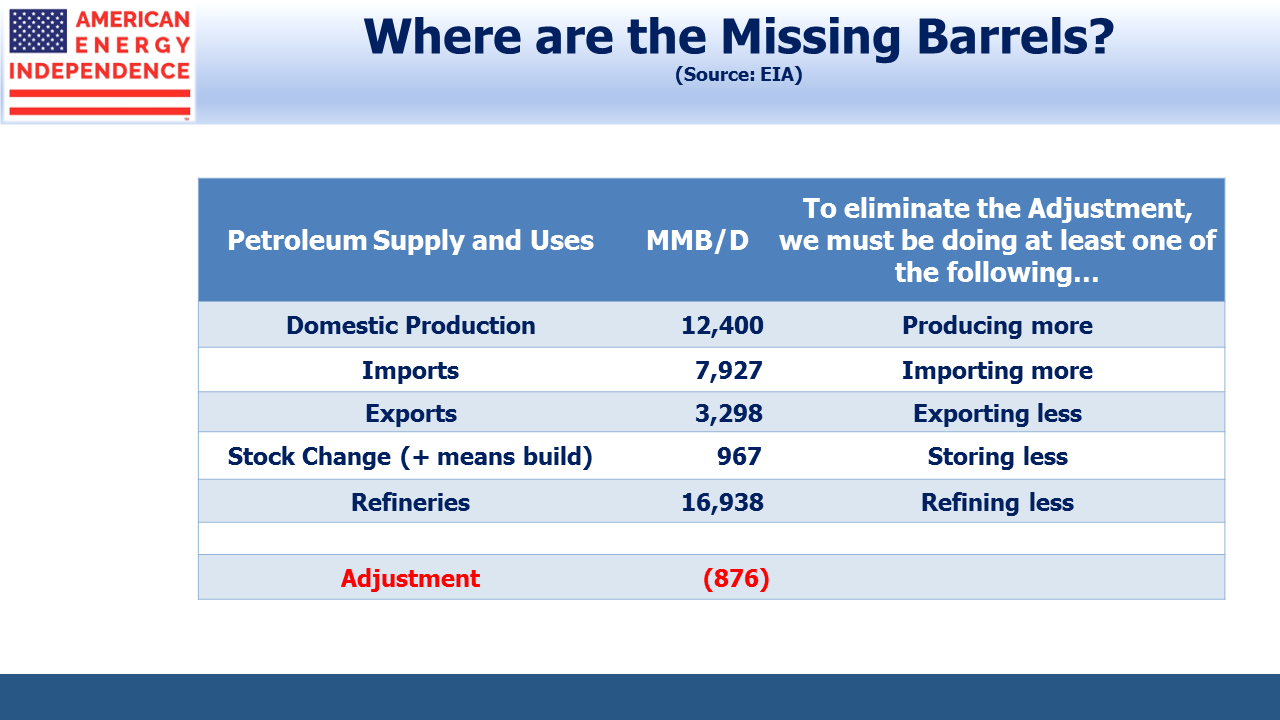
Interestingly though, over the past year the “Adjustment”, or fudge factor which is used to make the numbers add up, has grown substantially.
In simple terms, the EIA counts production, exports, imports, change in storage and refinery usage. This should pick up every barrel of oil moving through the U.S. It must frustrate the EIA’s number crunchers that the figures never foot, so they use a balancing item which used to be called “Unaccounted for Crude Oil”, nowadays simply the Adjustment. Since June 2018, the Adjustment has almost tripled.
Over the past year, crude oil used by U.S. refineries has been stable. Because much of America’s increased production is light crude from the Permian ill-suited to domestic refineries, imports have also remained unchanged. Higher exports have absorbed most of the increase in output.
The Adjustment exists solely because one of the other figures is wrong. So we’re refining more, exporting more, importing less, storing less or producing more than reported. Of these five different items, some should be easier to measure than others. The refinery figure seems unlikely to be far wrong; refineries must know what they’re using and there are 135 refineries in the U.S. from which to gather information.
Similarly, imports must surely be correct since the government licenses imports, and counting exports would also seem reasonably straightforward – the number of points of exports (cross-border pipelines and crude-loading export facilities) are known and not that numerous.
However, in reviewing the EIA’s methodology for calculating exports, they rely heavily on data from the U.S. Customs Border Protection (CBP) as well as figures from Statistics Canada (since exports to Canada don’t require a U.S. export license). The EIA runs the data through estimation models that they believe improve its accuracy. In some cases they’re using monthly data, even though their report is weekly.
There are many types of petroleum product beyond crude oil, including finished motor gasoline, kerosene, distillate and residual fuel oil among others. And the granting of an export license need not coincide with the physical shipment of the product. So it’s a more complex task than you might suppose.
Storage would also seem straightforward. Storage terminals are hard to miss. So the 967 thousand barrels per day (MB/D) build in storage ought to be reliable. Since the prior week saw a 41 MB/D decrease in storage, crude traders inferred softening demand.
But storage has its own complexity, since crude oil sitting on a tanker awaiting unloading is, in effect, floating storage. A possibility suggested by one sell-side firm is that floating storage was drawn down sharply. This presumes that several million barrels of crude was in tankers bobbing within U.S. territorial waters, already counted as imported but not yet unloaded. If true, this would mean the apparent jump in onshore storage was offset by a drawdown in floating storage, making the report far less bearish.
While this could explain the sudden, one-time shift in the storage figure, the Adjustment was the same last week, which undercuts the logic behind this explanation.
This brings us back to production, currently estimated at 12.4 MMB/D. Of the line items in the EIA’s report, it seems to us that this one is most plausibly the source of the growing Adjustment. There are around a million wells in the U.S. producing crude oil, from some decades old dribbling out a few barrels a day to new Permian wells producing 10 MB/D or more. We think it’s likely that the EIA is somehow undercounting crude oil output.
Flaring of associated natural gas in the Permian recently hit 661 million cubic feet per day (MMCF/D), up sharply from the previous high late last year of 450 MMCF/D. This reflects growing crude oil production. The continued shortage of take away infrastructure in the region to handle the natural gas that is extracted with the crude oil is why there’s more flaring.
Nobody really knows why the EIA’s weekly report includes an error term that is growing embarrassingly large. Robert Merriam, director of the office of petroleum and biofuels statistics at the EIA, admitted, “There’s something more systematic going on that our surveys aren’t capturing. We have some theories on what that may be and we’re trying to look into it.”
Undercounting crude oil production seems the most likely explanation. If so, this would reinforce a couple of important themes:
1) The U.S. continues to gain market share in world energy markets
2) Growing volumes even with moderate pricing defy those who argue that much of our shale activity is unprofitable
Oil and gas production continue to surprise to the upside, which can only be good for midstream energy infrastructure.
SL Advisors is the sub-advisor to the Catalyst MLP & Infrastructure Fund. To learn more about the Fund, please click here.
SL Advisors is also the advisor to an ETF (USAIETF.com).
