Midstream Is Better Under Trump 2.0
Now that we’re more than six months into Trump 2.0, comparisons with Trump 1.0 are spreading. For energy investors, Trump’s first term was a huge disappointment compared with the high expectations held by many when he took office. A year ago, as investors pondered the impact of a Kamala Harris presidency, we were often asked if we worried about a progressive in the White House.
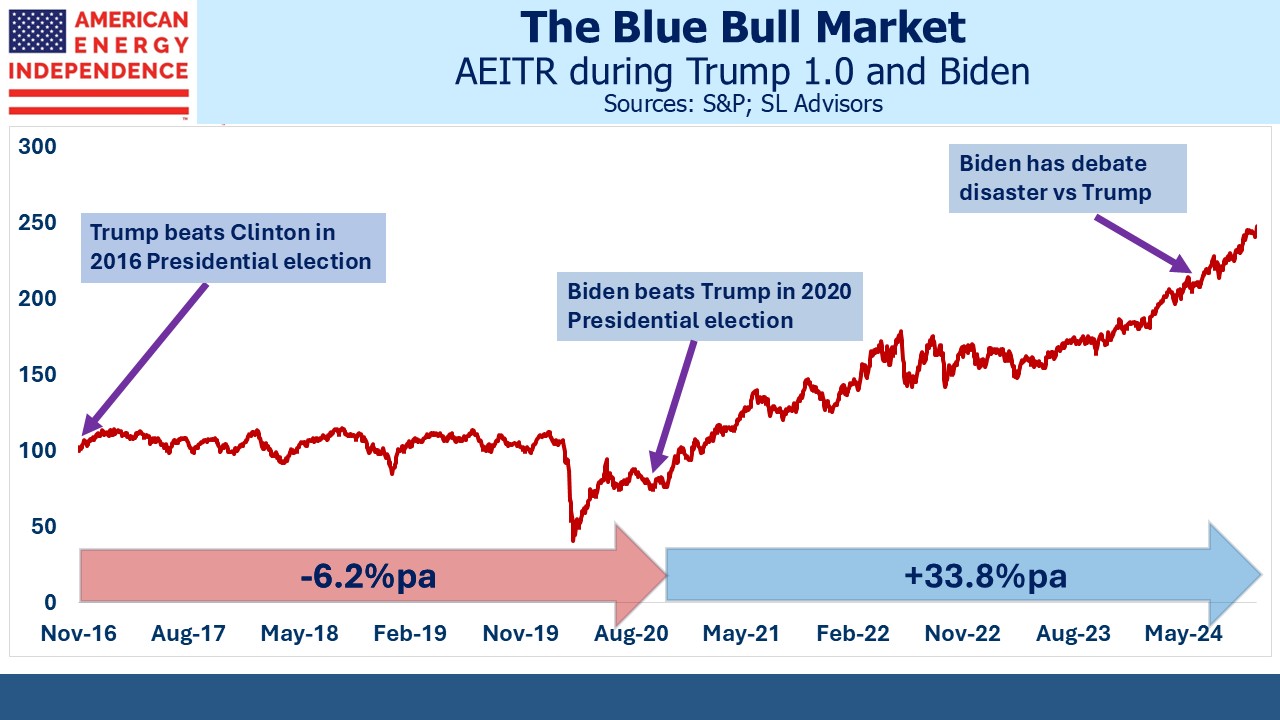
In fact, Joe Biden’s presidency was far better for energy investors. His antipathy towards hydrocarbons fostered cautious capex among energy executives, a sharp contrast with the exuberant spending plans that accompanied Trump’s 2016 victory. Trump 1.0 led to overinvestment and weak prices, compounded by the demand destruction of pandemic lockdowns. Financial discipline returned during Biden.
The result was a –6.2% annual return under Trump 1.0 and a +33.8% annual return under Biden. Left wing policies inadvertently enriched traditional energy investors. However, following Biden’s debate disaster on June 27, 2024 the midstream sector continued its strong performance when polls shifted towards Trump.
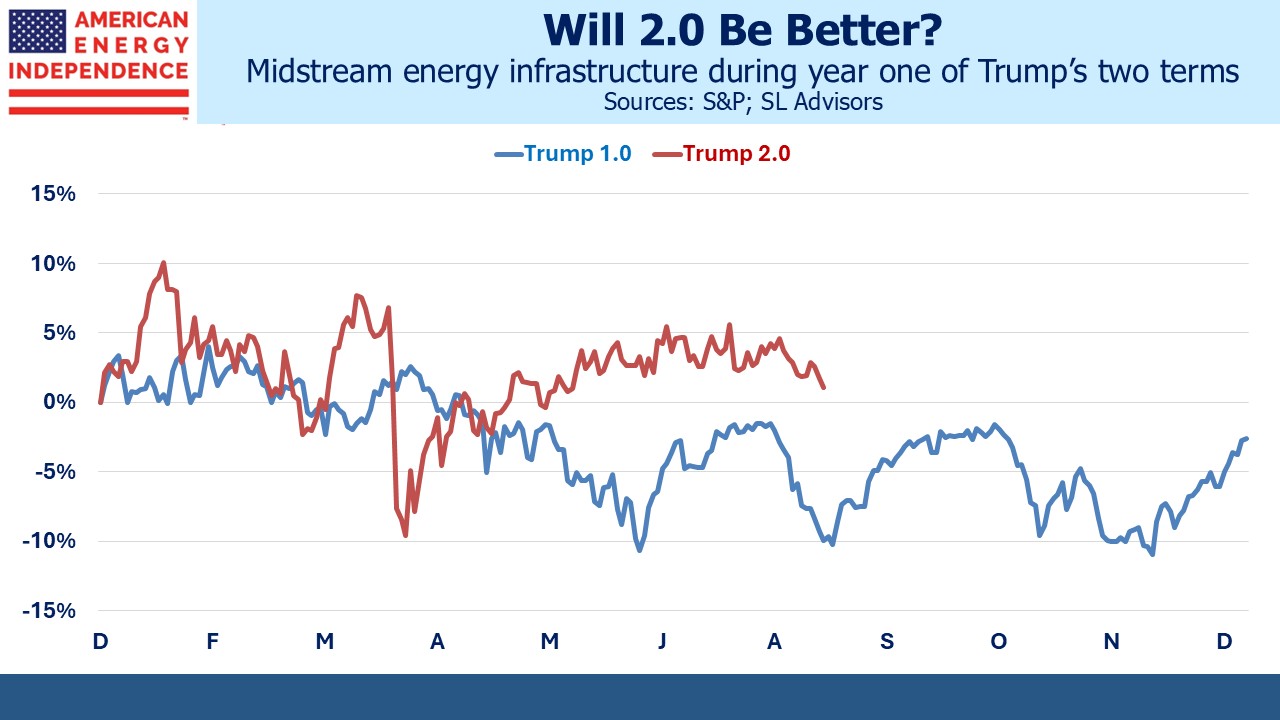
Trump 2.0 has been better for energy investors than before but more volatile. A regulatory environment that once again is supportive of hydrocarbons has helped, and companies have been more cautious about spending. Oil and gas prices have fallen this year as the new administration has made clear its desire for increased production. The president’s love for hydrocarbons favors volumes over profits.
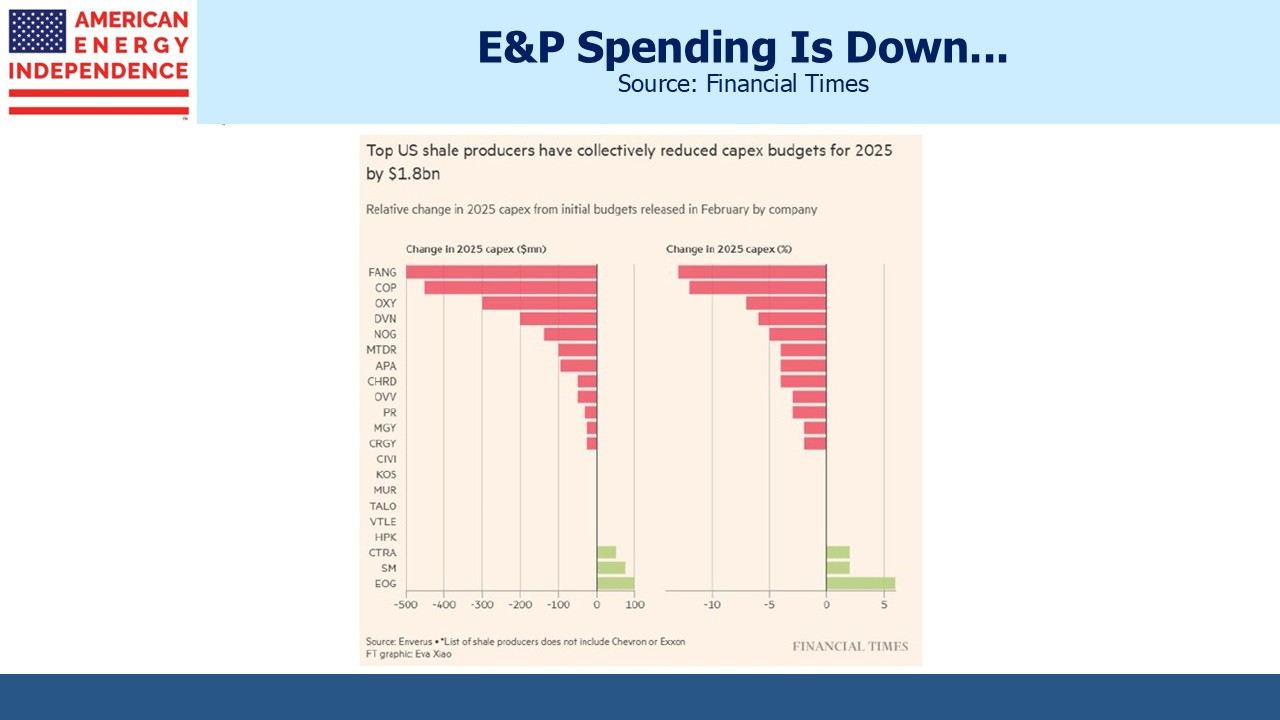
Energy executives are being more cautious than eight years ago, and the top US shale producers have mostly been cutting capex as both oil and gas prices have remained under pressure. OPEC+ is abandoning their production cuts and Trump’s efforts to negotiate peace in Ukraine are regarded as likely to bring more Russian energy exports onto the market.
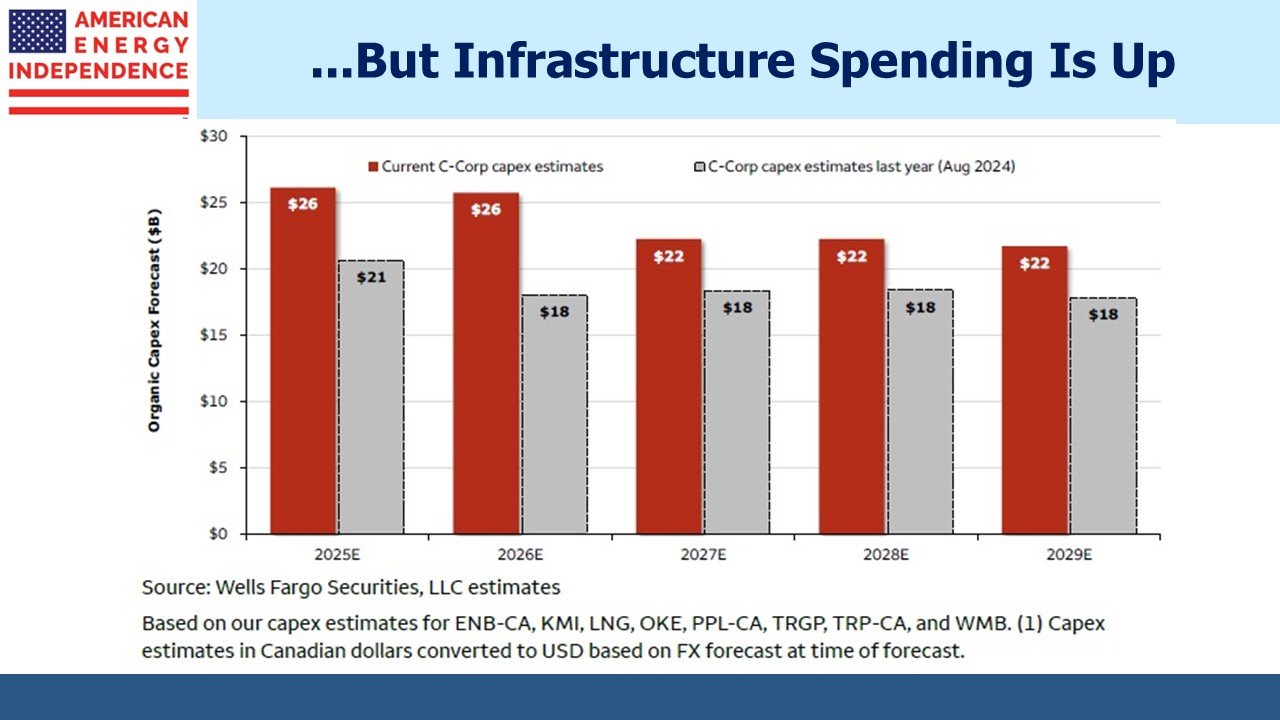
By contrast, midstream companies have been increasing their planned spending, with the biggest c-corps in the sector raising 2026 capex by 44% compared with plans a year ago.
The difference is oil versus gas. Growth in electricity demand for new data centers and additional feedstock for new LNG export capacity are the twin drivers of natural gas growth. Today’s data centers will tolerate only 3 seconds of downtime a year (i.e. 99.99999% uptime) which makes intermittent renewables a poor choice. Natural gas power plants are usually the best choice, which will drive the share of our electricity derived from gas above its current 43%.
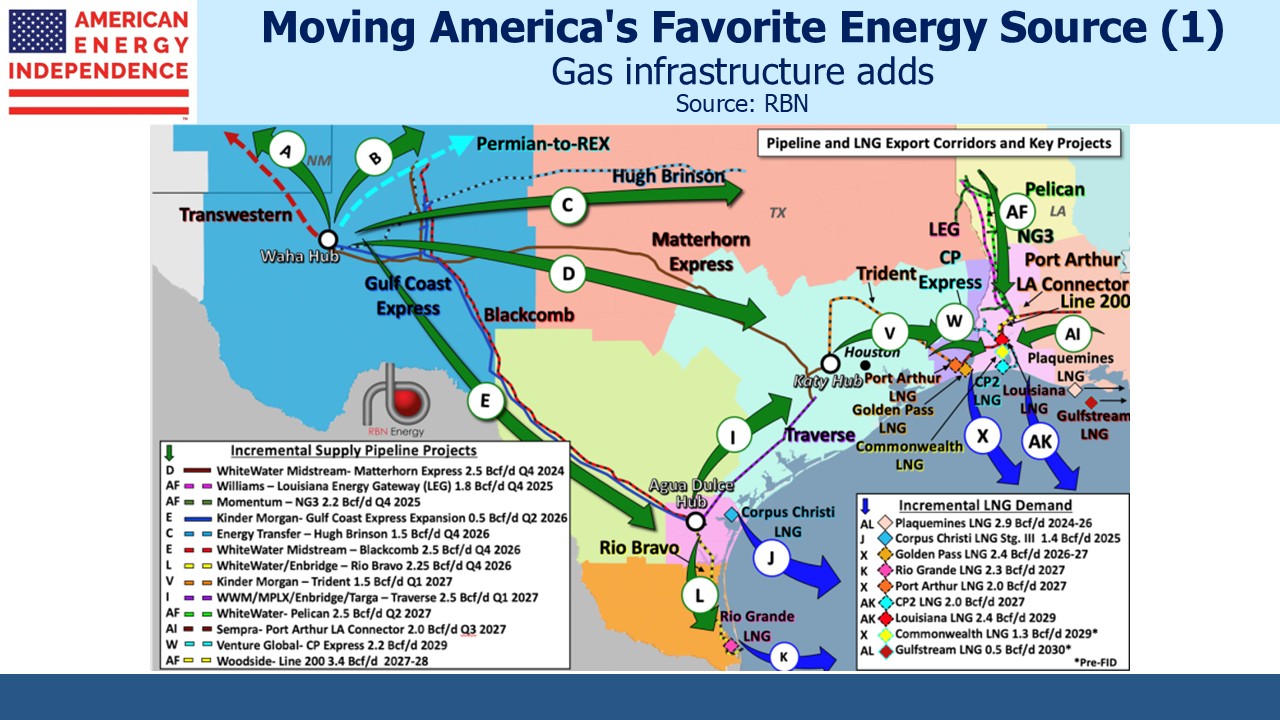
Much of the new activity is centered in Texas. Gas pipelines are being built to connect with new data centers and to feed into the growing LNG export capacity. The map from RBNEnergy shows how much energy infrastructure is being added in Texas and the Gulf coast.
Takeaway capacity for gas is being added in the Permian in west Texas. Oil wells in that region also produce “associated gas”, which means it’s not what they’re drilling for but comes out of the ground anyway. Even though E&P companies have been trimming their budgets, mature wells become gassier as they mature, so gas production won’t be as affected by reduced capex.
LNG export capacity continues to grow – most recently Venture Global announced Final Investment Decision for Phase 1 of CP2 LNG, a $15BN project that is expected to become operational in 2027.
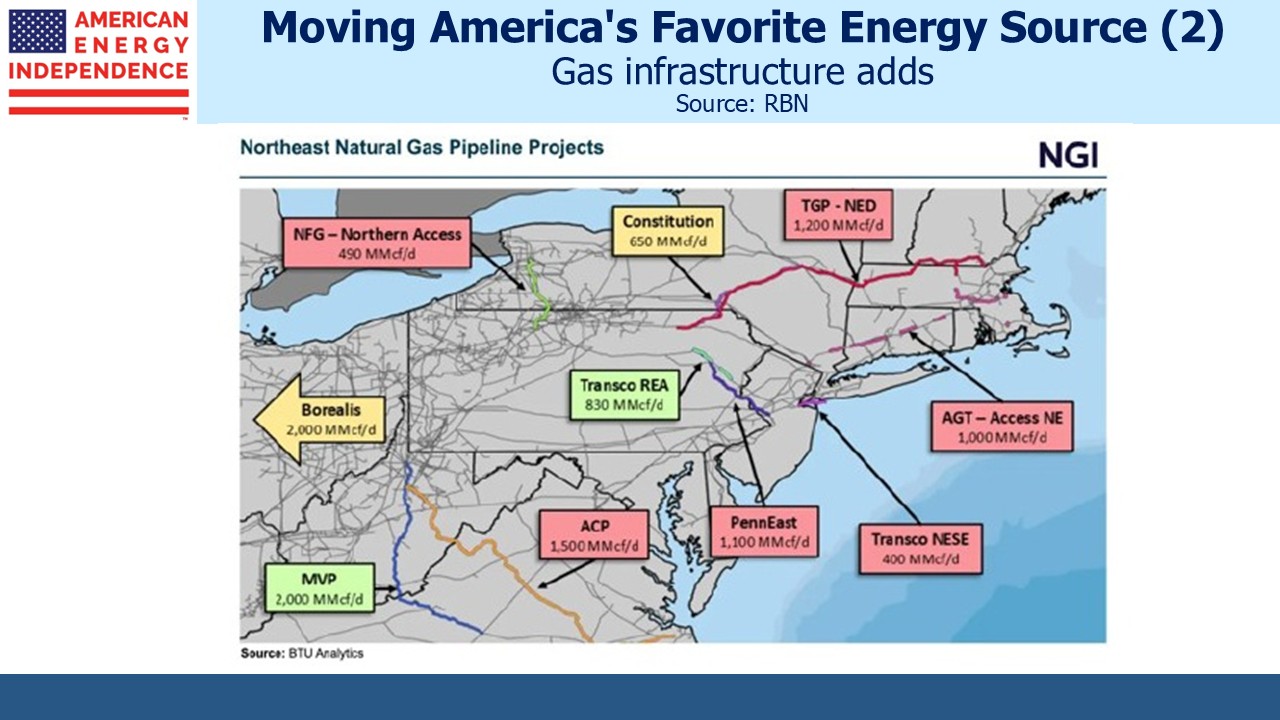
There’s also increased activity in the northeast centered around gas production in the Marcellus shale.
Some may identify parallels with 2016 when the energy sector geared up for more production and throughput, pulling back as investors soured on growth that wasn’t accretive. The big difference today is that long term commitments are underpinning both the new LNG terminals and the additional gas pipeline capacity.
Leverage of 3-3.5X Debt:EBITDA is lower than the 4-5X that was more common eight years ago. Kinder Morgan’s credit rating was recently upgraded by Fitch based on their expectation that leverage would remain below 4.0X.
2Q25 earnings across the sector generally came in as expected with no great surprises.
Many years ago pipelines were organized as Master Limited Partnerships (MLPs), free from corporate taxes in exchange for complicated tax reporting for those wealthy US investors so inclined. As most of them converted to a conventional corporate structure (“c-corps”), they accepted a corporate tax liability in exchange for accessing a broader investor base.
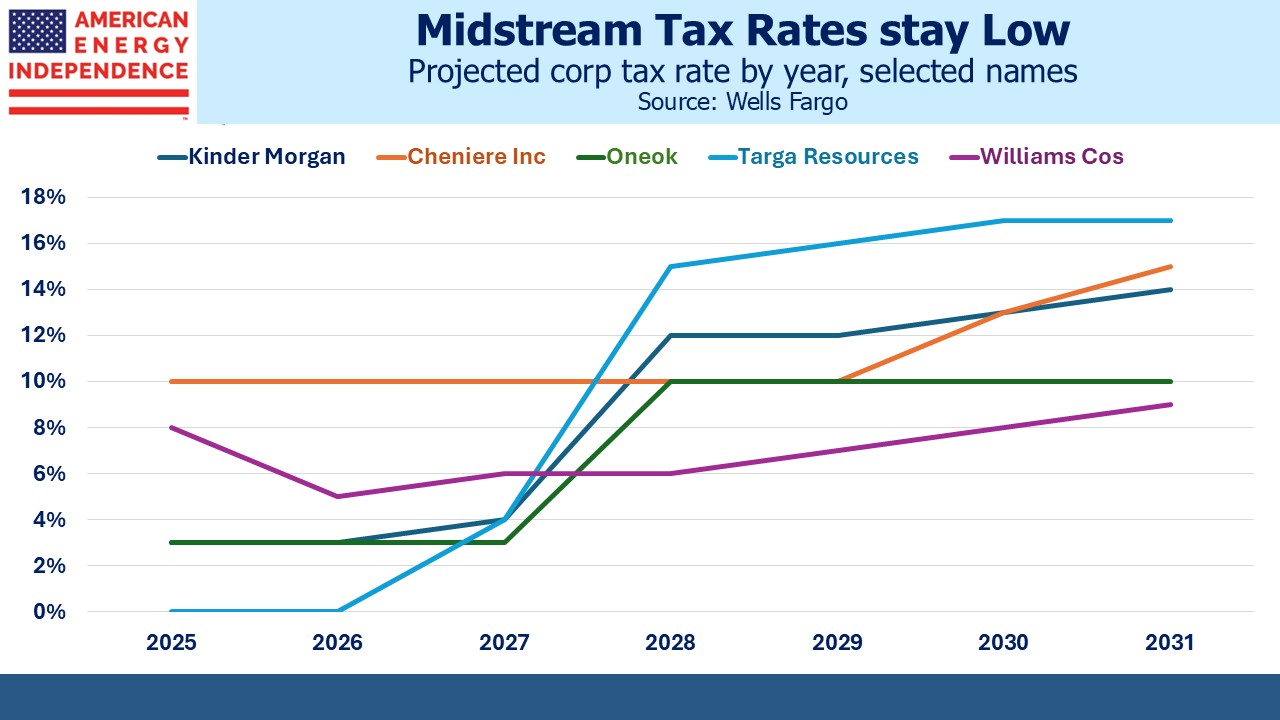
Helped by depreciation rules that understate the true useful life of their assets, taxes have remained low. For the selected US c-corps in the chart, their average estimated tax rate this year is only 5%. It’s not expected to increase meaningfully until 2028 and compares favorably with the average tax rate paid by S&P500 companies of 25%.
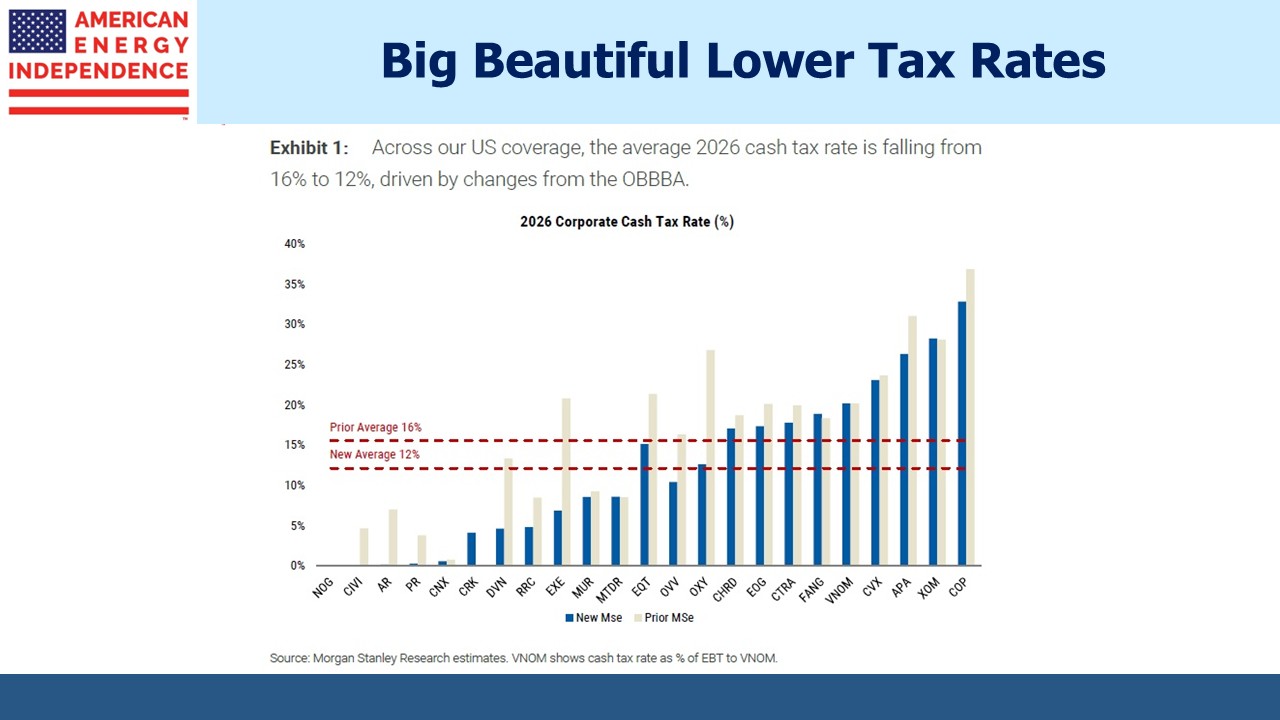
The One Big Beautiful Bill (OBBA) cut rates by an average of 4% for E&P companies and likely had a similar effect on midstream as well. Weak energy prices may have weighed on the sector this year, but at least tax policy is allowing investors to retain more of the profits.
It’s another reason we think midstream energy infrastructure offers attractive prospects.
We have two have funds that seek to profit from this environment:
