What Matters More, Price or Volumes?
If you talk to investors about U.S. energy infrastructure, you’re pretty soon going to get to crude oil. A view on one is seemingly predicated on the other. Some investors mutter darkly about assertions in years back that Master Limited Partnerships (MLPs) are a toll-like business model with limited sensitivity to commodities. Although it remains largely accurate, such talk is rarely heard nowadays because it’s so at odds with recent market history. Fee-based cashflows and a pipeline network that is 93% non-crude oil (natural gas is a more frequent pipeline user) don’t sway people. So here are some charts and numbers to help.
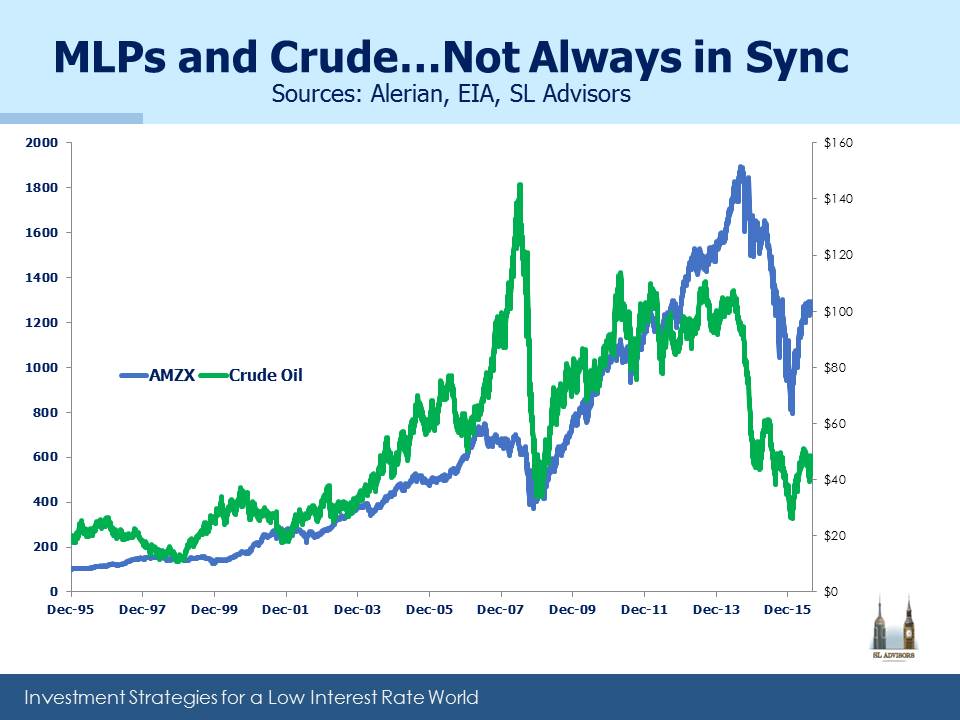
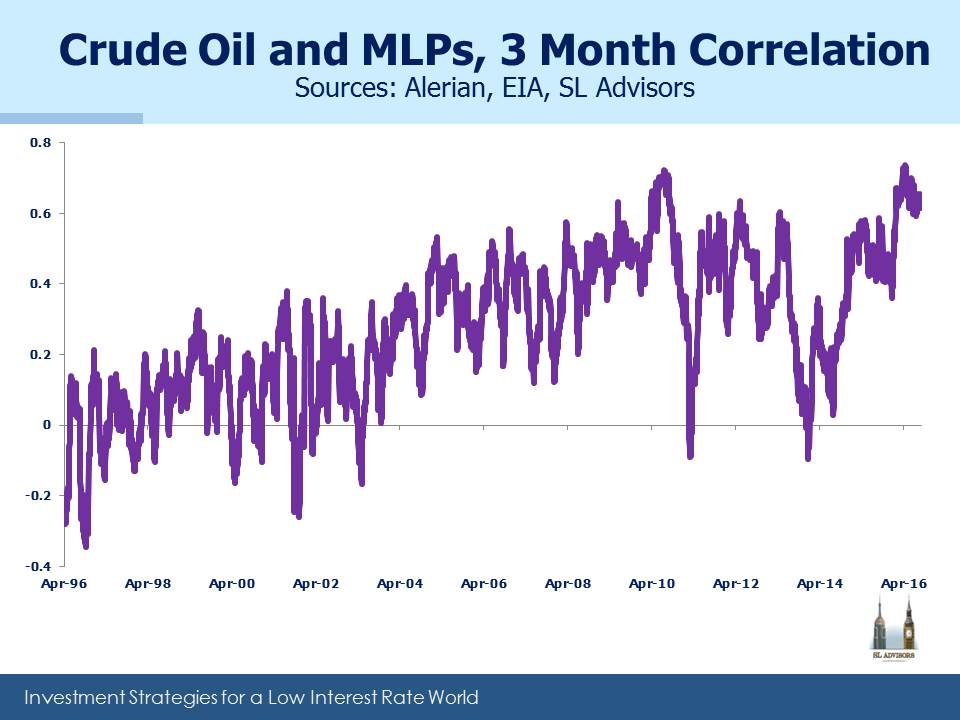
Visually, MLPs and crude have had strong and weak relationships. We’re currently in a period of high correlation, because part of the MLP story relates to volume growth versus infrastructure capacity. Natural gas prices and MLPs have no statistical connection.
As we noted in MLP Investors Digest Supply, getting granular involves forecasting hydrocarbon output versus take-away capacity. The chart below on the Permian Basin illustrates.
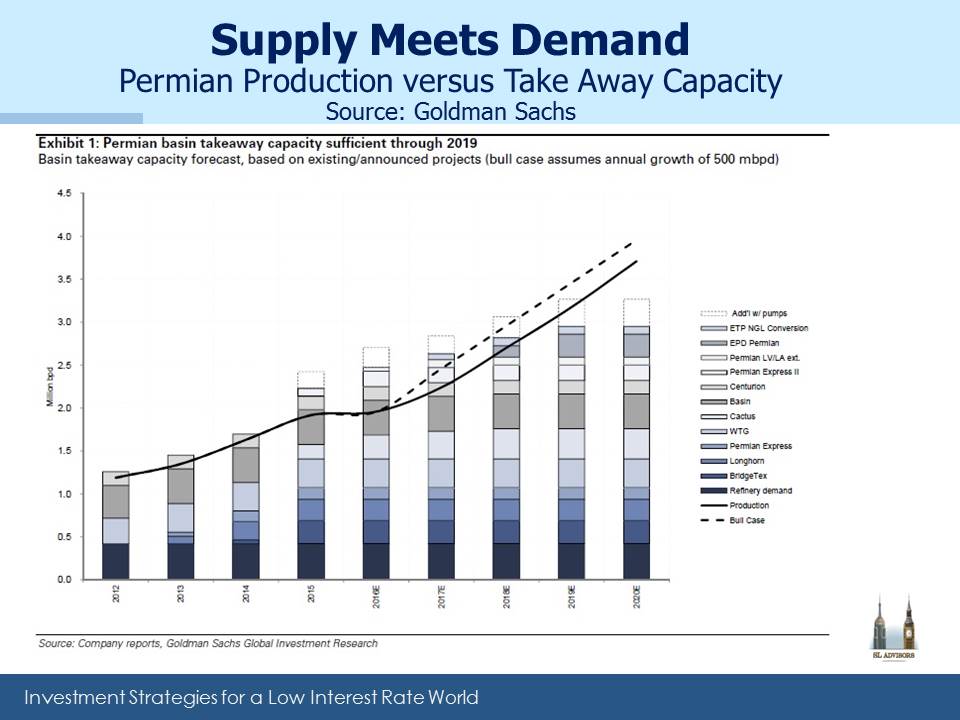
Crude oil production and the means to transport it away are both expected to grow. Exploration and Production (E&P) companies co-ordinate closely with infrastructure providers to match oil supply with take-away capacity. An E&P company with no ability to get its output in a pipeline network is no happier than the owner of an empty pipe. Future Gathering and Processing take-away capacity has more visibility than does future output, but both sides are trying to match expectations. And of course there are many players of all sizes, which makes it a complex dance. If you own infrastructure in the region you want output to grow faster than expected, increasing demand for your scarce resource. Higher oil prices make this more likely. Hence, some sensitivity between crude oil and MLPs makes sense, although not to the degree seen recently.
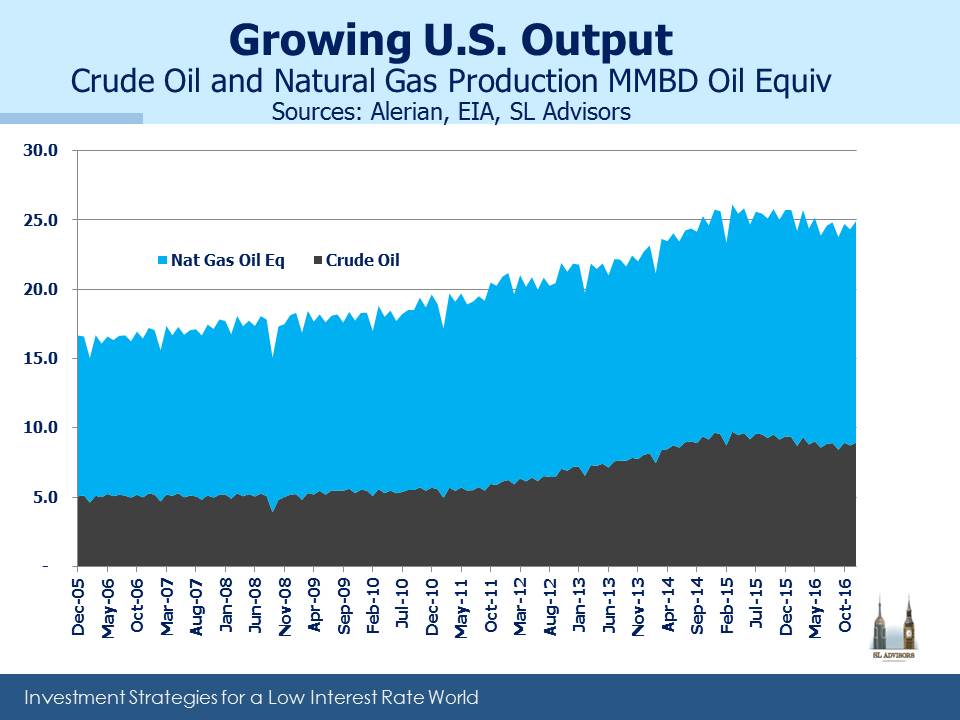
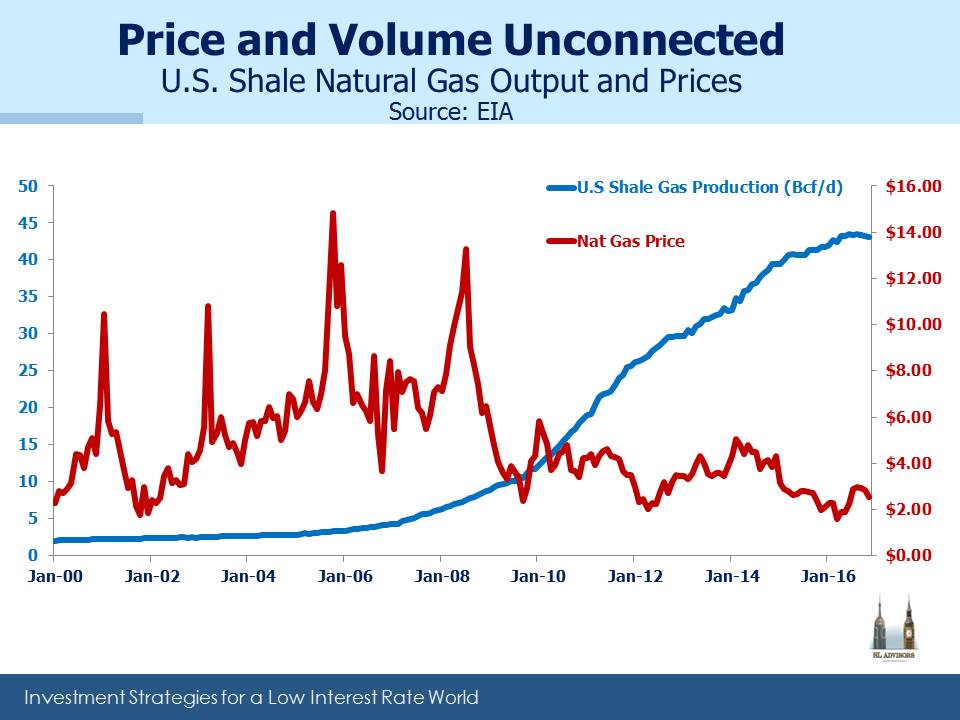
Over the last decade, U.S. crude oil and natural gas output have steadily increased, with a modest pullback in 2015-16. The above chart also shows that on an energy equivalent basis we produce almost twice as much natural gas as crude oil, which is why we often note that U.S. energy infrastructure is more of a natural gas story. As the chart below shows, natural gas production has expanded rapidly, seemingly oblivious to steadily declining prices. Dramatic improvements in efficiency are the reason, and the same thing is happening with shale production of oil.
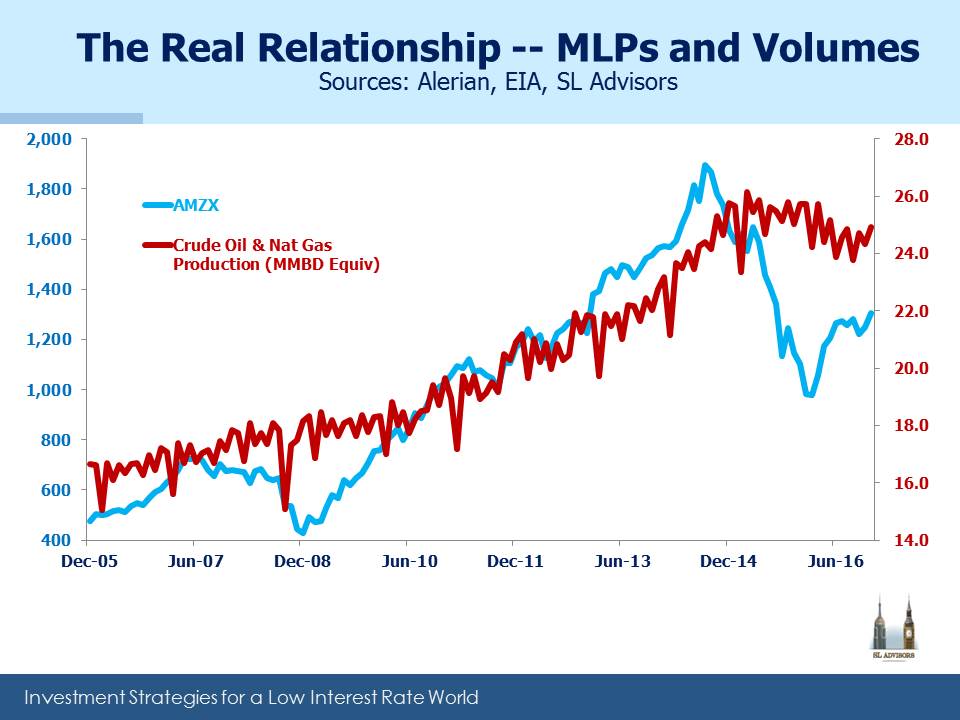
Higher volumes have driven the need for more infrastructure and growth for MLPs. This is the more important relationship, and as the chart below shows, volumes have tracked MLPs better than prices. So a positive view on MLPs today rests on a forecast of continued growth in output. On Friday the weekly Baker Hughes U.S. rig count leapt by 21 to 789, up from 476 a year ago. The continued increase following the drop in crude prices shows that the domestic energy industry is less worried about falling oil than MLP investors seem to be.
Forecasting prices is difficult, but steadily higher volumes over time look like a much safer bet. As we noted last week in Shale Upends Conventional Thinking, demand for short-cycle projects is causing a shift in capex to the U.S. because that’s where a lot of those projects are. Long-cycle projects whose capital recycling extends out beyond the liquidity of the futures market (two-three years) are a bet on prices. That’s far more risky nowadays following last year’s collapse in crude pricing. The Energy Information Administration’s recent Annual Energy Outlook 2017 forecasts steadily rising crude oil production and continued near 4% annual growth in natural gas output. Crude prices matter in the short term, but over the long term volumes will drive returns.