What Kinder Morgan Tells Us About MLPs
Kinder Morgan (KMI) reported earnings last week, including a long expected dividend hike and a pleasantly surprising stock buyback. In many ways the stock performance and corporate finance moves of KMI reflect the Master Limited Partnership (MLP) sector as a whole.
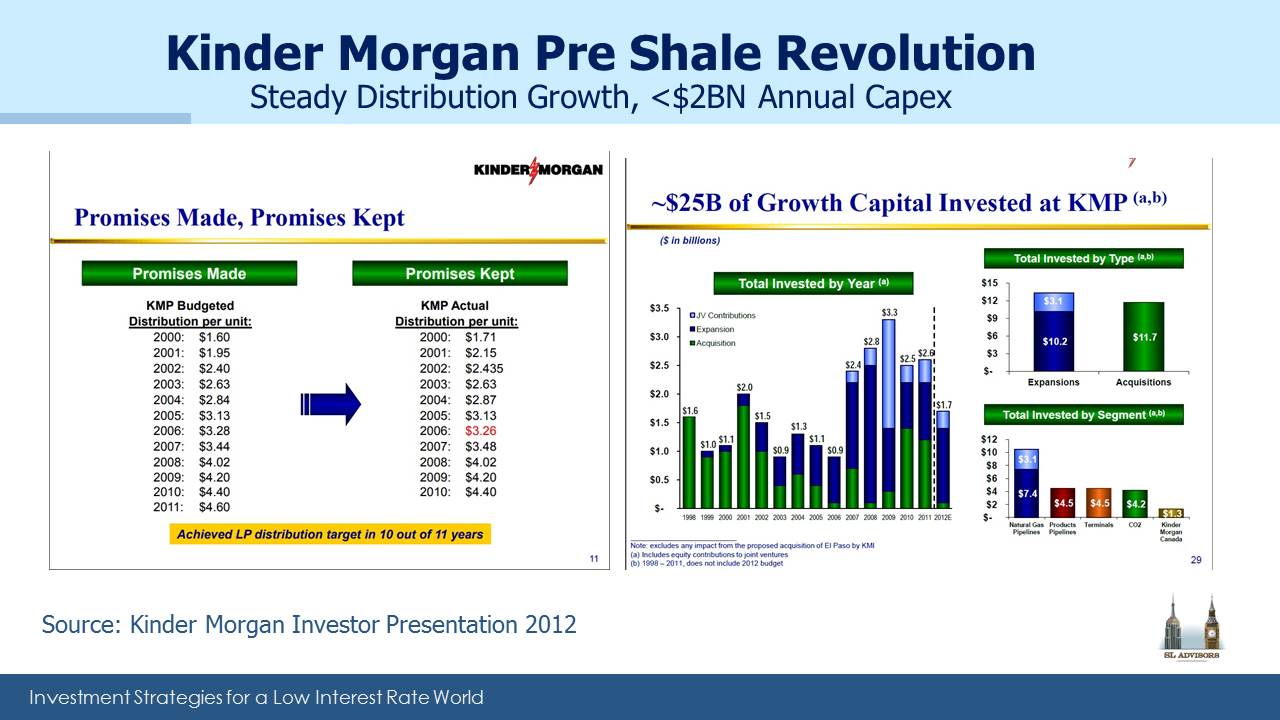
Pre-Shale Revolution, Kinder Morgan Partners (KMP) had rewarded investors with steady distribution growth and modest (for their size) investments in new projects. Their investor presentation included a slide labelled “Promises Made, Promises Kept” with a table showing these consistently higher payouts.
Not all companies make old investor presentations available on their website – since it allows users to compare statements across years, it can be embarrassing. To KMI’s credit, they do. Consequently, we’re able to delve back several years and recall the world MLPs used to inhabit. This was a time of attractive, stable distributions with modest growth and an occasional need for growth capital. The Shale Revolution was not widely regarded as the energy sector game changer it became. Wealthy U.S. investors tolerant of K-1s liked the mostly tax-deferred distributions. MLPs were an income-generating asset class.
KMP, which was at the time the main operating entity, noted that from 1997 to 2011 it had invested $24BN in new projects and acquisitions. As was the norm, most of that growth had been financed by issuing debt and equity, since KMP paid out most of its Distributable Cash Flow (DCF) in distributions. Over the next two and a half years as infrastructure demand grew, they invested $20BN in growth projects & acquisitions for a total of $44BN over 17 years. The chart below on the left includes $2.3B of organic capex budgeted for 2H14 to total 46.5B by YE2014.
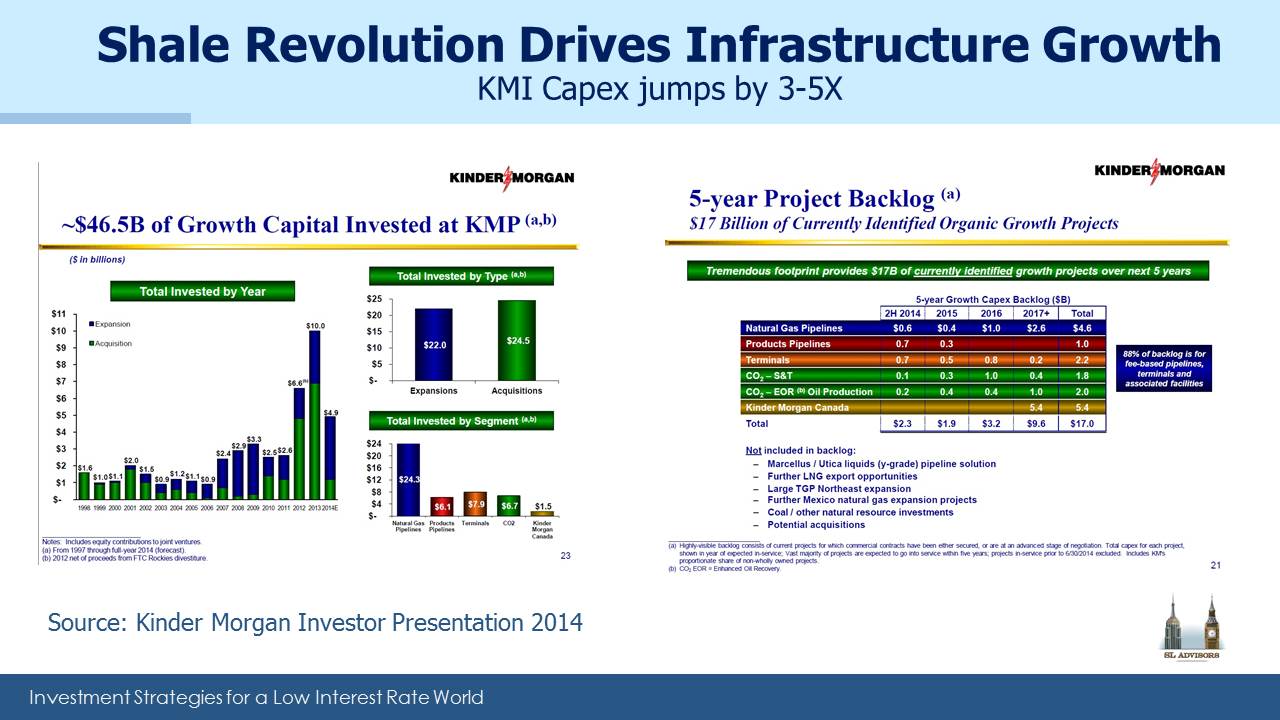
By mid 2014 KMI had concluded that the MLP investor base was too small to finance its growth. The 2014 presentation heralding the combination of KMI with KMP to create one integrated entity identified $17BN of organic growth projects over the next five years. Since 1997, $20BN of the $44BN had been invested in greenfield & expansion projects, with the balance being acquisitions. So the $17BN five year projected figure was analogous to the $20BN from the prior 17 years, since future acquisitions (the other source of growth) are generally very hard to forecast.
This is how the Shale Revolution manifested itself to big energy infrastructure companies. There was suddenly the need for lots more investment in attractive assets to meet new flows of hydrocarbons. But MLP investors weren’t big enough to provide the capital. KMI concluded this as the yield on their KMP units edged up, driven higher in order to attract the equity capital that their regular secondary offerings demanded. The 2014 KMI/KMP combination was intended to provide cheaper financing.
MLPs exist because of the tax code. Owning pipelines (or MLPs for that matter; see Some MLP Investors Get Taxed Twice) in a C-corp structure makes them taxable at the entity level, whereas MLPs largely don’t pay tax. But the universe of eligible MLP investors is limited to U.S. taxable K-1 tolerant investors, a small segment of all the global institutions who buy U.S. equities. As KMI found, if you need $Billions every year, MLP investors will start charging you more. Although folding KMP’s assets into KMI might have been expected to make them taxable, KMI’s clever advisers structured the deal to not be taxable for many years (see The Tax Story Behind Kinder Morgan’s Big Transaction). KMI could now fund its growth plans from the global equity market, not just MLP investors.
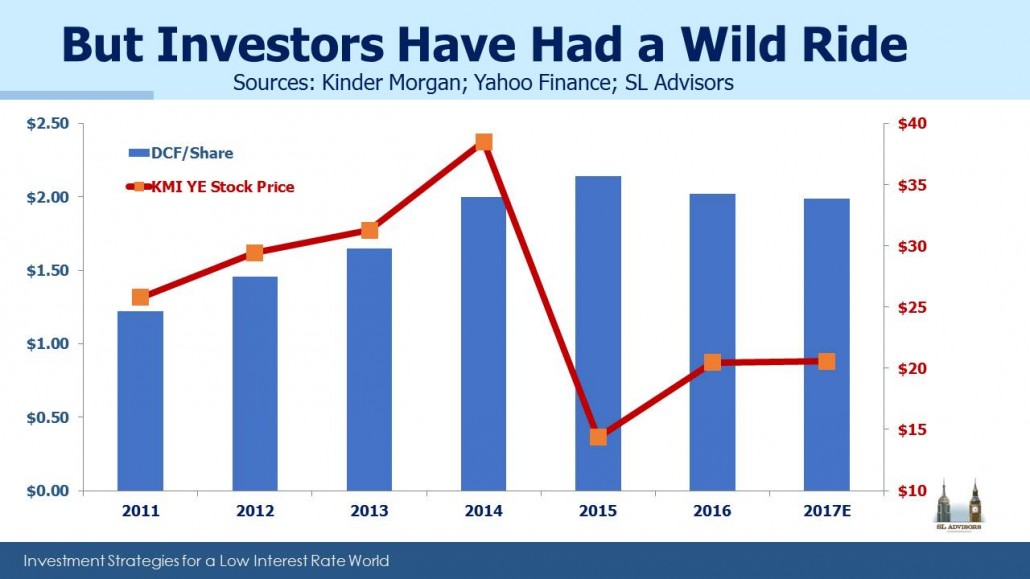
Their big mistake was to continue to think and act like an MLP. So they still planned to pay out most of their free cash flow in dividends, concurrently issuing new equity to get back most of it for growth. But corporations on average pay out a third of their profits in dividends, not 100%. Generating $4.5BN in DCF, paying $4BN in dividends and raising $2-3BN in equity looks a bit odd, albeit attractive to equity underwriters. So the market priced KMI accordingly, driving up its yield. As it rose above 10% the idea of handing cash earned from existing assets out and getting it back to invest in new assets looked increasingly absurd, so they cut the distribution.
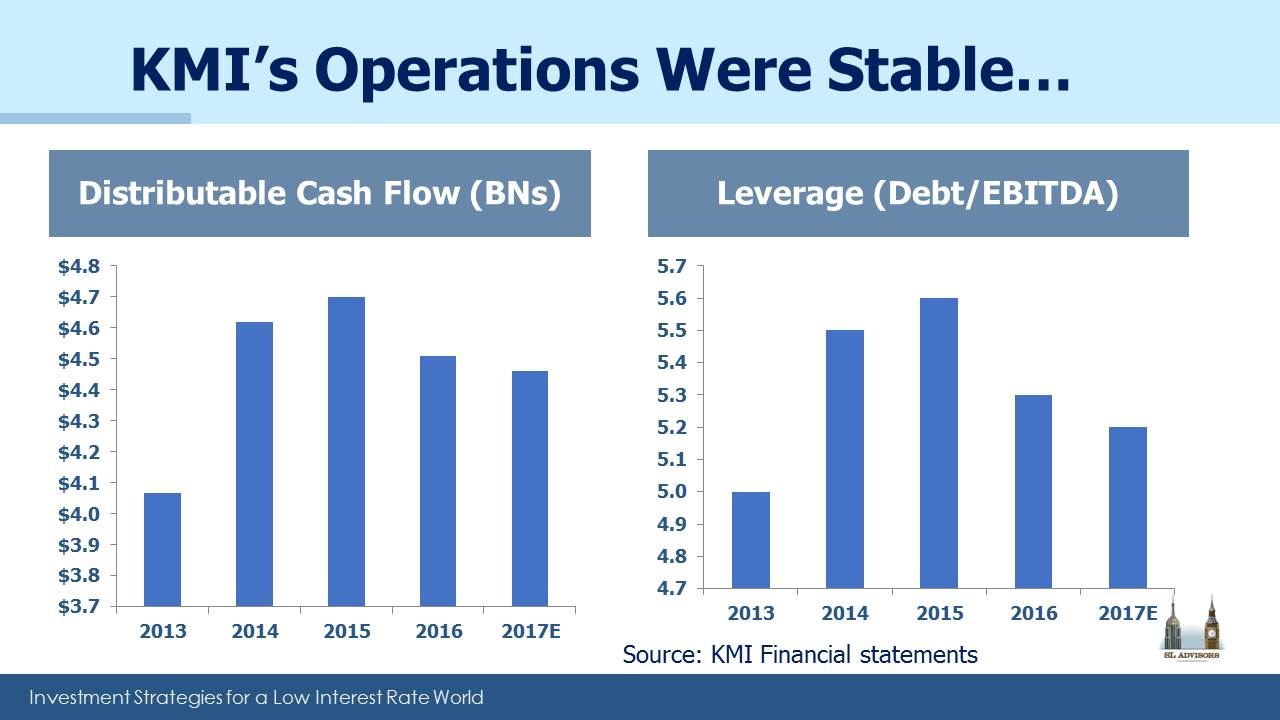
Notice that all of these issues were corporate finance ones. They all related to the liability side of KMI’s balance sheet. It was all about how best to finance future assets. The collapse in crude oil in 2015 affected KMI only modestly, because their cashflows are overwhelmingly from natural gas. Assets were mostly performing as expected, but their mis-steps were a combination of financing strategy and amount of growth. They certainly had the choice to cut their backlog of expansion projects, which would have lowered their need for new financing. But they chose as they did, and the 75% dividend cut created enough cash to eliminate the need for external funding. Had they opted for less growth they would have been able to maintain their original payout.
The growth backlog is declining as some projects (notably the $6BN North East Direct project, which was to improve natural gas distribution in New England) were cancelled and others completed. The excess cash is being used to reduce debt and starting in 2018 will be returned through higher dividends and a buyback. Other big MLPs merged their GP and MLP like KMI, reduced growth plans or did both. Leverage rose because new assets are built and financed before they generate EBITDA. As those projects are put into service, leverage is coming down.
Price history will show that KMI and the MLP sector endured a terrible operating environment during the 2015 crash in crude oil. Most investors even today regard the worst bear market in the sector’s history (see The 2015 MLP Crash; Why and What’s Next) as an oil-induced fall in operating results. The reality for KMI was that growth plans driven by the Shale Revolution exceeded the financing capacity of a specialized investor base. This is pretty much the case for midstream in general. It’s not obvious from a price chart, but if you followed developments real time it’s the real story.
We are invested in KMI