How Far Will The Fed Go?
Next week the Fed Funds rate is expected to be raised, for the first time in over three years. Pundits love to say the Federal Reserve is “in a corner”, implying a Hobson’s Choice between possible courses of action. This hackneyed term is being deployed again, mischaracterizing their choices.
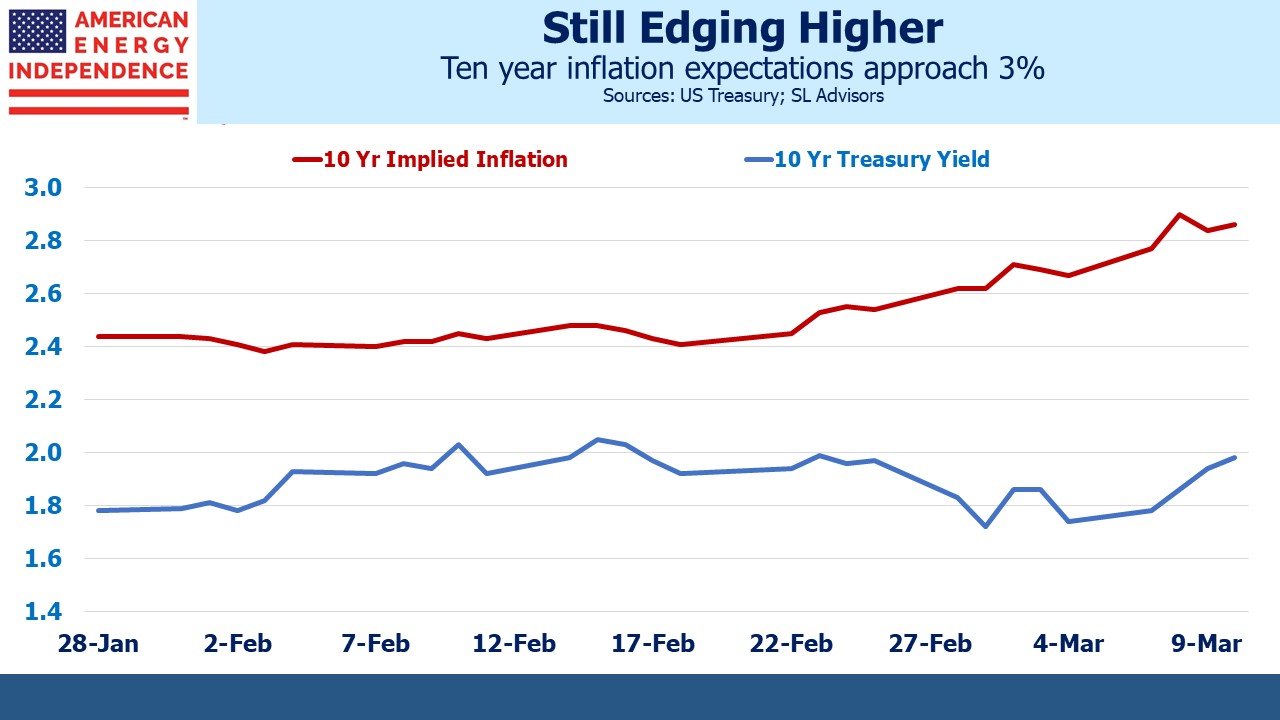
It’s true inflation expectations have edged up – five years implied CPI is 3.4%, and ten years 2.9%. But these figures aren’t that bad – if inflation runs at 7% this year, falls to 4% next year and then returns to the Fed’s 2% long term target, that would be consistent with the 3.4% average implied by the treasury market. Moreover, the Personal Consumption Expenditures (PCE) deflator which is the Fed’s chosen metric typically runs 0.25% or so below CPI. Although inflation is 7.9%, the FOMC can interpret long-run expectations as well contained.
Higher crude oil is both a constraint on consumer spending and a boost to inflation. These factors prescribe opposite pressures on monetary policy – higher oil works like a tax hike without the corresponding improvement in our fiscal balance. Leaning hard against current inflation makes less sense when energy prices are already tempering disposable incomes.
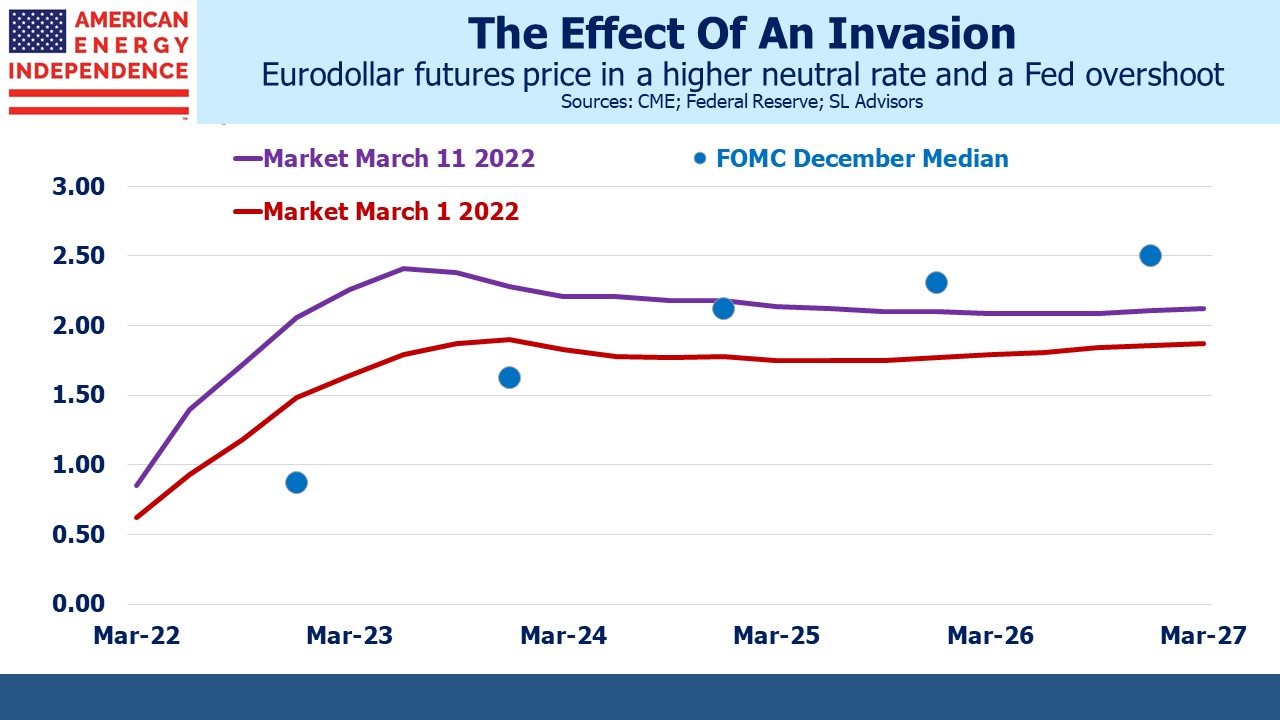
The justification for monetary accommodation receded long ago, and the FOMC will want to get back to neutral probably at the pace implied by eurodollar futures – reaching 2% in a year or so.
The interesting question is in which direction is this forecast vulnerable? Goldman Sachs puts the odds of a recession by next year at 20-35%, which they calculate is the odds implied by the yield curve. The market’s priced for the Fed to modestly over-tighten by the end of next year, causing them to reverse course.
The bond market is being tugged between these two opposing forces – increased odds of recession and rising inflation.
Although crude oil fell last week, the supply shock to a broad range of commodities caused by Russia’s invasion looks set to persist. It’s hard to envisage a scenario in Ukraine that will restore Russia’s trading links with much of the world. Regardless of the military outcome, diversity of supply is now a pillar of European energy security and probably food security too.
As commodity prices continue to reflect tight markets, recession odds and inflation will both increase.
For an FOMC attuned to “transitory” explanations for elevated inflation, there is a long list of candidates, even if chair Jay Powell has officially retired the adjective. Supply constraints as consumption of goods rebounded faster than services was the original one. Putin’s gas price hike is another that White House press secretary Jenn Psaki has coined. Tighter monetary policy isn’t much help there.
The energy transition is inflationary – properly executed it means energy will cost more without doing more. Administration policy has been to discourage new supply of traditional energy, which was already pushing prices higher before Putin provided another shove. If Russia’s isolation from global trade continues for many months, which seems likely, this will dominate the narrative around energy inflation.
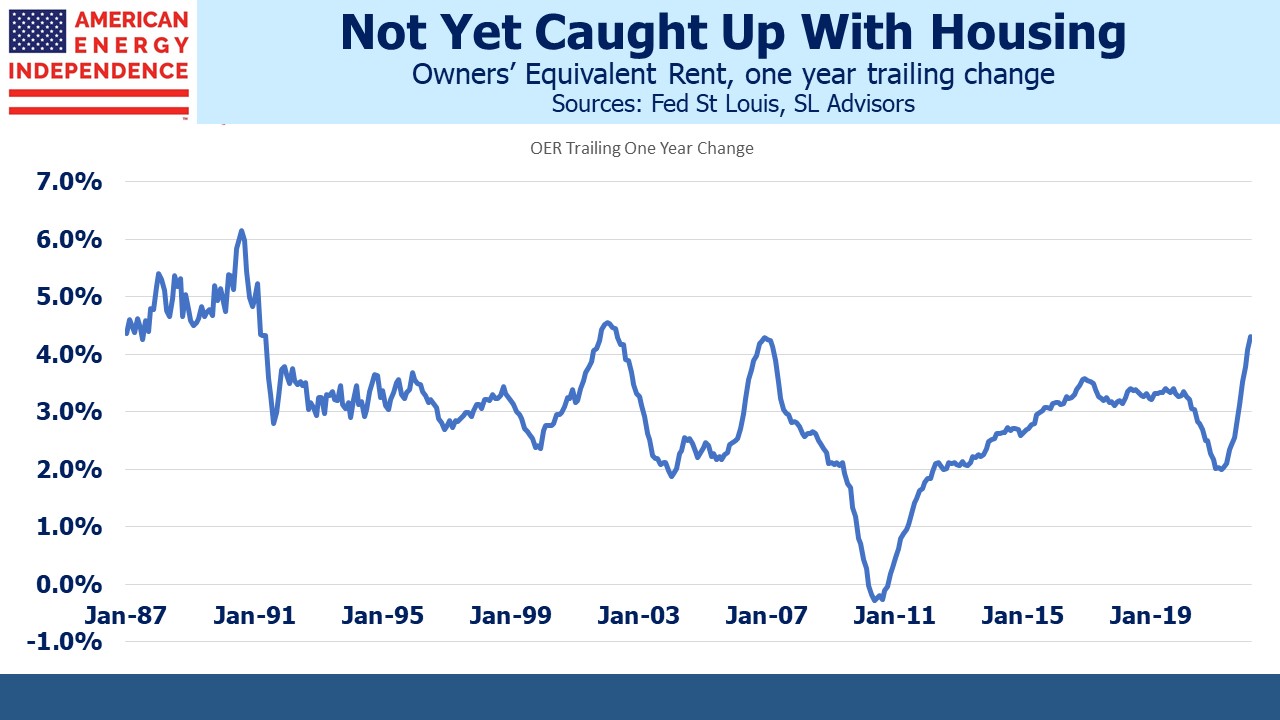
Then there’s Owners’ Equivalent Rent (OER), the deeply flawed estimate of the cost of shelter based on survey responses measuring what homeowners think they could rent their house for (see Why You Shouldn’t Expect A Return To 2% Inflation). This metric lagged the strong housing market that followed Covid, providing the BLS economists who publish it and the FOMC to ignore what American home buyers experienced.
OER does tend to track the Case Shiller index over the long run, and has recently been trending higher (+4.3% year-on-year). Surveyed homeowners are belatedly reflecting the strong housing market by demanding more theoretical rent from their hypothetical tenants. Having ignored the housing market, as OER pushed up measured inflation the FOMC could dismiss it as a non-cash expense. It would be bizarre for monetary policy to be influenced by OER – it never has been. Housing bubbles have never induced higher short term rates, and there’s no reason to expect OER to either.
OER is another item on the list of inflation that can be tolerated. Having dropped “transitory” look out for “ephemeral” or “impermanent” as replacement adjectives.
The yield curve can be interpreted as the market’s way of grading the Fed. Too steep suggests they’re allowing too much inflation. Inversion suggests policy is too tight. They want to get back to neutral, which is 2.5% although 2% would be close enough. Given this FOMC’s full employment bias and inflation risk tolerance, we’re only ever one weak payroll report away from the market repricing to a slower pace of policy normalization.
Eurodollar futures suggest a cycle peak late next year. The impact of Russia’s invasion has been to shift the neutral rate higher and increase the odds of an overshoot. If the FOMC ever finds themselves contemplating a rate hike when the market is priced for it to be their last, many members will be find reasons to demur. This is why ten year inflation expectations should continue moving up. Portfolios should be structured accordingly.
We have three funds that seek to profit from this environment:
Please see important Legal Disclosures.


