Bonds Still Can’t Compete with Stocks
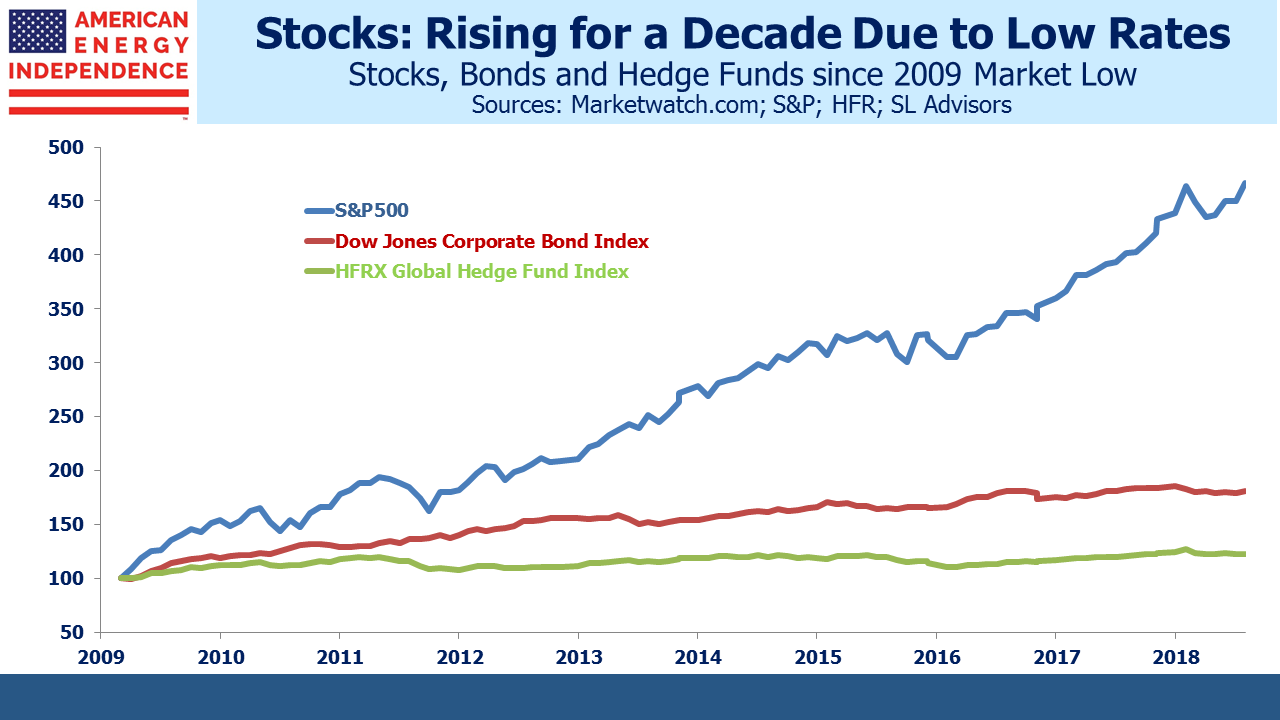
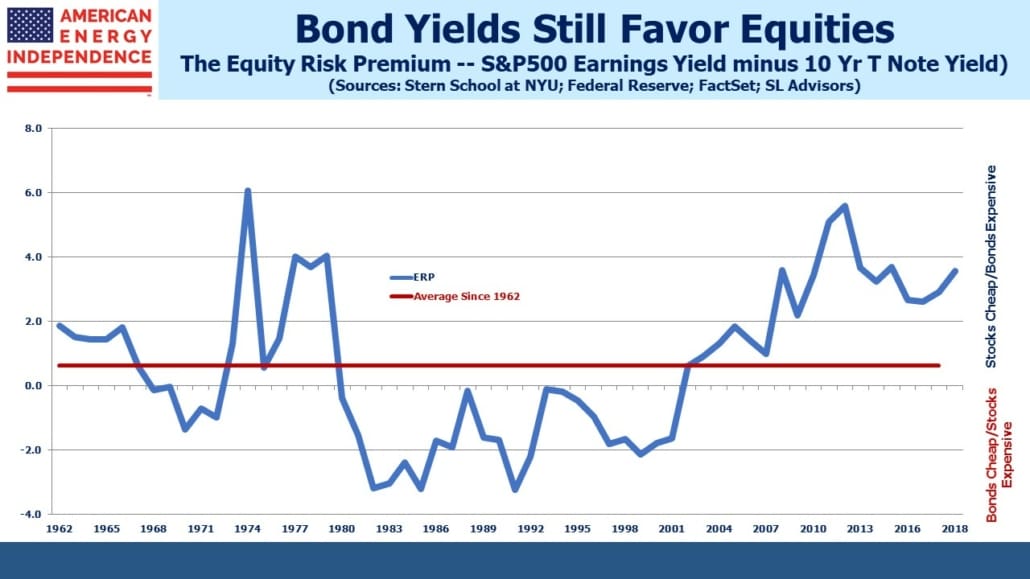
The Equity Risk Premium (ERP) is a handy way to compare valuations of equity with fixed income. It compares bond yields with the earnings yield on stocks (the earnings yield is reciprocal of the price/earnings ratio). Six years ago, when the Fed was well into quantitative easing and bond buying, it gave a clear signal that stocks were a far better long term investment than bonds. The yield on ten year treasuries was below 2%. Government policy was to create a huge disincentive for investors to hold fixed income through unattractively low rates, and it worked. Holding risky assets such as equities has substantially outperformed less risky bonds.
It’s not only relative valuations that supported stocks, but earnings growth. 2018 earnings on the S&P500 are coming in 22% higher than 2017. Pessimists will note that this growth won’t be sustained into next year, but the FactSet consensus estimate for 2019 is still 10% growth, which isn’t bad.
So what is the ERP telling us now? In 2012 the difference between yield on S&P500 earnings and ten year treasuries reached 5.6%, the widest since the 1970s and fully 5% above the 50+ year average. Interest rates were artificially low, and had they risen rapidly, the relative attraction of stocks would have quickly receded. But there were good reasons to expect low interest rates to persist, as I wrote in Bonds Are Not Forever; The Crisis Facing Fixed Income Investors. A financial crisis caused by too much debt required low rates to ease the deleveraging. Although bond yields have been rising, they’re still not historically high. The long term real return on ten year treasury notes is 2%. That suggests 4% is a neutral yield (2% historic real return plus 2% projected inflation). At a little over 3%, rates are still well short of neutral. It would take a jump of at least 2% in bond yields before they’d look historically attractive.
Although Trump is so far associated with a strong stock market, October’s rout has pretty much wiped out any positive return for the year. As Stephen Gandel pointed out in Bloomberg last week, on a valuation basis equities are now lower than they were before the 2016 election. In other words, earnings growth has outpaced the market.
Moderately rising bond yields combined with strong earnings growth that hasn’t flowed through to prices means that stocks look attractive. Today’s ERP of 2.9% isn’t as compelling as in 2012, but it’s wider than the prior couple of years. Moreover, next year it’ll widen to 3.6% because of earnings growth, the third best level in the past decade. Relative valuations can withstand a continued gentle move higher in interest rates.
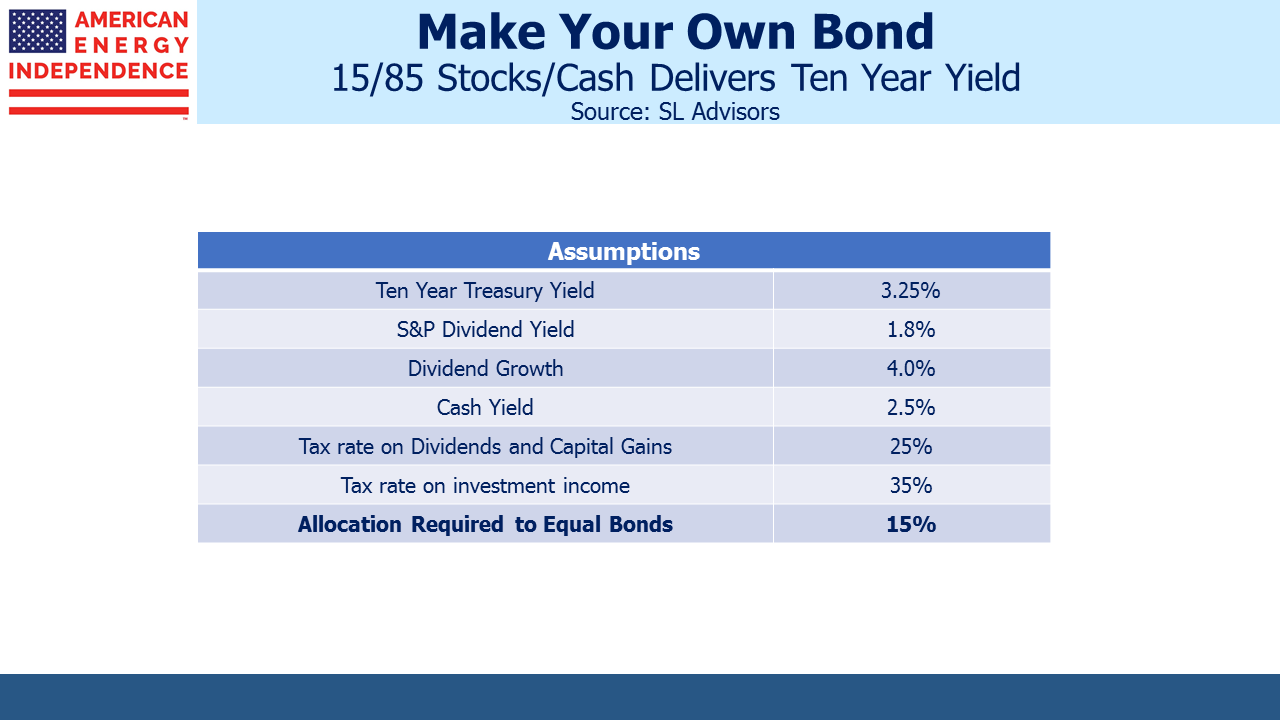
An interesting way to compare stocks and bonds is to calculate how much of $100 you’d need to hold in equities, with the balance in cash (six month treasury bills, which yield around 2.5%), in order to replicate the return from holding ten year treasuries. It relies on some simplifying assumptions: that the current yield on the S&P500 persists, that tax rates won’t change, and an estimate for dividend growth (we used 4%). Keeping the dividend yield unchanged means stocks would appreciate at the same rate as dividends.
We’ve used this analogy for many years – see The Sorry Math of Bonds from October 2011. Back then, bond yields were 2% and we showed that a portfolio invested 20/80 between stocks and cash had a good chance of matching an investment in bonds. What was striking about that analysis was it assumed the 80% in cash earned nothing for the full ten years. Although short term rates were 0% back then, they were likely to rise over the following decade as they clearly have. That 20/80 allocation has worked very well.
Today’s S&P yield is 1.8%, ten year yields are around 3%, and cash pays 2.5%. We’ll retain the 4% dividend growth rate we assumed before, although that’s probably conservative. The trailing growth rate is 8.65%.
The net result is that a 15/85 split between stocks and cash delivers the same return as 100% in bonds. In other words, stocks are relatively an even better bet.
This might seem surprising since bond yields have risen so as to be more competitive, and the dividend yield on stocks is lower. The big difference comes from cash rates, which are currently 2.5%. Cash is no longer trash, so it contributes to the return, whereas in our 2011 example it didn’t. And bond yields still aren’t that high. You pick up less than 0.75% by moving from short term to ten years, not much additional return for the risk.
It works because dividend growth is a powerful driver of returns. The static return on bonds is no match over the long run for rising S&P500 earnings which support dividend hikes. The tax code also favors dividends and capital gains over the ordinary income of bonds. Put another way, since the yield curve only offers 0.75% to move out on the curve, you don’t need much in a risky asset to generate that additional return.
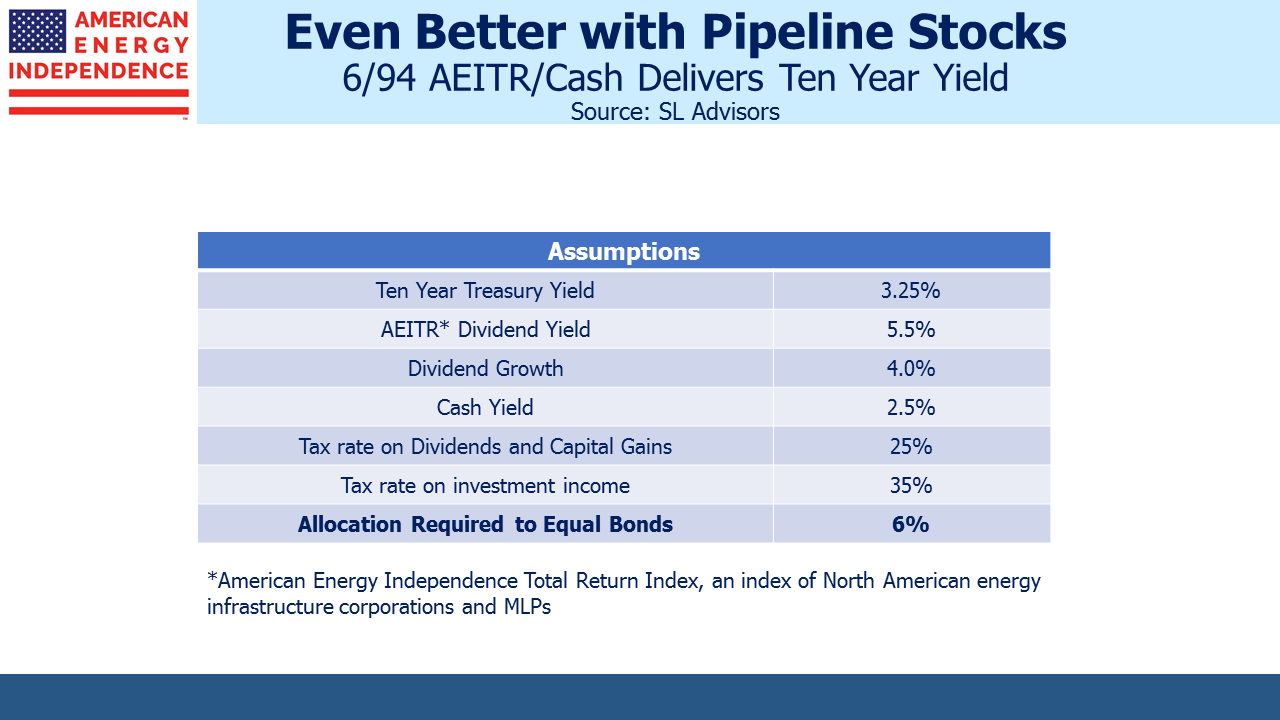
Because we invest in energy infrastructure, we’ve also run the Math assuming you use the American Energy Independence Index (AEITR), yielding around 5%, instead of the S&P500. This is an index of the biggest North American pipeline companies, mostly corporations with 20% MLPs.
We expect 10% annual dividend growth on our index over the next couple of years, but conservatively assuming the same 4% as with the S&P500, a 6/94 split between AEITR and Cash would match bonds. Dividends are important, and because pipeline stocks yield more than bonds, the Math works powerfully.
The Equity Risk Premium shows that stocks are cheap. But if recent market volatility makes you want to move to fixed income, you can synthetically create your own bond with the 15/85 portfolio. For even the most bearish investor, the case for holding some equities remains a powerful one for the long term.


