Election Year Meddling Saps US Energy

SL Advisors Talks Markets
Election Year Meddling Saps US Energy
Loading
/

By Henry Hoffman, Partner, SL Advisors

In the realm of global energy, 2024 was heralded as a landmark year for the expansion of liquefied natural gas (LNG) projects, particularly for America. Optimism was buoyed by the prior year’s achievements, wherein American enterprises reached Final Investment Decision (FID) on the equivalent of 5 Billion Cubic Feet per Day (BCF/D). That’s one third of the amount of gas Europe was importing from Russia before the invasion of Ukraine! 

However, a regulatory interlude, specifically the temporary suspension of non-Free Trade Agreement (FTA) export licenses coupled with more stringent criteria for extending project in-service dates, has precipitated a recalibration of expectations. This pause has advantaged international competitors, notably with Qatar announcing a 16-MMt/y expansion. Consequently, the landscape for 2024’s FIDs is now markedly altered, favoring projects beyond American shores. 

According to the leading LNG experts at Poten & Partners, only a few domestic endeavors are still poised for progress. These include NextDecade’s (Symbol: NEXT) Rio Grande LNG Train 4, a notable candidate for a 2024 FID. Poten notes they have their DOE approvals in hand and Middle East buyers (Reuters has previously reported this is ADNOC) are in advanced discussions for offtake of 2-3 Million Tonnes per Annum (MTPA), enough to commercialize the project with TotalEnergies exercising its option for 1.5MTPA. NextDecade is targeting FID on T4 by the end of 3Q 2024.  

Nonetheless, the overarching sentiment within the industry is one of restraint, as projects that once seemed imminent now grapple with uncertain timelines. This unforeseen stasis extends beyond the U.S., affecting Mexican projects reliant on American natural gas, thereby creating a ripple effect that benefits international ventures in the UAE, Mozambique, and Papua New Guinea. 

In the intricate tapestry of global energy dynamics, the recent recalibration of the United States’ regulatory stance on non-FTA LNG export licenses has precipitated a notable shift. Asian buyers, initially on the cusp of cementing long-term procurement deals with U.S. LNG developers in the first quarter of 2024, find themselves at a crossroads, compelled to reconsider their supply strategies in light of these regulatory adjustments.  

This pivot is not merely a transient phase but a reflection of a deeper reevaluation of supply chains amidst evolving policy landscapes. Poten highlights that Energy Transfer’s (Symbol: ET) Lake Charles LNG project epitomizes the challenges and resilience within this sector. The project has faced renegotiation barriers with potential buyers due to the uncertainty surrounding its non-FTA permit extension, essential for meeting its proposed in-service deadline of December 2025.  

This situation is further exacerbated by the U.S. Department of Energy’s stringent criteria for permit extensions, adding layers of complexity to an already intricate negotiation landscape. As a result, Energy Transfer’s attempts to amend pricing structures with buyers have encountered significant headwinds, underscoring the delicate balance between regulatory compliance and market competitiveness.  

Poten notes that Japan’s Kyushu Electric has delayed converting its Heads Of Agreement (HOA) with Energy Transfer into a binding Sales and Purchase Agreement (SPA) as one example of the effects of this disastrous policy. Conversely, Tellurian’s (Symbol: TELL) plagued Driftwood project may have received a lifeline, enabling it to capitalize on the current regulatory pause that has beleaguered competitors like Energy Transfer. 

The implications of this regulatory hiatus extend beyond mere project delays. It underscores a burgeoning competition for market share in the LNG sector, with other nations benefiting from America’s masochist behavior. This political maneuver disadvantages our allies in Europe and Japan while aiding rivals in the Middle East and Russia, manifesting significant and concrete impacts.  

Fortunately, in contrast to the partisan DOE, the American spirit lives on in domestic LNG developers, who, despite the current impasse, continue to forge ahead with negotiations and project planning. 


Fuzzy Thinking On The Energy Transition

SL Advisors Talks Markets
Fuzzy Thinking On The Energy Transition
Loading
/

Indonesia and Malaysia are apparently among the few places on earth with geology suited to hold CO2. This has drawn the interest of Exxon Mobil among others, who recently secured “exclusive rights to CO2 storage” according to CEO Darren Woods. Meeting the “Zero by 50” goal requires burying 1 billion tons of CO2 annually by 2030, 25X today’s capacity.  

Schlumberger is investing as much as $500MM to buy Norway’s Aker Carbon Capture Holding. And Occidental is building the world’s biggest carbon capture facility in Texas.  

These are all examples of how the energy sector is positioning to continue providing reliable energy while also helping mitigate CO2 emissions.  

Policymakers have an ambiguous posture towards energy companies. They like to blame them for producing fossil fuels but want them to continue so that prices on 80% of the world’s energy don’t shoot up. There’s little support nor technical capability to stop using what moves the world’s economy.  

This shows up in myriad ways. A UBS banker recently complained about having to align financing decisions with a world warming by 1.5 degrees above 1850 levels. We’re already at 1.1 degrees, so almost there. Judson Berkey, group head of engagement and regulatory strategy, noted that more realistically we’re “hurtling towards a 2.8 degree warming.”  

“Banks are living and lending on planet earth, not planet NGFS,” added Berkey, referring to the Network for Greening the Financial System.  

If companies aren’t running their businesses consistent with Zero by 50, how is a bank supposed to make lending decisions under this more onerous constraint? 

JPMorgan Asset Management and several other big firms withdrew from Climate Action 100+ because they concluded their interests weren’t properly aligned. Political leaders haven’t been effective in persuading voters to accept higher energy prices to speed the transition.  

So the world follows ambiguity – not confronting China as it ramps up coal consumption; ignoring the boost to emissions to increase their living standards; pressing banks to pretend there’s no demand for traditional energy financing. Coal finance is among the most controversial areas for banks, because the world is supposed to be phasing out its use albeit with varying degrees of commitment.  

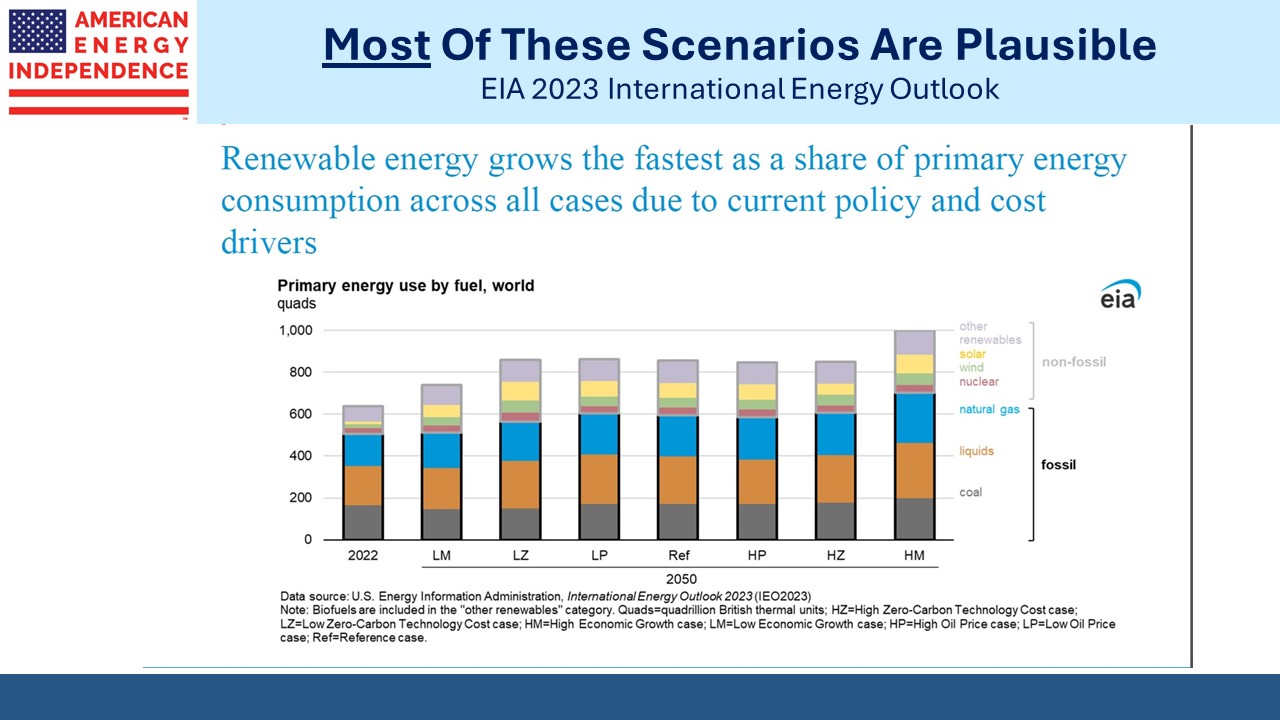
The US Energy Information Administration in last year’s International Energy Outlook shows 2050 coal demand flat in their Reference Case and little changed in their six other scenarios. 

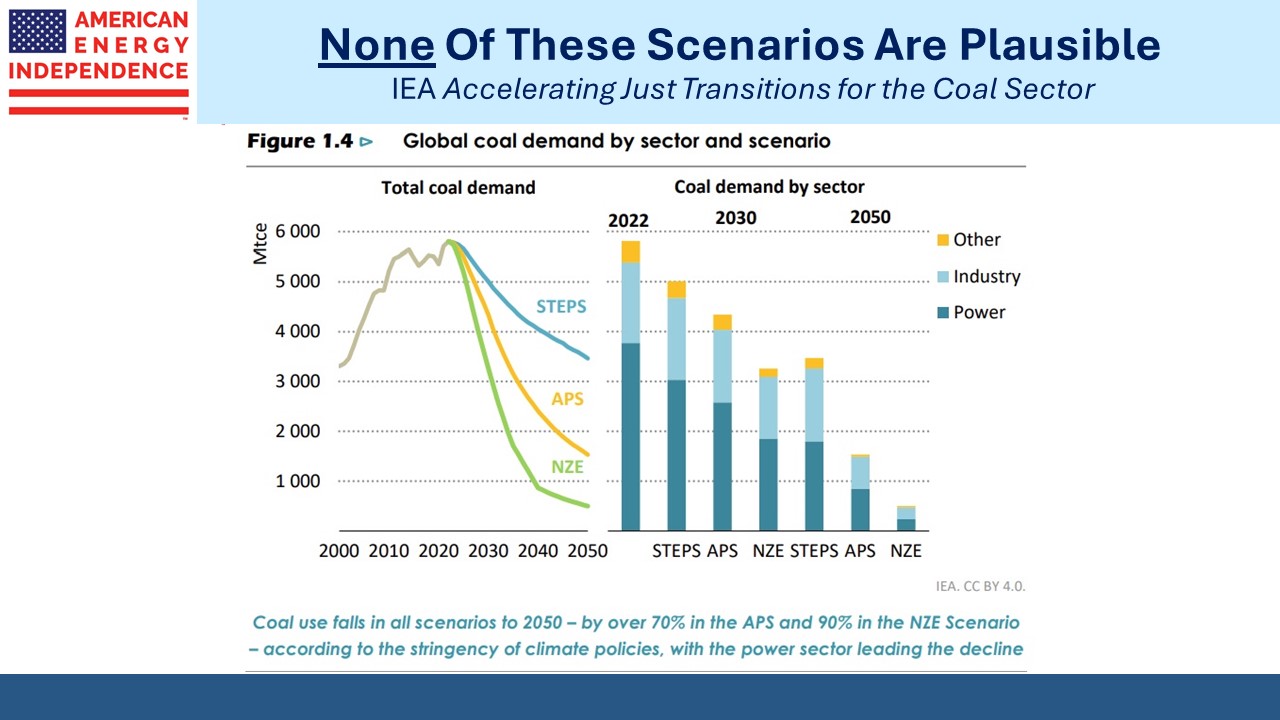
By contrast, the International Energy Agency (IEA) recently published Accelerating Just Transitions for the Coal Sector. As is common nowadays, the IEA’s forecasts are aspirational and routinely show fossil fuel consumption peaking at the time of publication. There’s no IEA scenario in which coal demand rises, even though last year saw record consumption. 

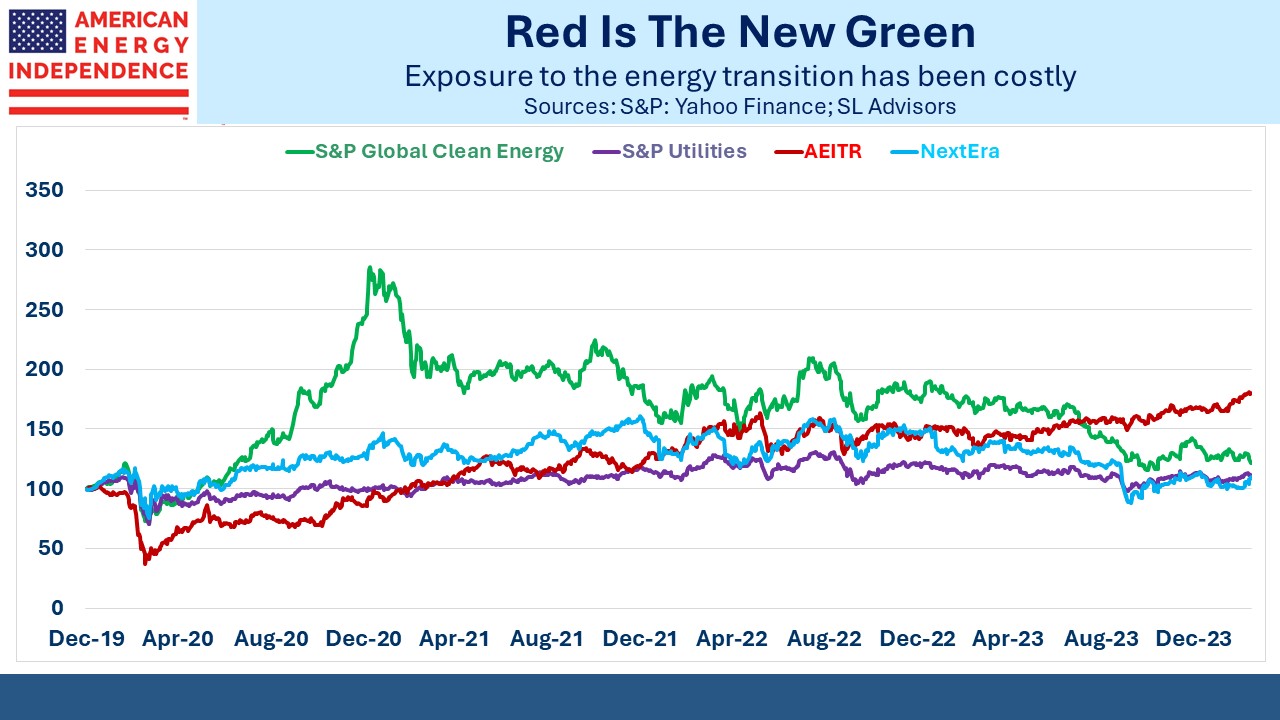
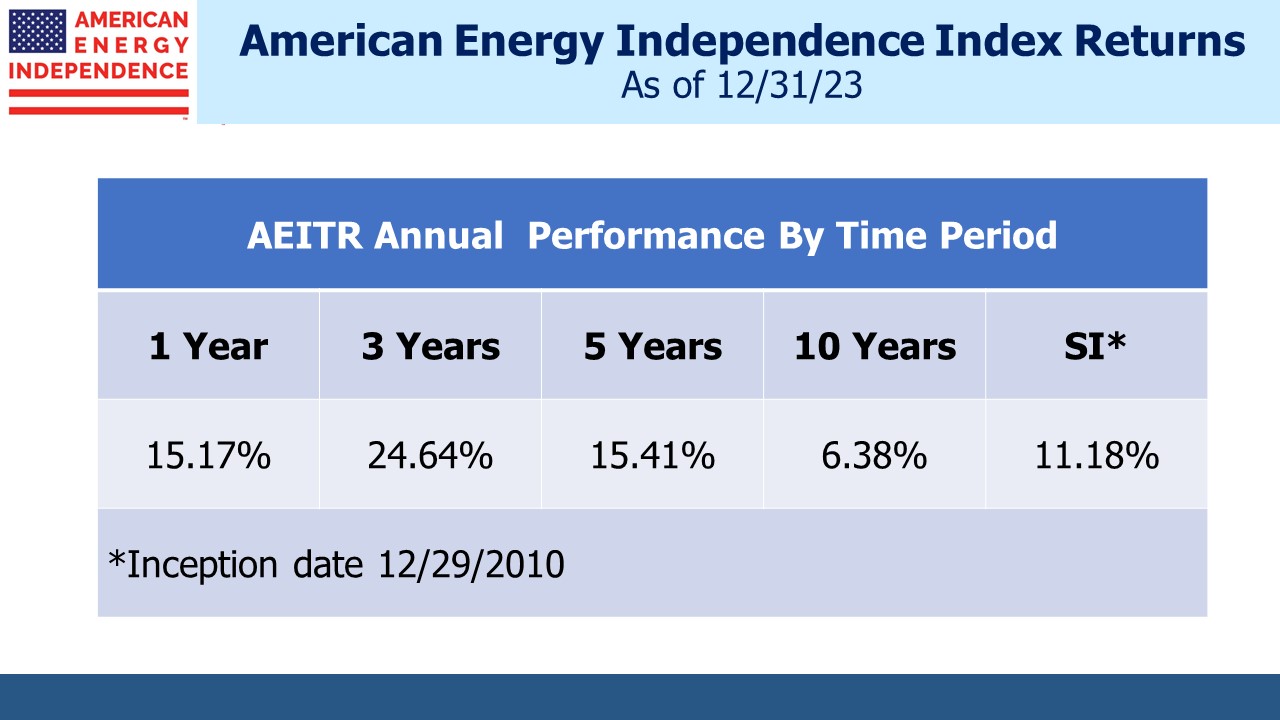
Markets are looking through this. Midstream energy infrastructure, as defined by the American Energy Independence Index continued to outperform utilities. That’s because NextEra and their peers are responsible for delivering the energy transition. On one side sits the unappealing economics of renewables which push up power prices. This is in part because increased solar and wind use raises the amount of redundant capacity needed to back up weather-dependent electricity.  

On the other side sit political and regulatory pressure to decarbonize the grid.  

Clean energy is also a huge investment disappointment. The sector’s operating margins are often unattractive and sometimes negative.  

According to Wells Fargo, Ohm Analytics revised down their forecast of residential solar installations to –19% versus last year. Wells Fargo is at –25%. One reason is that installers are going bankrupt.  

Ohm retains a positive longer-term outlook on residential solar for two reasons that are heavy in irony: (1) rising utility bills, and (2) increasing grid instability. Data center build-out is a recently appreciated area of demand growth following decades of no growth in electricity consumption.  

Higher prices and reduced peak demand buffers are a consequence of greater reliance on renewables. As power grids operate with diminished excess capacity the risk of a power outage rises. This will play out over the next several years.  

In brief, Ohm is forecasting increasing residential spending on solar panels because increased utility spending on solar panels is raising prices and reducing the flexibility of the grid. If too many households become self-sufficient in electricity generation and unplug from the public system, the substantial fixed costs of maintaining and building distribution infrastructure will get spread across a declining set of customers.  

That’s a problem for another day.  

The energy transition is an engrossing story, but we believe the best returns will continue to come from traditional energy and midstream infrastructure which continues to allocate capital based on IRR with limited impact from ESG-type influences.  

Why You Shouldn’t Expect A Return To 2% Inflation

Jamie Dimon thinks the Fed may tighten rates six or seven times this year. Bill Ackman believes the Fed should punctuate the start of the tightening cycle with a 50bp hike in order to regain some credibility. Whatever their self-image, this is a dovish FOMC. Central bank bond buying is set to continue until March, and raising short term rates can only start then. So monetary stimulus continues, in the interests of avoiding any surprises. An unemployment rate of 3.9% combined with hourly earnings increasing at a 7.5% annualized rate (December was up 19 cents to $31.31) reflects full employment. They’re already late.

Cyclical peaks in short term rates have declined over the past couple of decades. It seems the economy succumbs to monetary tightening more readily each time. This is why the market doesn’t expect rates to move much above 2%, and is probably why the Fed is so lethargic in normalizing policy. They don’t expect to tighten much.

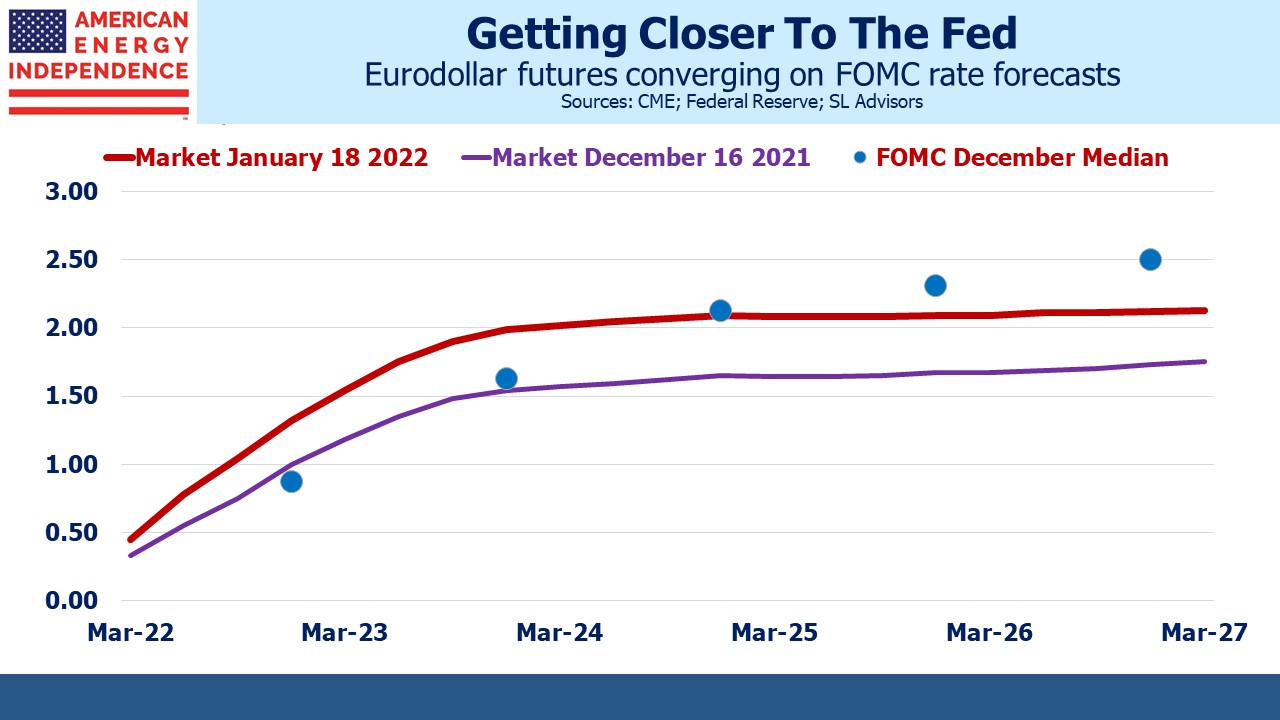
Over the next year, the risks seem skewed to the upside for rates. Fed chair Jay Powell continues to blame goods shortages for inflation, even though labor is most clearly under-supplied. FOMC forecasts of inflation have been steadily increasing. A 2% rate cycle peak with the economy booming and the Fed still stimulating seems optimistic. Eurodollar futures have been pricing in less optimism recently, but surely need to at least match FOMC projections in order to stop offering an asymmetric bet.

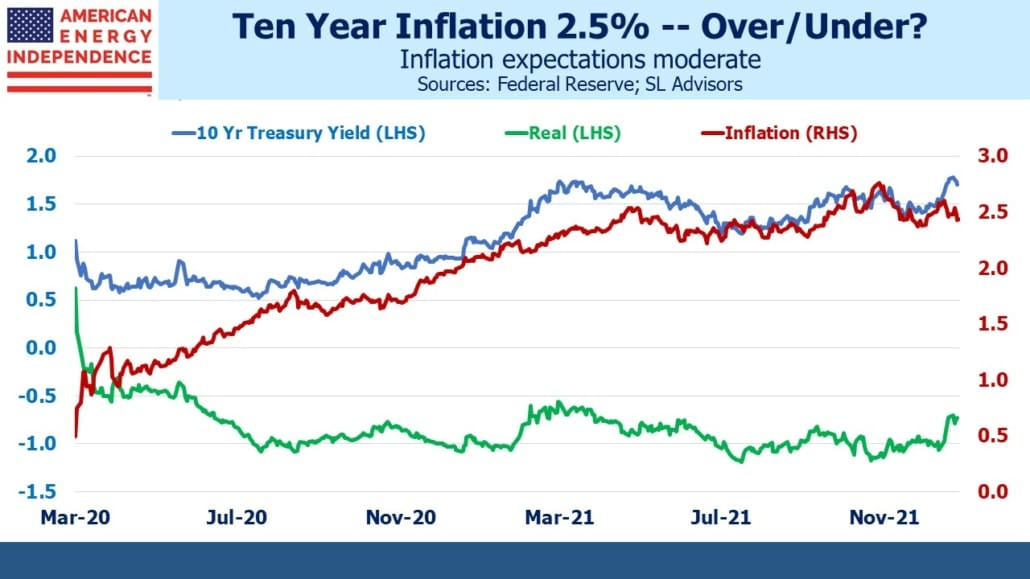
Looking farther out, ten year inflation expectations at 2.5% invite one to wager on higher. Although Jamie Dimon’s warning of more aggressive tightening looks prescient, we only reached this point because of the FOMC’s dovish posture. Reducing inflation from 7% draws little debate; bringing it down from 4% to 3%, and eventually to their long run 2% target, is likely to provoke concern about unnecessarily costing jobs. The Fed has taken excessive inflation risk to achieve today’s full employment – they clearly interpret their dual mandate as weighted towards people over bonds.

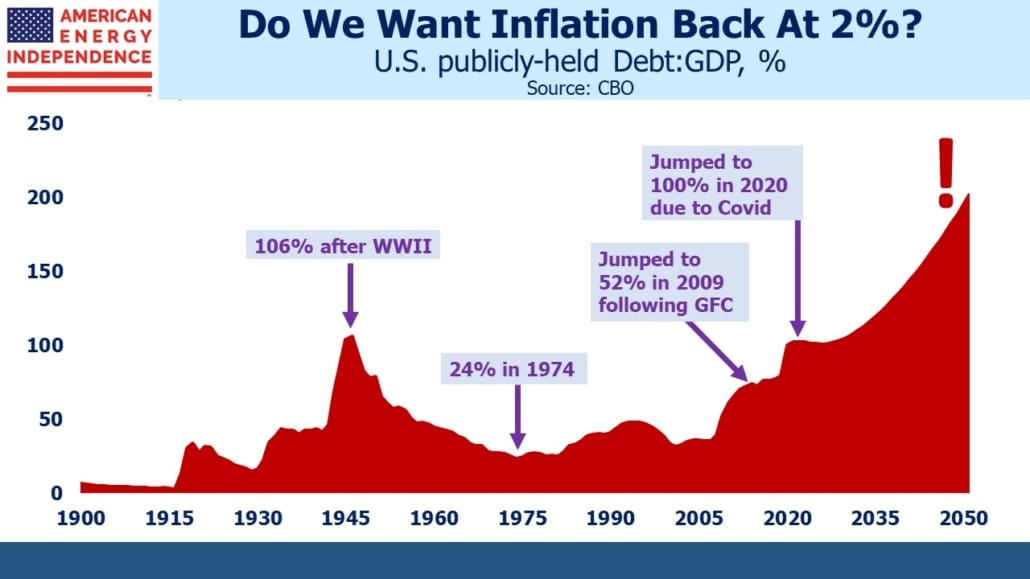
This is not necessarily bad. Monetary orthodoxy has long held that 2% inflation maximizes employment, but that could change. America’s indebtedness is relentlessly up. Expect more thoughtful pieces arguing that a little higher inflation eases the burden of debt service by providing more room for negative real rates. It is the endless gift from investors who must own bonds to those who service them — US taxpayers. We should take advantage of it.

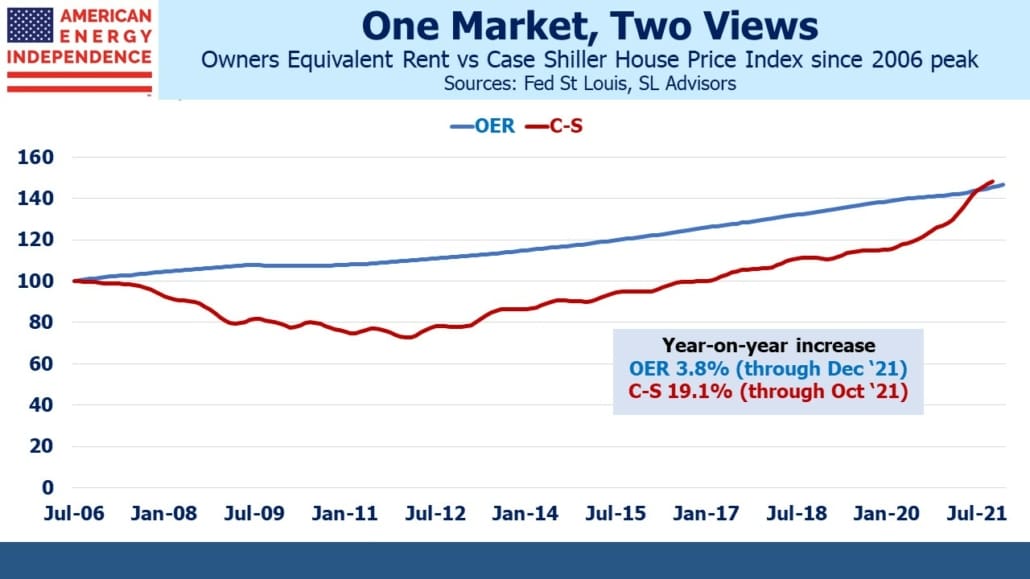
There are in any case ways for the Fed to overlook certain elements of inflation. Owners’ Equivalent Rent (OER) is one. This flawed survey of what homeowners believe their home would rent for continues to show the cost of shelter to be only inconsequentially rising, in complete defiance of the buoyant real estate market the rest of us see. Since the July 2006 peak in housing OER and the Case Shiller index, which actually measures home prices, have recorded similar increases albeit along very different paths.

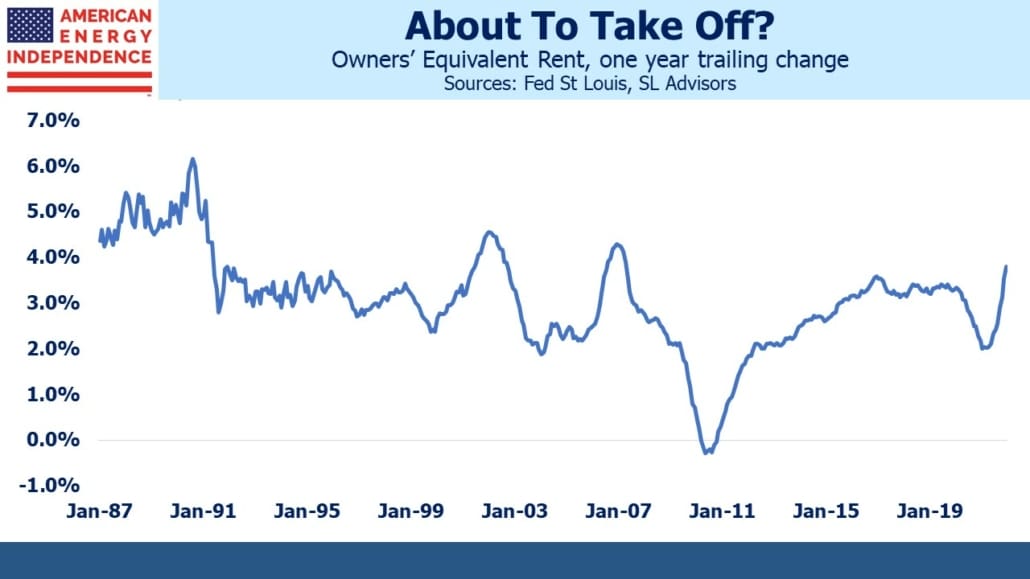
OER is lagging housing prices by over 15% year-on-year but has belatedly begun to reflect the housing market since its annual rate of increase has risen from 2% in April to 3.8% now. This suggests OER is set to inconveniently accelerate just when the FOMC strategy of hope is supposed to be working. But since OER is the only non-cash item in the inflation statistics, it wouldn’t take much for the Fed to dismiss its message since nobody writes a monthly rent check linked to OER.

The energy transition is another example. Shifting to a lower carbon energy system is going to raise prices – obviously, or we’d already be there. The inflation that counts usually excludes food and energy, because they’re volatile. But Europe’s energy crisis shows what excessive reliance on windmills and policy aligned with Greta soundbites can deliver.

ECB member Isabel Schnabel recently warned that Europe’s transition to cleaner energy presented upside risks to their inflation target. US states have generally avoided the worst of Europe’s policy errors but won’t be immune to rising global demand for coal, natural gas and oil. Investments in new production remain well behind what most analysts believe is necessary to meet emerging economies’ increasing living standards, and energy sector growth capex will remain constrained by caution around public policy.

If inflation is elevated due to the energy transition, tighter monetary policy need not follow. Although the energy value of a British Thermal Unit (BTU) is fixed, officials could conclude that greener BTUs are more desirable. It’s similar to the numerous quality adjustments statisticians at the Bureau of Labor Statistics make, which lower stated inflation. Successive iPhones are more expensive, but their added features represent improved quality. Since inflation measures the cost of a basket of goods and services of constant utility, this approach records falling prices for most consumer electronics even if the consumer winds up paying more. The same approach could be used for energy, in that the BLS could assess a quality improvement to energy delivered with reduced emissions, muting its actual increased cost.

The bottom line is that investors over the next year or so should consider the risks of a more hawkish Fed. But over a longer timeframe, the impact of sustained 3-4% inflation on portfolios warrants more attention. It’s likely to be the path of least resistance.

We have three funds that seek to profit from this environment:

Energy Mutual Fund Energy ETF Inflation Fund

Please see important Legal Disclosures.

Energy Policies Are Feeding Inflation

The continued ascent in natural gas prices has transfixed the energy sector but hadn’t much impacted broad market commentary, until recently. Europe has an energy crisis to be sure – a combination of over-reliance on windpower, years of policy discouraging natural gas production and strong global demand for natural gas. If sentiment in the pipeline sector was as sensitive to natural gas prices as it is for crude oil, its performance would likely have been even stronger in recent days. The recent jump in crude prices has grabbed more mainstream attention, propelling energy sector stocks up with it.

The Federal Reserve and other central banks will have to grapple with the feedthrough impact on inflation. Policymakers already exclude food and energy from the inflation statistics they target, on the basis that these are volatile and mean-reverting. However, higher utility bills and increased cost of transportation will have a secondary effect on most areas of the economy.

Wage inflation has historically been the trigger for shifts in monetary policy – wage increases beyond what improved productivity justifies. The same test could be applied to commodities though. A thousand cubic feet (MCF) of natural gas delivers the same one million BTUs whether the price is $3 per MMCF as it was a year ago or $6.25 as it is currently. Even at that level it’s a quarter of the price European and Asian buyers are paying for imports of Liquified Natural Gas (LNG).

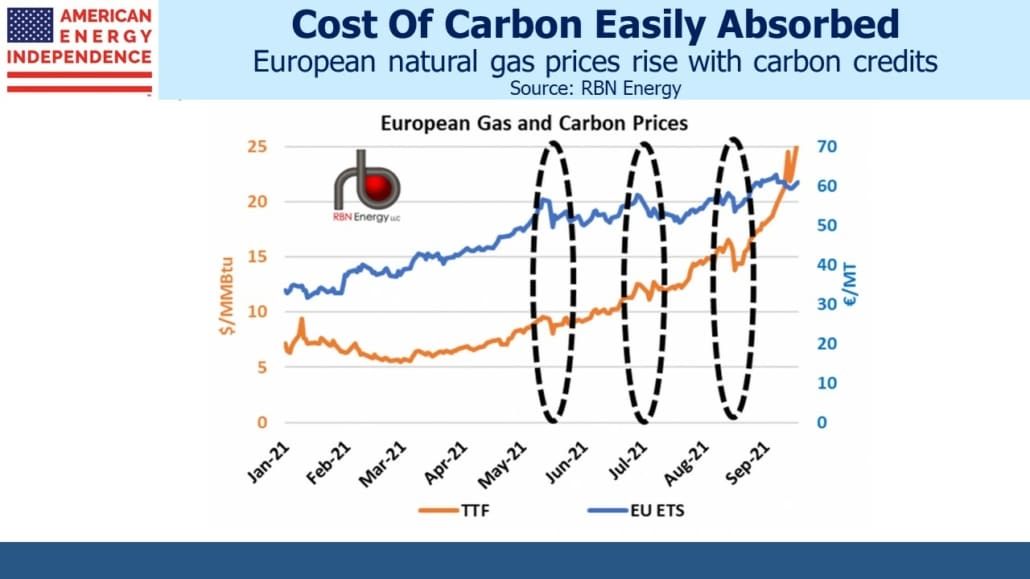
The only constraint on US prices is the availability of more LNG export terminals capable of chilling methane so it’s 1/600th of its normal volume. As more LNG export capacity becomes operational, domestic natural gas prices will move higher. Interestingly, European prices for carbon credits have been following natural gas prices higher. Even at €70 per metric tonne, they’re no constraint. Natural gas generates 121lbs of CO2 per MCF, so a power plant has to pay around 3.30 per MCF for CO2 credits. The fact that these credits are rising with natural gas prices reveals the strength in demand.

The FOMC continues to believe inflation is transitory, which is why they’re comfortable with a very gradual reduction of bond market support. It looks as if monthly buying of mortgage-backed securities will continue into next spring, a year after it was abundantly clear that the US housing market was hot (see Federal Reserve Housing Support Has Run Its Course).

Because the FOMC relies on the quirky Owners’ Equivalent Rent (OER) survey of homeowners to gauge the cost of shelter, they don’t see housing inflation (see Why You Can’t Trust Reported Inflation Numbers). The followers of OER are probably limited to a few hundred people, consisting of statisticians at the Bureau of Labor statistics, Wall Street economists and the FOMC. The rest of America looks at house prices. So the Fed is once again feeding a housing bubble by not looking at it.

An unusually calm North Sea was the proximate cause of Europe’s energy crisis (see Europe Follows California Into Renewables Oblivion), but the loss of windpower has exposed years of underinvestment in conventional energy such as natural gas. Higher prices are an obvious consequence and are part of the climate extremists’ playbook. Shifting towards renewables was always going to lead to higher prices (see Is The Energy Transition Inflationary?). This provokes two big questions for markets: (1) will the Fed feel compelled to respond to energy-driven inflation as it becomes clear that it’s not transitory, and (2) does the jump in natural gas prices suggest that we need more supply, or will unreliable solar and wind benefit from improved relative pricing?

On the first question, we’d bet on the FOMC exploring every alternative explanation before concluding that inflation requires changes in monetary policy. They’ll be relieved to see that the sell-off in bonds is mostly driven by rising real yields. The market is adjusting to approaching cessation of Fed buying. Ten year implied inflation has remained in the 2.3-2.4% range.

The second question is more complicated. Investment in new oil and gas production has been declining for years. Rich world policies that discourage fossil fuels and climate extremists’ efforts have constrained energy sector capex. Today’s high prices are the result. Solar and wind power are incapable of filling the void. As Britain has discovered, intermittency remains a huge problem. Back-up battery storage still isn’t available on economic terms. Power grids require substantial upgrades. So, do policymakers correctly accept the inevitability of continued natural gas use for decades to come while seeking technological solutions to emissions, such as carbon capture? Or do they conclude we need even more renewables? Climeworks is a start-up company that sucks CO2 out of the air. It was profiled in a WSJ story describing OPEC’s expectation to gain market share through 2045, helped by global demand growth led by emerging economies and falling rich world production.

New Jersey is one state heading for poor choices. Earlier this week PennEast dropped plans to build a natural gas pipeline from Pennsylvania to New Jersey because of continued regulatory challenges. As a result, New Jersey customers will in years to come face less reliable power.

Public support for the energy transition is about to be tested by higher prices. Polls show voter support until it hits their wallets. Political leaders sure of their footing will embrace today’s energy prices as an important element of the transition.

Meanwhile, higher energy prices will feed into the broader inflation statistics in the months ahead.

We have three funds that seek to profit from this environment:

Energy Mutual Fund Energy ETF Inflation Fund


The Blogs You Liked, Part 1

Writers care what their audience thinks, and we monitor pageviews and comments to learn what resonates. For pipeline investors, a few months into the year it was looking like the mother of all bear markets. The sector had been persistently lagging the S&P500 since peaking in 2014, and pre-Covid the fundamentals were improving strongly. Fortunately, the recovery since then has repaired much of the damage to portfolio values, if not the emotional scars from extreme volatility. The American Energy Independence Index is –13% for the year, compared with –51% at the end of 1Q.  

In reviewing the year’s most popular blogs, they can be divided into (a) commentary on the energy market, and (b) politics, especially around climate change. Part one of this two-part, year-end review will focus on the market blogs. 

Most of all, investors want to understand why stocks are moving as they are. Pipeline stocks bottomed in March, and crude oil in April when it briefly traded at negative prices. Can An ETF Go Negative? looked at the United States Oil Fund, LP (USO)an ETF that provides exposure to crude oilIt’s a result of our Balkanized regulatory structure which separates stocks from futures. That the SEC and CFTC persist as separate entities is because their overseers are separate Senate Committees (Banking and Agriculture, respectively). Merging them would eliminate campaign contributions to one Senate committee’s members, a battle successive Administrations have avoided.  

Different oversight means different rules, so firms tend to offer either stocks or futures, but not both. Buying crude oil futures would be a more efficient way for oil bulls to express a view but preferring to keep assets at one firm they buy USO instead. USO then buys oil futures, increasing the friction for the ultimate investor. 

A regular theme is the diminishing importance of the MLP structure. The shrinking pool of MLP buyers, caused by serial distribution cuts, has reduced MLPs to only a third of North America’s midstream energy infrastructure sector (see The Disappearing MLP Buyer). It’s also created problem for MLP-dedicated funds, which are becoming increasingly concentrated in the few remaining names (see Today’s Pipelines Leave MLPs Behind and Are You In The Wrong MLP Fund?). 

MLP closed end funds offer a target-rich environment for criticism (see MLP Closed End Funds – Masters Of Value Destruction). As Warren Buffett said, if you’re not going to kick a man when he’s down, when are you going to? They are a dumb idea, and if they didn’t already exist no responsible fund manager would fill the void. Most recently, the Fiduciary/Claymore Energy Infrastructure Fund (sporting the delightfully inappropriate FMO ticker — Fear of Missing Out) announced an “income tax accrual adjustment” following “a further review and change in understanding” of the tax rules under which they operate. Markets and the tax code are too much for this hapless fund, -86% YTD 

In a year of superlatives, pipelines have surprised by maintaining strong growth in Free Cash Flow (FCF) despite the pandemic. During the collapse in transportation demand that culminated with April’s briefly negative crude prices, any FCF growth appeared implausible. Nonetheless, even by May the outlook was improving (see Pipeline Cash Flows Will Still Double This Year), and one of our most read pieces was from two days before the low (see The Upside Case For Pipelines). We were bullish then, but as regular readers know we usually are, so won’t claim any credit for foresight.  

The outlook remains very positive, with FCF expected to increase by a further 50% next year supported by lower spending on new projects. Incoming President Biden is likely to be an impediment to growth capex, a welcome development.  

  We are invested in all the components of the American Energy Independence Index via the ETF that seeks to track its performance.

Dividends on Pipeline Stocks Remain High

Markets finished the strongest quarter sine 1987 yesterday, led by the energy sector. The American Energy Independence Index, which comprises North America’s biggest pipeline stocks, is still down 29% for the year. Some investors are weary of years of underperformance against the broader market, combined with high volatility.

The volatility is largely a function of the investor base. In March, Closed End Funds (CEFs) that were forced to cut leverage at the lows added to the indiscriminate selling (see The Virus Infecting MLPs). Fund managers such as Kayne Anderson and Tortoise were to blame for not having the good sense to reduce risk earlier. The good news is that the consequent destruction of capital has rendered these CEFs less able to repeat, because they’re now a lot smaller.

Back in March, investors had many concerns about dividend sustainability. The top ten companies, which represent over half the sector’s $490BN market cap, all maintained payouts (Cheniere doesn’t pay a dividend). A recurring question we get from investors is, what’s the catalyst that will get stock prices higher? Putting aside higher crude oil, which usually coincides with improving sentiment, we believe the continued high dividend yields will draw in more buyers.

In Pipeline Cash Flows Will Still Double This Year, we explained how falling spending on new projects is driving cash flows higher. Covid-19 has produced few positives, but one of them is an acknowledgment by the energy industry that investing in new production and its supporting infrastructure needs to be cut. It may not be what executives want, but investors can find plenty to like about reduced spending.

In the next few weeks companies will report earnings and updated guidance. We don’t expect any of the biggest pipeline companies to cut dividends. Oneok (OKE) is probably the most at risk, but since they recently completed a secondary offering of common equity it would seem odd timing for them to cut.

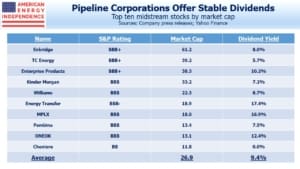
These top ten companies have an average market cap of $27BN and an average yield of 9.4%, including Cheniere. Every three months pipeline stocks pay in dividends more than two years’ worth of interest on ten year treasury notes. Energy has been too volatile, but the improving free cash flow picture that is supporting dividends contrasts positively with others. We don’t know of another sector that is going to double its free cash flow this year.

Conversations with investors continue to reveal widespread caution about the overall market. The news on Covid-19 is rarely positive, and many find it difficult to maintain a constructive outlook against this backdrop. But Factset is still forecasting 2021 S&P500 earnings to be flat to 2019, fully recouping the Covid-19 drop in just one year. This, combined with low bond yields, continues to drive long term investors into stocks (see The Stock Market’s Heartless Optimism and Stocks Look Past The Recession and Growing Debt).

The dividend yield on the top ten pipeline stocks is a staggering five times that of the S&P500. As investors become increasingly comfortable that these are sustainable, yields will be driven down by new buying. Earnings reports in the coming weeks will provide an important opportunity for companies to provide confirmation.

The Stock Market’s Heartless Optimism

Last week in our local paper, the Obituaries section ran to three pages. 17 people were listed. 14 of them were over 80, and three were in their 60s. The steady drumbeat of death, economic destruction and lockdown is why the stock market looks as if it’s divorced from reality. The S&P500 is only down 11.7% for the year, after being up 31% in 2019. In late March it briefly dipped below 2,200, where it registered -32% YTD. If instead it had simply spent the last four months meandering down to its present level, performance would be just moderately poor.

The stock market may not be right, but the collective outlook of investors is that we’re enduring an economic blip that will pass within a year or so. Bottom-up S&P500 earnings forecasts are for next year to be higher than last year – and 2021 earnings forecasts have already been revised 12% lower since January.

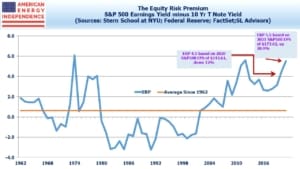
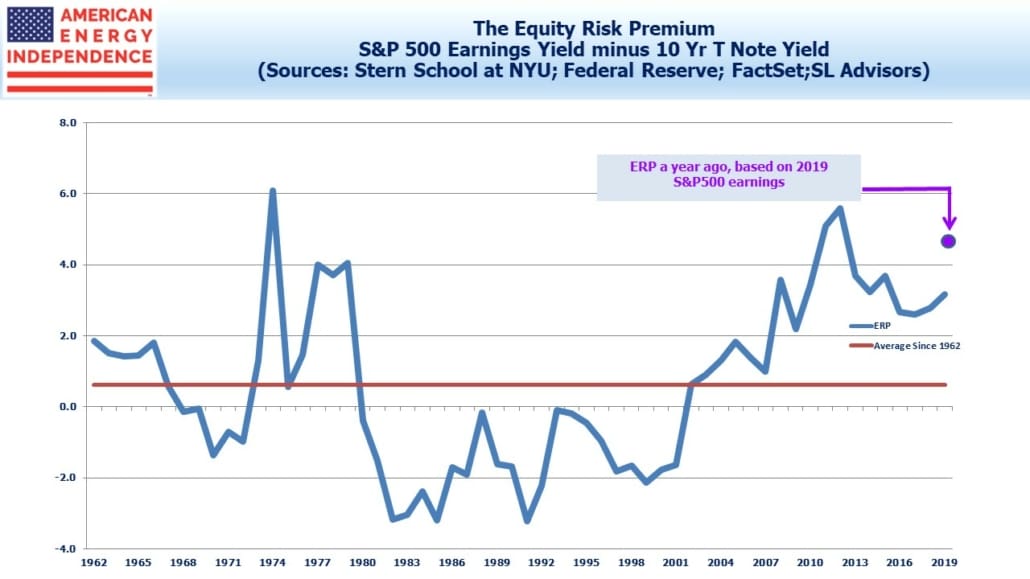
The news and the mood are terrible. The stock market is heartless, but is it also irrelevant? If earnings come in as expected next year – admittedly still a big “if” since revisions continue to be down – stocks are cheap. The Equity Risk Premium (ERP — S&P500 earnings yield minus ten year treasury yield) is at the levels of the 2008 financial crisis, even following a 27% rebound from the March lows. Unless 2021 earnings are revised down substantially, the relative attraction of stocks will draw them still higher. If the market keeps rising, the resulting headlines will coincide with, and perhaps cause, a lifting of the popular mood.

What is the cold-hearted analysis that’s reflected in today’s valuations? What follows is not a run at amateur scientist, for which we’re not qualified. It’s a virus-driven upside explanation for stocks.

As much as it pains me to write this, and with deep sympathy for the many families who have lost a loved one, the fact is that not that many people are dying. In two months, 50,000 Americans have died from Coronavirus. We probably undercounted somewhat at the beginning, and it’s likely the virus was killing people as early as January. We may be overcounting now, because if a patient dies with Coronavirus it’s more likely to be recorded as the cause of death even if they suffered from other, serious illnesses.

In 2018, the CDC reports 2,839,205 deaths in America. People are a bit more likely to die in the winter, but on average around 7,780 people die every day. Over the past two months, we would have expected just over 473,000 deaths anyway. The 50,000 Coronavirus-attributed deaths is, without doubt, 50,000 too many. But the demographics are by now widely known to be heavily weighted towards older people, just as in our local paper’s Obituaries section. The virus is denying as full a life as all these people deserve, but its lethality for younger people overwhelmingly relies on other serious health conditions.

One bright spot is that the most recently weekly CDC figures report only 62% of “Expected Deaths from All Causes”. This is partly because nobody is driving anywhere, so road deaths are down. On average, 730 people die every week in car accidents. The fortunate souls who are alive thanks to lockdown don’t know who they are, but they’ll be consuming products and services for many years to come.

The infection numbers are largely useless, because in the U.S. we’ve only tested 1.4% of the population and you generally have to be sick to get a test. 5.7% of those who tested positive have died, a catastrophically high figure. However, serology tests which look for antibodies as evidence of prior infection are implying that Coronavirus has spread much wider than as measured by reported infections. Lots of people suffer mild symptoms or even none at all (they are “asymptomatic”). Results from LA County and Santa Clara in California suggest the true infection rate is 50X higher in those regions. New York City estimates that 21% of its residents have been infected.

An infection rate fifty times higher means a fatality rate fifty times lower. At the outset, health professionals told us that the vast majority of us weren’t in mortal danger from contracting it. This seems to be true. Economically, that brings a return to new normal closer. The many constraints on our liberty and enormous economic damage have been imposed not to protect everyone, but to prevent the small percentage who will require hospitalization from overwhelming the system (‘flatten the curve”). Widespread compliance has been an enormously selfless act, but this has its limits and we’ll transition to more targeted means of protecting our most vulnerable citizens. Earnings forecasts dispassionately reflect that.

It also means that society will learn to live with Coronavirus long before everybody’s been vaccinated. This is not a widely held view. If the fatality rate is 5%, we’re all going to want a vaccine as quickly as possible. Shortening the testing period and taking some risks with side effects is a worthwhile trade-off. But if the fatality rate is less than a tenth of that, and maybe as low as the flu at 0.1%, widespread vaccination will occur at a more measured pace. Higher risk groups such as the elderly will derive more benefit, even from a vaccine that’s not been subjected to normal testing. But if you’re young and healthy, medical authorities will determine that the years-long testing schedule remains appropriate. A vaccine that’s used prematurely would lower participation in all types of vaccination program, creating a real health catastrophe. And many people may decide for themselves to wait until the Coronavirus vaccine has been widely used safely, with no meaningful side effects. Only half the adult population gets an annual flu shot. It could be several years before a Coronavirus vaccine reaches a sizeable majority of Americans.

Most pipeline companies have maintained guidance at or close to prior levels. Cuts in growth capex more than make up for lower expected cash flow from operations, which will support their free cash flow. Kinder Morgan raised their dividend by 5%. Other large cap companies including Enbridge, Enterprise Products, TC Energy and Williams (all members of the American Energy Independence Index) have maintained payouts, even though every company has a free pass on cutting dividends right now. Like the rest of big American business, midstream energy infrastructure companies are assessing their own outlook, and it’s not as dire as the news.

The virus could take an unexpected turn. We have no scientific insight to offer on that. But today’s market reflects today’s facts as we know them. Rather than the stock market not reflecting reality, maybe it’s telling us to be more optimistic.

We are invested in all the stocks mentioned above.


Washington-DC Based Energy Experts Offer Their Outlook

We had an opportunity to meet with a Washington-DC based independent research firm, specializing in energy policy and geopolitics last week.  The following is from our notes on their discussion.

On Iran, one principal, a highly decorated ex CIA officer and Iran expert, thought markets continue to underestimate the risk to oil infrastructure and production in the region. He expects tensions to increase in the months ahead, possibly leading to direct negotiations with the U.S. in 3Q20. He expects asymmetric attacks to resume once plans are approved by Supreme Leader Khamenei, with military confrontations in Iraq but energy infrastructure targeted elsewhere in the Middle East. He placed the odds of a major escalation at 25%, most likely as a result of a miscalculation followed by a disproportionate U.S. response (“Trump likely to hit back 10X”).

We would note that U.S. infrastructure assets should look relatively more attractive to investors in the scenario described above (see Gulf Tensions Back in Play).

On Libya, he noted that the lost output of 1 Million Barrels a Day (MMB/D) has had muted impact, because OPEC retains excess supply well in excess of that. He also thought that Saudi Arabia was willing and able to make further cuts if needed, as long as others are in compliance.

Contrary to consensus, he sees Venezuela increasing output to 0.8 MMB/D, because the current bottleneck is in marketing. The fact that the U.S. has allowed Chevron and others to continue business in Venezuela suggests a tacit acceptance of exports finding their way to market.

On Electric Vehicles (EVs), China recently cut EV subsidies but also relaxed restrictions on conventional internal combustion engine vehicles. This illustrates China’s preference for economic growth over reduced greenhouse gas emissions, something we’ve often noted (listen to our podcast China Keeps Warming the Planet). Another expert who specializes in energy policy matters also argued that technical requirements for mandated emission reductions in Europe render them unachievable, and that strong SUV sales will support gasoline demand.

The discussion turned to domestic politics and what changes could be expected with a Democrat in the White House (not currently anyone’s forecast). By contrast with Obama’s view on natural gas, which this policy expert regarded as relatively clean and a “bridge” fuel towards decades-long development of renewables, he noted that today’s Democrats view natural gas as just another fossil fuel. He predicted that a Democrat president would likely impose an immediate ban on new leases on Federal land. Current Gulf of Mexico production is 2 MMB/D, and onshore from Federal land is around 1 MMB/D.

Around 1/8th of natural gas is extracted on Federal lands, but this is more easily replaced with increased production on private acreage. He also expects a new administration would rescind existing permits on Federal land, and although courts would likely disallow this, resolution could take a while. Tighter rules on methane leakage and waste prevention are likely, which would eventually impede production on private land. The granting of infrastructure permits would become highly political, with FERC likely to become partisan. No new LNG export permits should be expected.

Democrat policies would likely reduce U.S. supply, exacerbating Middle East tension by increasing U.S. reliance on OPEC imports (see Energy Strengthens U.S. Foreign Policy).

Overall we felt there were several differentiated insights from the discussion and wanted to share them.

Pipeline Bond Investors Are More Bullish Than Equity Buyers

One of the most consistent bullish indicators for stocks has been the Equity Risk Premium (ERP) – the spread between the earnings yield on the S&P500 and the ten year treasury yield. At the end of last year, the S&P500’s 2019 earnings yield was around 7.2% (one divided the P/E ratio, which was then 13.8). With ten year treasuries at 2.8%, the ERP was 4.4, well above the 50-year average of 0.6.

The S&P500 is up 30% this year, and the P/E multiple has expanded to 18X next year’s  earnings (i.e. earnings yield of 5.5%). This has brought the ERP down to 3.6 — still favoring stocks, but not as clearly as a year ago. If treasury yields had remained at last year’s levels rather than dropping almost 1%, the ERP would be even lower at 2.7.

Since stocks look cheap, bonds must be expensive. Perhaps the biggest unanswered question facing investors today is why long term bond yields remain so low, and whether this is sustainable.

The return bond investors require over inflation, the real rate, has been in secular decline for thirty years (see Real Returns On Bonds Are Gone). Today’s bond investors are willingly locking in low and negative real yields – in many cases even negative nominal yields. Two compelling explanations are (1) inflexible investment mandates, and (2) fear of another 2008 financial crisis.

U.S. pension funds have raised their fixed income allocation even while yields have fallen, a counter-intuitive response to lower expected returns (see Pension Funds Keep Interest Rates Low). Hard evidence that investors are holding additional low risk assets as protection against a crash is harder to come by, but low yields certainly support that explanation.

Lower real yields on sovereign debt are a result of investors’ strong desire for bonds with negligible credit risk. But the fact that corporate bond yields are being pulled down by these same forces reveals a pricing inefficiency that equity investors can exploit.

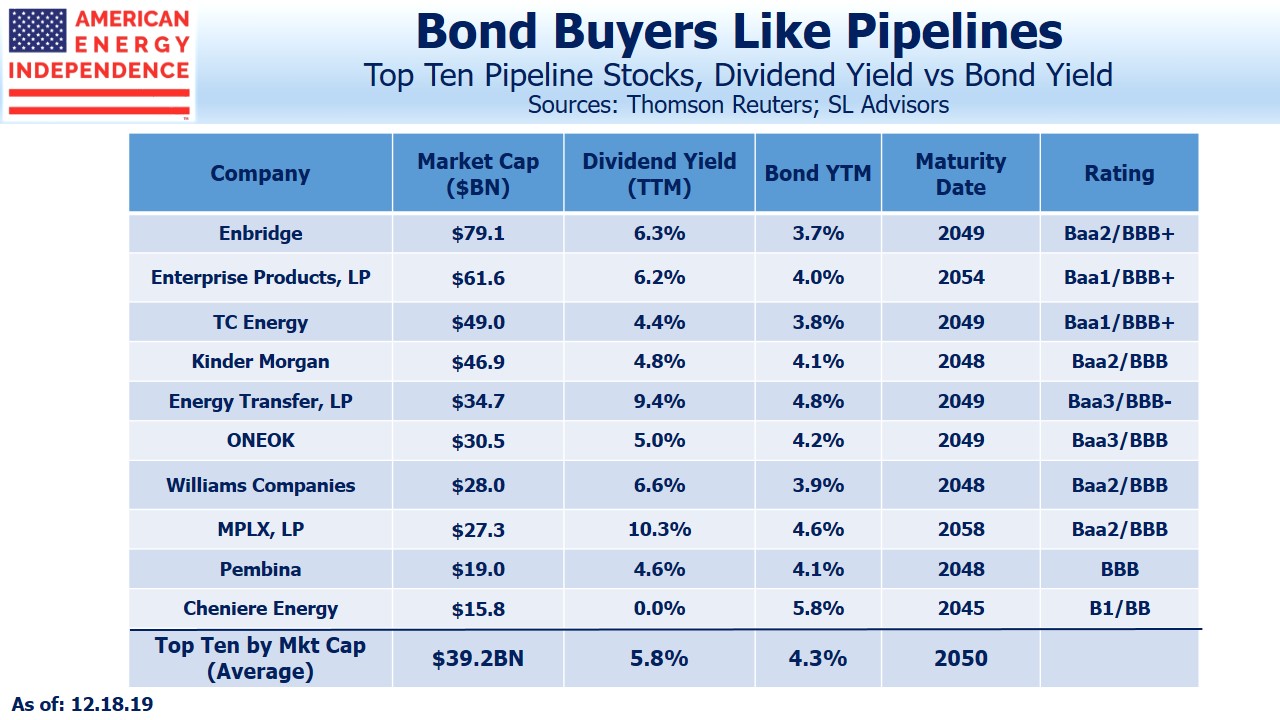
It’s most clear at the individual issuer level, where excessive demand for debt instruments is causing some interesting distortions. The table shows long term bond yields for the ten biggest North American pipeline companies, with an average equity market capitalization of $39BN.

They’re all members of the American Energy Independence Index, the broadest and most representative index of North American midstream energy infrastructure. These ten companies have outstanding bonds with maturities of 25-40 years. They are all investment grade, offering an average yield of 4.3%, which reflects a high degree of comfort with their credit risk over several decades.

By contrast, their equity dividend yields average 5.8%, 1.5% above their bond yields. And this even includes Cheniere Energy (LNG), which doesn’t currently pay a dividend (although they’re likely to institute one over the next couple of years).

Energy has been out of favor more or less since 2014, although stock price performance in December has been strong. These ten companies’ average dividend yield is almost 3X the 1.75% yield on the S&P500, reflecting substantial wariness about their prospects. And yet, bond investors don’t share the same concern.

Equity investors can earn higher yields than bond investors on the same issuer, in addition to enjoying likely earnings and dividend growth in the years ahead. Once equity prices reflect the positive outlook reflected in their long term debt, they’ll re-price higher.

Based on recent performance, that revaluation may already be under way.

We are invested in all the names mentioned above.

Private Equity, Private Valuations

Last week Cowen held a two day energy conference. Presenting companies included upstream and service providers, so although there were no midstream energy infrastructure companies present it provided useful background for current operating conditions.

Baker Hughes (BKR) is one of three large diversified services companies supporting the sector, along with Schlumberger and Halliburton. BKR CFO Brian Worrell provided an upbeat outlook following their recent spinout from GE. They cleverly describe themselves as a “fullstream” company (i.e., covering upstream to downstream). Listening to Worrell, it’d be hard to remember how negative investor sentiment is within energy. Consensus estimates for BKR’s 2019-21 EBITDA growth rate are 15%.

Worrell provided some interesting background on a partnership they have with AI firm C3. Predictive Asset Maintenance, one of their offerings, analyzes operating data from customer equipment to anticipate breakdowns, allowing repairs to be done pre-emptively. BKR is C3’s exclusive partner in the energy sector. They have 200 customers.

Another interesting theme was the influence of Private Equity (PE) investors. Independence Contract Drilling (ICD) is a micro-cap drilling company clearly wrestling with the downturn in shale-related rig demand. One participant asked if they’d considered a sale or merger. President and CEO Anthony Gallegos noted a recent negotiation with a competing privately owned firm which foundered when the PE backer insisted their drilling rigs were worth $18MM each while ICD’s stock price placed an implicit value of only $6MM for its similar equipment.

There’s plenty of evidence that PE firms assess more value in publicly traded energy sector equities than the public markets themselves. PE investments in midstream energy infrastructure have slowed down in recent months, although it’s still been an active year. But there are questions about valuation.

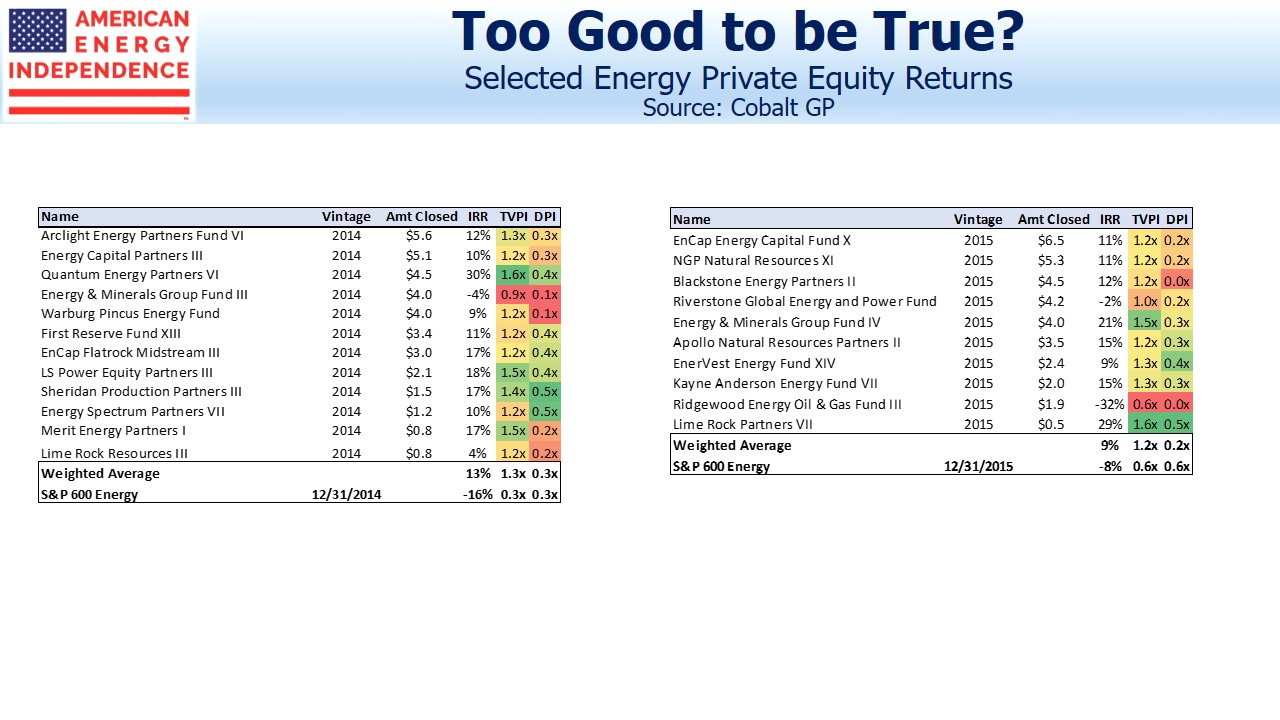
Energy-focused PE funds saw their highest inflows in 2014, when the sector peaked. This isn’t surprising, since fund flows invariably follow performance. But what’s odd is that fund returns since then are well ahead of the S&P600 Energy Index.

Although PE funds deploy capital over several years and likely made investments through the 2016 low, the recovery since then has been modest. It suggests that valuations are not rigorous – PE firms have a great deal of latitude in making estimates. Fees and the ability to raise subsequent funds both benefit from higher valuations.

PE energy funds continue to raise capital, supported in part by the returns they show on prior funds. The illiquidity of private investments is supposed to generate a modest return premium, but research from Cobalt GP reveals that so far these funds are claiming to beat public markets by 15-30%. Total Value to Paid In (TVPI) suggests these fund managers have chosen well, and is the basis for their IRRs. But Distributions to Paid In (DPI) are well under 1.0X even for funds that are five years old, showing that the IRRs rely heavily on the valuations of current holdings. As cash distributions increase, the time of reckoning will arrive when investors will learn how accurate these interim IRRs have been.

On a different topic, the magazine cover contrary indicator theory posits that when a topic or person becomes mainstream, interest soon peaks. Credit friend Barry Knapp, CEO and founder of Ironsides Macroeconomics, for being first to predict that high school dropout Greta Thunberg’s selection as Time’s Person of the Year likely marks a peak in interest in climate change.

image_pdfimage_print