A Hedge Fund Manager Trading At A High Yield

Many years ago, in a different investing climate and a different decade, a cut in interest rates was usually regarded as a stimulative move by the Federal Reserve. Lower financing costs were regarded as helping the economy more than hurting it. They certainly help the U.S. Federal Government, as the world’s biggest borrower. The amount of treasury bills issued at a 0% interest rate recently reached a cumulative $1 trillion. Although declining interest rates adjust the return on lending in favor of the borrower and at the expense of the lender, a lower cost of capital stimulates more borrowing for more investment and consequently boosts demand. However, the intoxicating nectar of ultra-low rates is gradually losing its potency, and while it’s overstating the case to say that markets would cheer higher rates, certain sectors would and the confirmation of an economy robust enough to prosper without “extraordinary accommodation” as the Fed puts it would be novel to say the least.

Several major banks released their quarterly earnings over the past week. Balance sheets continue to strengthen, but another less welcome trend was the continued pressure low interest rates are imposing on income statements. Deutsche Bank expects most major banks to report declining Net Interest Margins (NIMs) as older, higher yielding investments mature and are replaced with securities at lower, current rates. JPMorgan expects to make further operating expense reductions since quarterly earnings were lower than expected.

It’s a problem facing millions of investors. The timing of a normalization of interest rates, which is to say an increase, is both closely watched and yet seemingly never closer. If you look hard enough you can always find a reason to delay a hike, and the Yellen Federal Open Market Committee (FOMC) looks everywhere. Recent speeches by two FOMC members suggest a December decision to hike may not receive unanimous support. The FOMC’s long run rate forecasts continue to drop, as shown in this chart (source: FOMC).FOMC Rate Forecast Sept 2015

Income seeking investors are unlikely to find much solace in the bond market. As I wrote in Bonds Are Not Forever, when rates are punitively low, discerning investors take their money elsewhere.

Suppose you could buy equity in a hedge fund manager, a fanciful suggestion because they’re virtually all privately held. But suppose just for a moment that such a security existed. The question is, how should you value this investment? What multiple of fees to the manager would you be willing to pay or in other words what yield would entice you into this investment?

Hedge fund managers don’t need much in assets beyond working capital and office equipment; the assets they care about sit in the hedge fund they control. So let’s consider a hedge fund manager’s balance sheet which consists mostly of a small investment in its hedge fund, representing a portion of the hedge fund’s total assets, and a bit of cash. It has virtually no debt. Our hedge fund manager earns income from its hedge fund investment, as well as a payment for managing all of the other assets that sit in the hedge fund. These two revenue streams are roughly equal today and constitute 100% of the hedge fund manager’s revenue. The fees charged by the hedge fund manager for overseeing the hedge fund aren’t the familiar “2 & 20”, but are instead are currently 13% of the free cash flow generated by those assets and 25% of all incremental cash flows going forward. Moreover, the equity capital in the hedge fund is permanent capital, which is to say that investors can exit by selling their interests to someone else but cannot expect to redeem from the hedge fund. Meanwhile, our hedge fund manager can decide to grow his hedge fund and thereby his fee stream for managing its assets by directing the hedge fund to raise new capital from investors. This represents substantial optionality to grow when it suits the manager by using Other People’s Money (OPM). This hedge fund’s assets are not other securities but physical assets such as crude oil terminals, storage facilities and pipelines. The hedge fund is returning 9% and is expected to grow its returns by 4+% annually over the next few years.

The hedge fund manager in this example is publicly traded NuStar GP Holdings, LLC (symblol: NSH), the General Partner (GP) for NuStar Energy, LP (symbol: NS). NSH, by virtue of being the GP of NS and receiving Incentive Distribution Rights (IDRs) equal to roughly 25% of NS’s incremental free cash flow, is compensated like a hedge fund manager. NS, a midstream MLP,  is like a hedge fund, albeit the good kind with far more reliable prospects and greater visibility than the more prosaic kind, whose returns have generally remained poor since I predicted as much in The Hedge Fund Mirage four years ago. To return to our question: at what yield would you buy this hedge fund manager’s “fees”, given its option to increase the size of its hedge fund, the hedge fund’s respectable and growing return, the permanence of its capital and the perpetual nature of its substantial claim to the hedge fund’s free cash flow? NSH currently yields 7.6% which should increase ~10% annually over the next several years based on the company’s capex guidance at NS.

We are invested in NSH.


Hedge Fund Manager Runs Drug Company…

In time we may all owe a debt of thanks to Martin Shkreli, CEO of Turing Pharmaceuticals and a former hedge fund manager. Their 5,456% increase in Daraprim brought attention to the the importance of regular price hikes in driving revenue growth at major drug companies. The Wall Street Journal later noted that almost 80% of the increase in the top line for the manufacturers of 30 top-selling drugs came from raising prices versus increasing volumes. It strikes me that this may just become a political issue in the U.S., especially heading into an election year. High drug prices affect millions of Americans and it’s easy for the media to find some poor individual whose needed medication has suddenly tripled in price. Hilary Clinton’s infamous “price gouging” tweet shows that the issue easily lends itself to sound bites, a necessary condition to retain media interest. Big pharma represents a fairly easy target. Congressional hearings no doubt loom for companies such as Valeant (VRX), whose business model relies on testing the limits of the market’s acceptance for price hikes. They operate as a ruthless capitalist in a market where the laws of economics routinely fail, since customers (patients) are rarely informed buyers and typically incur the expense not directly through paying the asking price, but indirectly through consequently higher health insurance premiums or ultimately higher taxes. One friend told me he holds an investment in health care stocks as a hedge against rising medical expenses for him and his wife, an unusual yet insightful approach.

A common refrain from drug companies  is that high drug prices (and the relatively unregulated U.S. market has the highest) allow money to be reinvested back into R&D. This is a weak argument. If research has a high enough IRR, it can be funded through capital from the public and private markets; it doesn’t have to be through retained earnings. It’s just as likely that the ability to charge whatever they can dramatically increases the IRR on R&D. High drug prices themselves makes the R&D more worthwhile than it would be otherwise.

We don’t invest in healthcare stocks, as might be apparent. Therefore, to the extent we run investment strategies that are benchmarked against the S&P500, we are effectively short the health care sector, which has outperformed the S&P500 for the last three years and remains on pace to do so again in 2015.  The issue of drug pricing isn’t likely to recede soon though, and maybe health care stocks will start receiving some of the opprobrium so routinely heaped on banks and oil companies. The energy sector is due for a break as most out of favor.

Martin Shkreli used to work at a hedge fund, and he would probably like the economics of the General Partner (GP) in the MLP sector too. Targa Resources Partners (NGLS) is an MLP whose business is divided between the midstream activities of Gathering and Processing (G&P) of crude oil and natural gas across the central U.S., and downstream activities of Marketing and Distribution. NGLS recently provided guidance for 2016 that included flat distribution growth, reflecting the more challenging environment for some energy infrastructure businesses. However, as the hedge fund is to the hedge fund manager, so is NGLS to Targa Resource Corp (TRGP), the GP of NGLS. The same guidance projected 15% dividend growth at TRGP. Flat returns for hedge fund clients rarely hurt the hedge fund manager, and so it is at TRGP whose Incentive Distribution Rights (IDRs) are at the 50% level, entitling it to half the Distributable Cash Flow from NGLS, the MLP it controls through its ownership of the GP and IDRs. TRGP currently yields  6.3% on its forecast $4.12 2016 dividend, and with a market cap of $3.7BN is of sufficiently modest size to be of interest to many potential acquirers.

We are invested in TRGP.


Why MLPs Did What They Did in September


In September Master Limited Partnerships had a tumultuous month. On September 29th, one day before month’s end, we were looking at the worst monthly performance in the history of the Alerian Index. A strong recovery on the 30th reduced the damage somewhat, but MLPs have had a terrible year and September was nonetheless awful.

Why the market did what it did is far and away the most common question we receive. We’re not market timers and so don’t devote much effort to figuring out near term direction. But people want to know, and we’ve developed a narrative that we think explains recent sharp moves.

Regular readers of this blog are used to me attempting different ways to say the same thing, which is that MLPs are cheap. In September they became cheaper still. If you need reminding of the case, you might peruse recent posts such as Why MLPs Make a Great Christmas Present, Listen to What the Oil Price is Saying, or MLPs Now Look Attractive Relative to Equities. The Alerian Index yields 8%. The case remains, even while prices have dropped. On Thursday, Enterprise Products Partners (EPD), a $72BN enterprise value midstream MLP with significant crude oil and Natural Gas Liquids business, declared a $0.385 quarterly dividend. This represented a 5.5% year-on-year increase and their 54th distribution increase since going public in 1998. It yields 5.56%.

Our Separately Managed Account (SMA) clients remain steadfast, and we have seen inflows from existing and new clients in recent months. Mutual fund clients vary a little more. Many are long term investors focused on understanding the fundamentals and therefore unwilling to let market fluctuations shake them unless supported by altered business conditions. But some do rely on recent price movements to support their conviction, or put another way lose confidence when prices are falling.

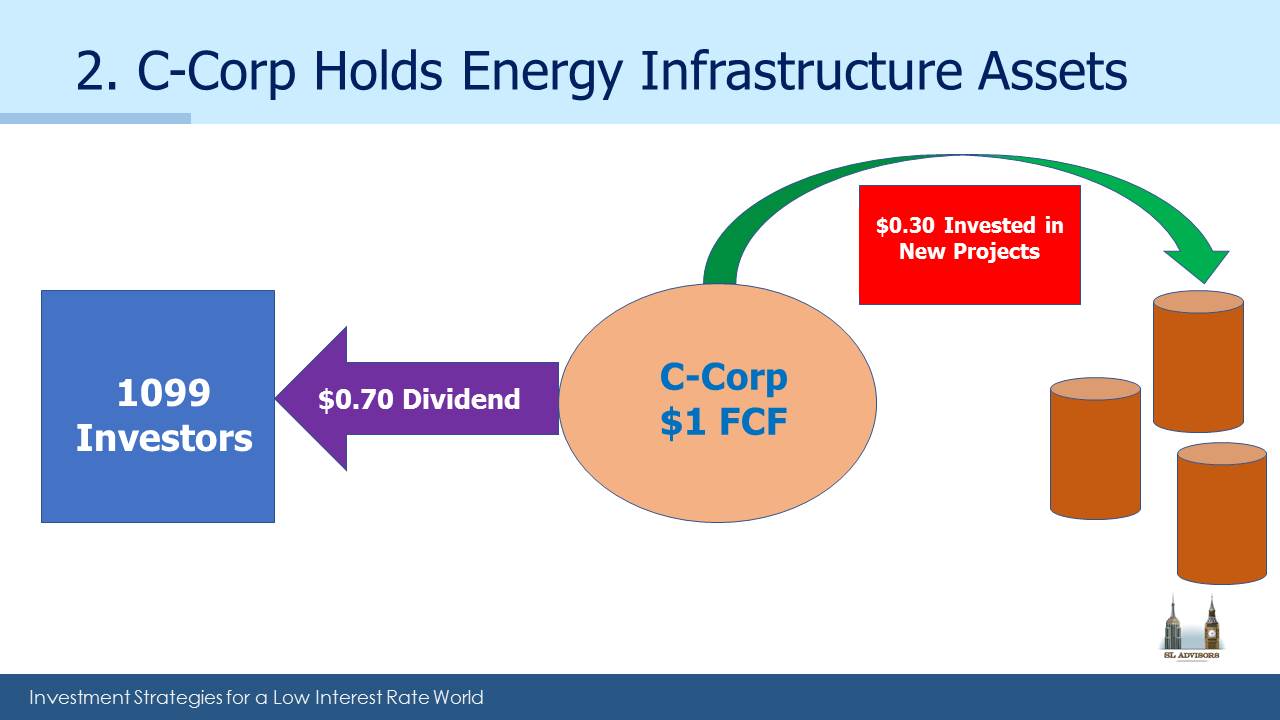
It’s clear in the many quarterly account reviews with clients for which Financial Advisors (FAs) are preparing. The third quarter hasn’t been pretty for investors generally; MLPs simply represent the more extreme type of adversity being faced. Some $60BN in mutual funds, ETFs, ETNs and closed end funds exist to provide MLP exposure to retail investors without those dreaded K-1s. Not all these funds are poorly structured, but many are. Owning MLPs via a C-corp structure offers the desired exposure with the simpler 1099 tax form, albeit with the highly unattractive feature of a 35% corporate tax liability (see The Sky High Expenses of MLP Funds).

Expense ratios of as high as 9% are somehow an acceptable price for the K-1 averse would-be MLP investor. The 35% tax roughly means you get 65% of the return. It’s therefore reasonable to assume that the holders of such securities, or the FAs who select them on their client’s behalf, are not the most discerning investors. It’s unlikely they spend much time examining the underlying holdings and their distribution yields, growth rates and capex plans. These are the investors for whom investment analysis begins and probably ends with a price chart. Year-to-date performance for 2015 that was by September 29th -35%, close to equaling 2008’s -36.9%, was challenging for a great many of these.

Fund flows have clearly been negative, supporting the notion that fund sellers have been an important factor in recent weakness. Barrons noted that closed end funds were forced to sell because they were hitting their leverage limits, an example of the stupidity of investing with borrowed money whether you’ve done so directly or through your choice of fund. Moreover, indiscriminate selling of MLPs across the sector bore out the wholesale exit by a certain class of holder. Some writers inferred the market’s rejection of Energy Transfer Equity’s (ETE) acquisition of Williams Companies (WMB) when it was finally announced on the morning of Monday, September 28th. But there was very little new in the ultimate transaction that wasn’t already widely known the Friday before. So why was Energy Transfer Partners (ETP) down 6.5% on Monday? All that changed was that ETP would now be able to connect its pipeline network in useful places to the WMB network. ETP isn’t otherwise involved in the transaction, controlled as it is by its GP, ETE. We are invested in EPD, ETE and WMB.

We think there are a couple of other explanations. One is that the Deferred Tax Liability (DTL) on many of the poorly structured MLP funds came close to flipping signs, as unrealized gains evaporated with a market that had wiped out three years’ prior returns. The consequence of a taxable MLP fund moving from an unrealized taxable gain to an unrealized taxable loss is that they no longer have a DTL. Its mirror, a Deferred Tax Asset (DTA), which might be expected to act like a net operating loss in that it creates a potential future tax benefit, can’t exist for open-ended funds. Hence the Alerian ETF (AMLP) began offsetting its DTA with an equal but opposite “Valuation Allowance”. It’s likely that most if not all taxable MLP funds could be shown to have reached this state, if they published such figures on a daily basis like AMLP. Taxable MLP funds that cross from a DTL to a DTA expose their holders to 100% of the downside (since there’s no longer a DTL cushion) but only 65% of the upside (since gains remain  taxable). Some of these funds started showing daily returns equal to the index on down days, a truly unpleasant asymmetry for many investors, and no doubt an additional inducement to sell for those paying attention.

Many FAs we’ve talked to have been concerned about upcoming quarterly account reviews with clients, since although MLPs had a terrible quarter many other sectors were weak as well. September 29th was the last day when you could sell an underperforming fund so as to keep it off the quarter-end client statement. Discussing a tough quarter can be easier if the offending investments are no longer in the client’s portfolio. The market certainly behaved as if indiscriminate selling climaxed on that day. If MLPs were private and investors had to form opinions by studying their financial statements instead of looking at a stock chart, there wouldn’t be much of a story.

The chart below compares the Alerian Index from its peak preceding the 2008 Crash with its current path from the August 2014 peak. We’ve come down a long way.

MLPs Comparing Bear Markets V2


Why MLPs Make a Great Christmas Present

Using such a cheery headline following the week MLPs have had will tempt wisecracks that Christmas tree baubles might be better investments than MLPs. Nonetheless, your blogger is looking beyond the latest round of forced selling and taking the longer-term view on returns. It is likely that buyers better understand the values they are getting than sellers do the values they are rejecting. Midstream MLPs with little or no crude oil exposure have seen their equity prices fall. Even StonMore (STON) an MLP in the “deathcare” business, has revealed unexpected linkage between WTI crude and dying. It is in any case hard to explain recent moves beyond noting that sellers evidently seized their task with greater urgency than buyers.

Seasonal patterns in financial markets can draw great interest. The January effect in stocks is well known if less commonly experienced; other folklore includes the adage to avoid selling on Mondays (presumably because a weekend of stressing over a poor investment induces action as soon as possible). As is often the case with statistics, identifying correlation without causality will part many a superficial investor from his capital. There needs to be an economic explanation for an effect for it to mean anything.

Many investors plan their allocations around year-end, but this is especially so for retail investors for whom Christmas offers some time to contemplate finances while recovering from an excess of merriment and (perhaps) family togetherness. Master Limited Partnerships (MLPs) remain widely held by individuals; hence the seasonal pattern they exhibit is both valid and pronounced.

A dilemma for investors is approaching. As we close in on only the second worst year in the history of the Alerian Index (since January 1996), do they forget the pain so far and add, or lick their wounds and wait. The average monthly return on the Alerian Index is 1.17%, although 2015 provided numerous results inferior to that. November is seasonally the worst month, with an average return of -1.0%. December tends to be average, but January averages +4.3%. On average, being invested only for the two months of December and January provides over a third of the annual returnMLP Seasonals.

Of course, there’s always more detail to consider; November’s average return is the worst because it includes November 2008’s -17.1% drubbing. That month alone knocks the November average down by 0.27%. Then again, January’s average is helped by the January 2009 result of +15.25%, which adds 0.55% to January’s average. You can of course include and exclude months variously and get different results, the validity of which is to a person’s taste.

Nonetheless, the clear pattern is that MLP investors tend to buy (or sell less) in the first month of every quarter. This is probably because it coincides with quarterly distributions. The quarterly affect is magnified by the turning of the calendar.

Around this time of year, we advise MLP clients that if they’re contemplating making a commitment the seasonals suggest doing so in November, when prices are weak. If you’re a seller it makes sense to wait for January, since so few sellers seem to be available then.

The seasonals have not worked so well the last couple of years. Whether this is because they’re now so well known that they no longer work won’t be clear for a while longer. However, I’d bet that the universe of MLP sellers waiting until December or January to act is fairly small. If the recent price dislocations didn’t yet force you out, you’re probably in for the very long run. By contrast, the paucity of available sources of yield should draw reallocations towards a very cheap sector from investors digesting their Christmas dinner and pondering where their 2016 returns will come from.

Please remember that past performance is not indicative of future returns.


Rate Hike Or Not, The Same Problems Persist

On May 22, 2013 then-Fed chairman Ben Bernanke inadvertently added “taper tantrum” to the lexicon of terms used to describe the impact of the Fed’s activities. That date marks the formal beginning of the Fed’s efforts to prepare financial markets for an eventual tightening of policy — or the start of the removal of accommodative policy, to use their description. In the belief that transparent policy deliberations reduce the possibility of a monetary surprise with its consequent financial market upheaval, the Fed’s public statements, release of projections and even the ubiquitous “blue dots” showing the rate forecast of each FOMC member have all been provided to help us. In fact, for almost four years I’ve been constructing an “FOMC Futures Curve”, which is what short term interest rate futures would look like if FOMC members were the only participants. It’s been absorbing for brief moments around four times a year when they provide updated information. Many might find it a nerdy preoccupation, but having spent a good part of my career in Fed-engineered darkness over their intentions, the shift to greater openness begun under Greenspan has been fascinating.

Forward guidance presumably is intended to let us know what the Fed will do before they do it. As we head into a two-day FOMC meeting on September 16-17, opinions are evenly split about whether they’ll raise rates. Perhaps we ought not to be surprised in either outcome, but it seems to me that if there’s no consensus after years of openness, the communication strategy has failed. The problem with providing meaningful forward guidance is that it involves a commitment, and a commitment reduces your ability to change your mind. The window into the Fed’s deliberations has simply revealed that they want to retain maximum flexibility until the day they meet. Announcing a hike with a delayed effective date would soften the blow (see Advice for the Fed) but it’s too late for that.

Following the FOMC’s announcement and the elimination of near term uncertainty, investors will be faced with the same dilemma as before: how are they to invest so as to preserve the purchasing power of their assets after taxes and inflation? Whether ten year treasury yields move up 0.25% or not this week, the paucity of assets offering acceptable returns will remain Dilemma #1.

Suppose a taxable investor visits her financial advisor with the objective of constructing a portfolio with a 6% return and moderate risk. Assuming our investor is facing a 30% average tax rate (combination of Federal and state taxes on capital gains, dividends and ordinary income), a pre-tax 6% is 4.2% afterwards. 2% inflation (the Fed’s target) knocks that return down to 2.2%. Then there are the advisor’s fees, and the possibility that returns won’t be as hoped. 6% doesn’t seem that demanding given all of this, and yet the building blocks with which to achieve it are limited.

Public equities yield around 2%, and assuming the fifty-year average dividend growth rate of 5% prevails (for a total return of 7%), stocks clearly are part of the portfolio. Bonds (as defined by the iShares Aggregate Bond ETF which tracks the Barclays Aggregate Index) yield 2.4%. Since the yield at which you buy a bond heavily impacts your total return, it’s going to be hard to do much better than 2.4% with investment grade debt. Moreover, the ability of bonds to offset a falling equity market is limited given their already low yields. Backward-looking models may justify them, but to us they look like returnless risk. Moving up the risk spectrum to High Yield gets you 5.5% (as defined by the iShares High Yield Corporate Bond ETF). There is some chance for capital appreciation — but this year capital losses have more than wiped out coupon income reflecting the preponderance of energy names in the index.

REITs yield 4.4% (as defined by the Vanguard REIT ETF), and this, combined with some modest growth may deliver a return that at least equals the investor’s 6% target.

Regular readers can by now guess where this is going. The Alerian MLP Index, yields 7.25%, and MLP distributions even grew in 2009 following the financial crisis. However, MLPs are down 23% so far in 2015. In fact, they’ve fallen that much since the end of April, creating an unpleasant backdrop to an otherwise glorious Summer for anyone more than tangentially involved.

There is a bear story to MLPs, as those prescient enough to sell at the highs of August 2014 well know. A 33% drop can’t happen without a fundamental story, and the collapse in oil is challenging the expected production growth of U.S. shale plays with its attendant reduction in needed infrastructure. The growth story that has driven MLP prices is in doubt.

It’s therefore instructive to examine metrics on a number of businesses as they were in August 2014 and how they appear today. The table below shows forecasts for 2016 distributions from selected MLPs (chosen unscientifically because we are invested in them or the General Partners that control them), and shows how those 2016 forecast distributions have changed from the market peak in MLPs 13 months ago to now. The data is from JPMorgan but such figures are typically heavily influenced by company guidance.

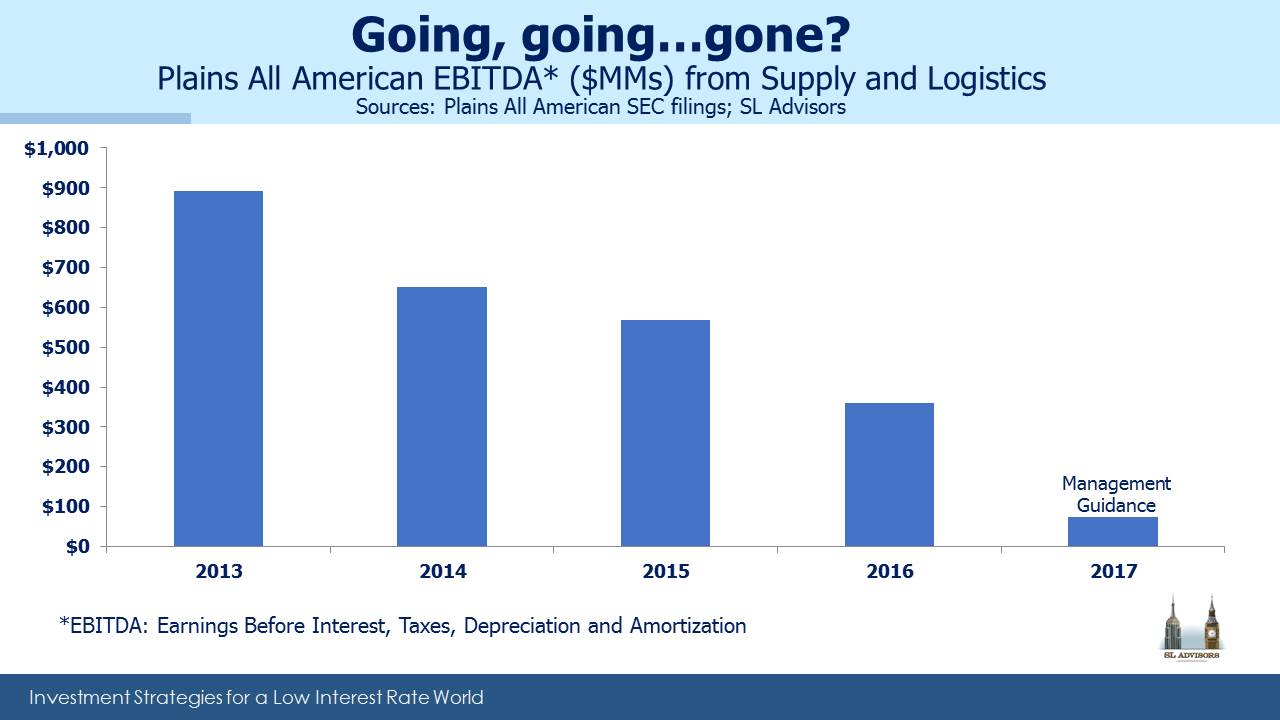
Looking at the numbers, you certainly wouldn’t think we’d seen a collapse in oil. The 2016 forecast distribution for this group is modestly lower at $2.90 (cap-weighted) versus $2.99 a year ago. The market cap of these companies (excluding Kinder Morgan since during the intervening period it combined with its two outstanding MLPs to create a substantially larger entity) has fallen by 16%, hence the 2016 yield has risen from 5.2% to 6.8%. Just looking at the General Partners in this group (KMI, OKE, PAGP and WMB) provides a similar result. The operations of these firms and their cashflow generating abilities have on average not shifted that much. Plains All America (PAA) and its GP (PAGP) have seen forecast reductions because of their crude oil exposure. The same is true of Oneok (OKE).

But overall, the fall in their security prices has simply driven up their yields. These names are representative — they’re all midstream, which is to say they operate toll-like business midels with limited direct commodity exposure. There are MLPs concentrated in Exploration & Production (upstream) and others that run refineries (variable distribution MLPs), but we don’t care about those.

So for the investor seeking a 6% portfolio return, the most compelling reason to exclude MLPs is the 23% drop since April which has made few people happy. However, looking beyond the undoubted voting by many investors who have abandoned the sector, 7% yields combined with 8-9% growth rates (the cap-weighted forecast on the group of names listed) seems pretty compelling for long-term investors willing to look beyond recent price action and focus on the fundamentals by including MLPs, perhaps even with an overweight, in their portfolios.

MLP Distribution Forecasts September 11 2015 V2


Listen to What The Oil Price Is Saying

The collapse in oil prices was the dominant story of 2014, and it’s shaping up to be the dominant story of 2015 too. In the popular narrative, development of unconventional shale oil and natural gas in the U.S. has led to a supply imbalance. Saudi Arabia has decided to inflict a lesson on the upstart E&P producers by allowing the price of oil to collapse, thus rendering so many of these new plays uneconomic with the presumed long run objective of regaining a more dominant market position in the future as the newbies are forced to cut production. The Saudis are playing the long game.

There’s little doubt that increased North American production has led to the supply/demand imbalance. In terms of the Saudi objectives, I’ll leave it to others more oriented towards World Petroleum Supply Growth PAA June 2015conspiracy theories to speculate. What follows is an insight drawn from production and price data.

The first chart is from an investor presentation by Plains All America (PAA) several months ago. We’ve used it once before. Global oil demand has been growing at around 1 MMB/D (million barrels per day) for the past few years, and the increase in supply necessary to meet this has come entirely from the U.S. and Canada. As we know, the increase in supply has in fact been more than was needed to meet growing demand, hence the price collapse.

Sources of oil supply are not static. Oil fields achieve peak production and then face a steady drop. The argument about Peak Oil has revolved around the ability of E&P companies to replace what’s being used. Decline rates, which are the rate at which production drops, vary around the world, but the consensus is that we currently face decline rates of 5-6%. For example, the UK Energy Research Center issued a report in 2009 which supports this type of assumption. Although more recent analysis would be good, the numbers are unlikely to have shifted that much. If anything, because tight oil (i.e. shale) has faster than average decline rates the global decline rate may even be modestly higher.

In other words, today’s oil fields globally can be expected to produce 5-6% less next year than this. The shortfall plus the demand growth (roughly another 1.5%) is made up by new discoveries coming on stream. Obviously we’re getting rather better at covering this shortfall, which is inconvenient to say the least if you rely on high crude prices. Saudi Arabia, Russia, Venezuela and many E&P companies are worse off, while the rest of us are better off. Energy sector investors may not feel quite so sanguine, but regular readers are already bracing for another plug for MLPs. You will not be disappointed. Oil Curve August 2015

Now consider the oil futures curve. Regardless of whether or not it represents a  correct forecast, it does reflect the aggregate opinion as expressed through hedging activity of all the participants in the oil business. The key point to note here is that even when you look beyond the spot price of around $40, crude oil (this is a chart of WTI; Source: CME Group) is priced at $60-65 five or more years out. This is the price that market-driven investment decisions should be based on when evaluating new projects.

Oil charts don’t speak, but this one does contain more information than simply the forward price. In any market, the price of the commodity must lie at the cost of the marginal producer. Economic theory holds that at $60-65 there will be just enough economic profit to induce production of the last barrel of oil necessary to ensure supply satisfies demand. It’s not just spot oil that has fallen, but the entire oil curve. A year ago the five year out price was $90-$100. Interestingly, for the last few years this price was not far above where many believed the breakeven cost of U.S tight oil production in the major U. S basins thus naming them as the marginal (high cost) producer.

So consider where this marginal barrel of oil is going to come from. At $100 oil, all of the increase in supply for the past few years came from North America. The rest of the world was, in aggregate, unable to increase production by anything other than what it took to offset decline rates. That was at $100. Logically, the rest of the world will do no better at new production with the reduced inducement of $60. In fact, one of the few places in the world where production costs are falling is in North America, specifically across many of the shale pays in the U.S. Shale marginal costs have uniquely moved lower in step with the oil price forward curve and are now under $60/barrel as infrastructure build out into the plays has lowered costs along with reduced drilling & completion costs and improved well productivity.

If domestic oil production in the U.S. is expected to be choked off by uneconomically low prices, the oil curve should be far steeper. The price five years out should reflect the marginal cost that would prevail with a substantially smaller contribution from the U.S. If the Saudi strategy (for you conspiracy theorists) is working, the forward price five or more years out ought not to be much lower than it was a year ago, since you would assume most commercially driven shale producers would be unwilling to sustain operating losses over this time.

But the forward price is not at $100, and if you then ask where much of the new supply will come from to replace decline rates plus new demand, the answer has to be the same place net new supply has been coming from, which is the U.S. And don’t forget that falling oil prices have also led to a demand response as it’s cheaper to drive and refineries are running at very high levels of utilization. The inevitable conclusion from the oil curve is that the U.S. will gain market share, because the price curve can only plausibly accommodate the recent source of increased supply as the marginal supplier. Therefore, if you’re in the U.S. energy infrastructure business, this expected increase in market share for domestic production must be a good thing.

Of course, an alternative interpretation is that the U.S tight oil is unable to grow production enough to cover the difference and the forward oil price is then too low. I imagine Saudi Arabia must believe, or at least hope, that this is the case. If $40 reduces enough investment by domestic E&P companies such that U.S. oil production falls, the forward price will rise to where non-U.S. producers can provide the marginal barrel. But as the first chart shows, the price that prevailed from 2011-2014 wasn’t high enough to induce such activity. Moreover, costs for shale plays are falling rapidly as E&P companies squeeze service providers for lower pricing. The Saudi strategy, if there is one, is too late.

So either the U.S. will gain market share in the global oil market, or the forward curve is wrong. Neither outcome seems that bad for MLP investors, who benefit by building the infrastructure to handle increasing production..

I often note that my partner Henry is responsible for most of our good ideas and none of the bad ones. So if you like this insight, credit him, and if you think it’s off the wall you should assume it was my idea.


MLPs Now Look Attractive Relative to Equities

A persistent problem for investors is constructing a balanced portfolio with an acceptable risk/return profile when Fed policy has rendered bonds an impractical component. Indeed, much of our business at SL Advisors revolves around providing solutions to this problem. High yield bonds, the closet equity refuge of many fixed income investors willing to move out along the risk spectrum somewhat, have long been bested by Master Limited Partnerships (MLPs). In fact, we’ve often shown clients that MLPs can be a great substitute for High Yield since it’s the asset class with which they’re most highly correlated whereas their returns have been much higher and are likely to remain so.

However, the use of MLPs as a fixed income substitute has not looked so clever of late. The asset class sported a -32% total return from its peak a year ago until very recently. Following a modest bounce, MLPs are now 28% off their all-time highs (including distributions), and -17% YTD. Only 2008 was a worse time to be an MLP investor, and pretty much everything was going down then whereas the broader equity indices are currently close to all-time highs. So one must concede that the case for using MLPs as a fixed income alternative has been weakened as a result of their correlation with crude oil and its concurrent 50% slide.

Although MLP prices have fallen, distributions have continued to grow. Credit Suisse recently noted that midstream MLPs had increased their distributions at 7.8% year-on-year. The yield on the Alerian Index now exceeds 7%. This set of circumstances makes MLPs now a compelling equity substitute, given the return prospects.

In constructing a portfolio, each asset class requires an expected return, volatility and co-variance with the other asset classes. These three inputs allow for a forecast portfolio return to be estimated along with the range of possible outcomes. Of course it’s only as good as the inputs. In such an exercise, expected bond returns would have to be 1-3% since that’s where yields are today. Public equities have a wider range of plausible returns. Given the 2% dividend yield on the S&P500 and 5% dividend growth (the fifty year average), a 7% total return (i.e. dividend yield plus growth) is an acceptable long run forecast of equity returns although reasonable people could certainly differ over this.

This is where MLPs can represent an alternative, not necessarily to the fixed income allocation since their recent volatility has weakened the case as noted, but to the equity component. The price drop in MLPs has raised their expected return, since distributions have continued to grow. The 7% yield on MLPs compares favorably with the expected return on public equities noted above without any assumed distribution growth for MLPs. Over the last ten years, MLP distributions have grown at 7.4% annually, similar to the last year. Even assuming growth of half that level, you still get a 10% total return.

For the long term investor willing to look beyond near term price gyrations, the case for using MLPs as an important component of the equities portion of a portfolio is starting to look compelling.


MLPs Misbehaving

I’m currently reading Misbehaving: The Making of Behavioral Economicsby Richard H. Thaler. It’s a fascinating book that tells the story of the development of Behavioral Economics as a discipline, and a constant theme is the ongoing debate with his academic colleagues who adhere to the Efficient Markets Theory (EMT). Basically, EMT holds that security prices reflect all the available information and are therefore “correct” in that there’s nothing to be gained from trading or even holding an undiversified portfolio. All market participants are assumed to be perfectly rational, or at least the emotional ones are assumed to be irrelevant, perhaps because their irrational behavior has bankrupted them. Lots of people disagree with this informally, as evidenced by the enormous volumes of trading that take place every day. By contrast, Behavioral Economics as a field holds beliefs that are directly at odds with EMT, and its development has spurred a lively debate between the two camps. Behavioralists acknowledge that market participants are human and therefore make human, irrational decisions regularly. Exhibit One in the case against EMT might be the 1987 stock market crash when equity markets dropped over 25% in a single day without any meaningful news. If a stock price reflects the net present value of all the future cashflows derived therein, did their aggregate value truly fall by over a quarter one day? Few would argue that they did.

Less dramatic examples of this EMT violation occur regularly. In fact, I was reminded of this just last week during another period of falling MLP prices. Earnings reports from the sector have generally been unsurprising and solid, although this has not stopped prices from falling. Last week Plains All American (PAA) reported earnings that were only marginally weaker than expected. However, during the subsequent conference call PAA CEO Greg Armstrong warned that it was possible PAA would hold its distribution flat (i.e. not grow it as is the norm) so as to allow their distribution coverage to return to more conservative levels.

This was clearly a mildly negative comment, a piece of fundamental news that might well justify a modestly lower price for PAA and its General Partner Plains GP Holdings (PAGP). Investors and traders (sometimes they seem synonymous) reacted by driving the prices of both securities and the MLP sector down relentlessly. PAA finished the week 15% lower, and PAGP an astonishing 31% lower. Plains has one of the most respected management teams in the industry and a reputation for conservative stewardship. Our interpretation of the call was that flat distribution growth was a downside case rather than their guidance: possible, but not currently their Base Case. However, market prices moved to levels that reflect a far more dire outcome, pushing the yield on PAA up over 8%. PAGP meanwhile, which has no net debt and participates in PAA’s growth without ever having to provide capital to fund it, yields over 5% which is not such a bad return even if the distribution never grows. But it assuredly will as PAA grows its EBITDA and drops new projects into production. PAGP is like a hedge fund manager with permanent capital. They will continue to share in the cashflows generated by PAA for as long as they like, and PAA’s equity can never be withdrawn (i.e. investors can sell in the secondary market but they can’t force PAA to shrink), We are invested in PAGP.

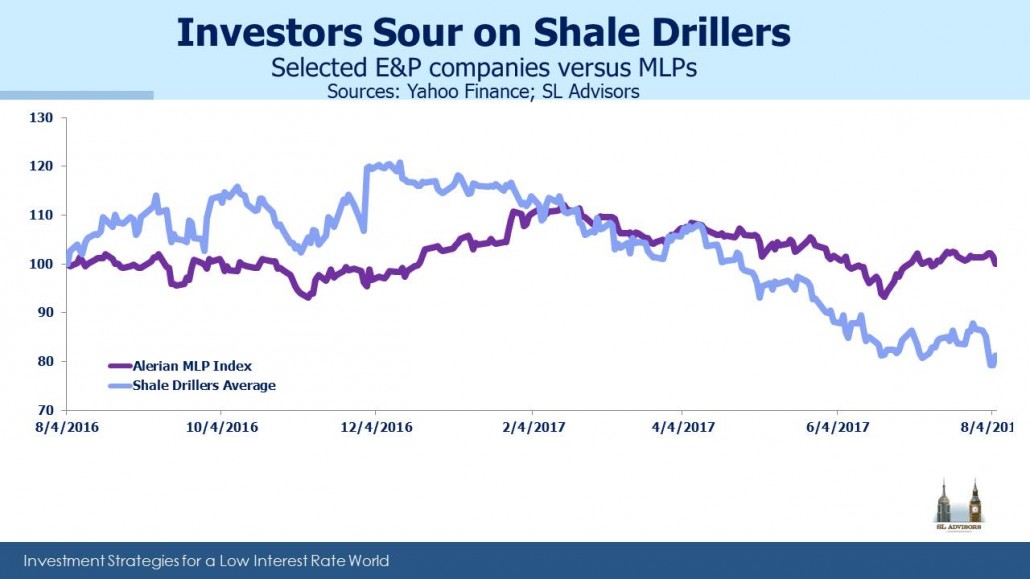
Other MLP GPs reacted poorly, and the Alerian Index duly reached a more than 30% drop from its highs of a year ago. Under these circumstances, a long time MLP investor’s thoughts might understandably turn to another violation of the Efficient Markets Theory.

I have to say that we have selected our clients well — or more accurately, they have self-selected well.  Our Separately Managed Account investors in our MLP strategy, most of whom have been with us for years, have reacted to developments with equanimity. Our ability to at least lose a good bit less than the index no doubt helps (past performance is not indicative of future returns). In a number of cases we have been asked to invest additional capital and open new accounts, reflective of the long term nature of the opportunity as well as the outlook of our clients.

It’s unfortunately no longer an original thought to state on this blog that MLPs are attractively priced, and regularly falling prices can challenge the conviction of those who rely on rising prices as a validation of their investment thesis. The market is being inconveniently uncooperative in endorsing the actions of more recent investors. However, the development of U.S. oil and gas resources will assuredly continue; operators with strong balance sheets and patient investors without leverage will in our opinion eventually benefit, as in the past. We continue to like our investments.

On a different topic, recently The Economist magazine weighed in on the hedge fund debate in an article titled Fatal Distraction. Readers may recall my book, The Hedge Fund Mirage, published way back in 2012 in which I showed that virtually all the gross profits earned by hedge funds had gone in fees to managers and funds of hedge funds. The Economist was one of several mainstream financial publications that reviewed my book positively. They even went so far as to check the spreadsheet I had built to calculate returns and fees, a step no other publication took and one which cemented their place atop my list of most trusted news organizations. Hedge fund returns have not been good since then, as I expected. Even beating a simple 60/40 stocks/bonds portfolio has been beyond the hedge fund averages since 2002 — not only for the past thirteen years but every single year too. 2015 is shaping up to be no different. The Economist correctly challenges hedge fund proponents on their consistent mediocre results delivered at great expense.


An Apocalyptic Fund Story

The Four Horsemen of the Apocalypse, as far as long term investment returns are concerned, are excessive fees, leverage, taxes and over-trading. Any one of these can be relied upon to eat into the results sought by the long term investor. Add an excess of all four and you wind up with a toxic brew that impedes reaching your investment goals and can seriously impair your capital. We recently came across a security which incorporates all of them, and it provides a startling reminder of just how relentlessly capital can be destroyed when these four villains are able to work in concert together. As you’ll see, they have wrought an investment disaster of biblical proportions.

The Cushing MLP Total Return Fund (SRV) stands as a testament to much that is wrong with some of the investment products on offer. Although I often write about Master Limited Partnerships (MLPs), this fund’s focus on our favorite asset class is incidental to the story. The lessons herein apply to any investment.

To begin with, SRV is a closed end fund (CEF). This is an intriguing backwater in which we once dabbled before concluding that there wasn’t enough liquidity to justify the time. CEFs are like mutual funds except that their share count is fixed; consequently, price and Net Asset Value (NAV) can and invariably do deviate from one another. One of the enduring mysteries of the CEF business is why anybody buys Initial Public Offerings (IPOs). With admittedly unfortunate timing, on August 27, 2007 Morgan Stanley led an underwriting of 8.75 million shares of SRV at $20, of which $0.94 went in underwriting fees. So investors were immediately down 4.7% on their investment, and could have chosen to avoid the excitement of the IPO and buy SRV the following day (presumably 4.7% cheaper if it traded at NAV). After all, this was not Google, but simply a fund holding other publicly listed securities. But the machine worked, as it usually does, and investors were duly parted from a modest portion of their funds in exchange for misplaced hope.

SRV is organized as a corporation rather than as a Registered Investment Company (“RIC”), and I’ll spare readers detail of the consequences other than to note that SRV expected to pay 35% of its returns to the U.S. Treasury as corporate income tax (since it is a corporation). SRV planned to use up to 40% leverage, relying on the leverage-magnified returns to cover most of the tax. This only really works when a security such as SRV only goes up, but to point out this possible flaw seems small-minded in the face of such boldness.

The 2008 financial crisis was just months away. The demise of Bear Stearns, collapse of Lehman and government bailout of AIG led many to pray for investment relief. They were dark days indeed. For comparison, we are going to consider SRV’s returns against two other indices; the Alerian Total Return Index (AMZX), and a customized index reflecting SRV’s structure, which uses AMZX with 40% leverage, a 35% tax rate, and 5% expenses (all assumptions lifted from the 2007 prospectus). We’ll call this the Alerian Stupid (AMZS) in honor of the hapless souls who aspired to its results.

In spite of the storm clouds in 2007, the AMZX returned 3.3% for the remainder of the year following SRV’s IPO, and even the AMZS was +1.7%. However, SRV left its initial investors smarting with a -14.4% reduction in the value of their investment. Worse was to come, and markets plunged in 2008 with AMZX delivering         -36.9%. AMZS was only slightly worse, at -37.4%. While leverage amplified the losses, the tax burden is assumed to work as a benefit in a down market rather like a net operating loss (those interested in more detail can find it on our blog under The Sky High Expenses of MLP Funds). SRV quickly parted company with these indices, and turned in an eye-popping -69.3%. CEF experts may note that many closed end funds moved to a substantial discount to NAV in 2008 which exacerbated the fall in price many suffered. However, Morningstar  shows that SRV remained at a premium to NAV fNewsletter August 2015 Chartor most of the year and indeed throughout its life until the end of last year. CEFs usually trade at a discount to NAV and many individual investors trade them seeking to exploit this fact. The consistent premium at which SRV has traded reflects optimism by investors tragically not repaid by results.

In 2009 markets roared back, and SRV delivered an astonishing +118.6%, well ahead of AMZX at +76.4% and AMZS at +60.2% (taxes really hurt that year). Emboldened by this performance, SRV investors drove the premium to NAV up during the year and by early 2010 it reached 40%, an apogee of irrational exuberance that causes wistful nostalgia in today’s investors. At this point Cushing, aided by a different set of underwriters, sensibly exploited the premium by announcing a secondary offering of 6 million shares priced at $10, half the level of the IPO. A 2011 supplement to the 2010 prospectus also revealed portfolio turnover of 301% in 2010 and 526% in 2009 (high turnover is our fourth horseman). Holders of SRV may have thought they were investors, whereas the data suggests a manager frantically trading with little evidence of any thoughtful strategy.

The years since have not been kind to the faithful (and their composition has changed via trading in the secondary market). Inconveniently, SRV has not risen consistently in price so as to most effectively avail itself of the benefits of leverage. The annual return from inception to June 2015 is -10.2%, compared with +4.6% for AMZS and 10.7% for AMZX. It shows the enormous difference between selecting the right asset class (since MLPs have done very well) and the wrong instrument.

The result is that today SRV languishes at $3.45, a country mile from its IPO price and at a discount of over 20% to its NAV. In 2015 MLPs have of course been weak, but the discount suggests that the level of enthusiasm for the stewardship of this fund has finally conceded to the reality of truly awful performance. The financial equivalent of Conquest, War, Famine and Death symbolized by the Four Horsemen have surely been visited upon the holders of this fund. Defenders might find fault with picking on an investment launched back in 2007, at a time when perhaps underwriting standards were lower. They might care to consider the Cushing Royalty & Income Fund (SRF), launched in 2012 and having lost 77% for investors since then for a -34% annual return. Obviously they have found a formula that works, after a fashion.

I have heard reports that a new portfolio strategy has been put in place for SRV and that prospects are better than in a long while for those investors willing to cast the past aside. There will probably be some – for although underwriters deserve blame for bringing poor products to market, self-destructive behavior by investors is also necessary to produce stories such as this one. The right thing for Cushing to do is liquidate the portfolio and buy back shares, thus ending a sorry chapter for an MLP manager that has produced ample wealth for its founders if not always for its investors. At least the remaining faithful would profit from the closing of the NAV discount. However, closed end funds represent permanent capital, in that they generate fees in perpetuity for the manager, and winding the fund up is never going to be as appealing to a commercially-driven operator as trying again with a new set of investors.

Even with the benefit of hindsight, it’s hard to fathom just how the underwriters and manager of SRV ever expected to generate acceptable returns. The tax drag, leverage, fees and subsequent turnover represented a formidable headwind, as shown by the difference between AMZX and our customized index, AMZS. Although SRV appeared just prior to a tumultuous time, overall asset class returns during its life have been good; better, perhaps, than those involved in its creation might have hoped in 2007. It was a structurally flawed security, and its existence reflects poorly on all the firms who have been associated with it. I recently chatted with a friend who was considering entering investment management but worried that he did not possess a sustainable investing edge. His caution was reasonable given his desire to offer a value-added service. However, as I pointed out to him, in some places the bar is set pretty low.


MLP Earnings Provide Update on Fundamentals

Energy investors have seen their holdings buffeted of late by the price of oil, and Master Limited Partnerships (MLPs) have been no exception to this. Their prices have moved as if they have substantial exposure to oil, whereas midstream MLPs are most notable for their cashflows being predominantly fee-driven. Over the past few days several firms reported quarterly earnings, showing business operations that are far less exciting than their security prices suggest.

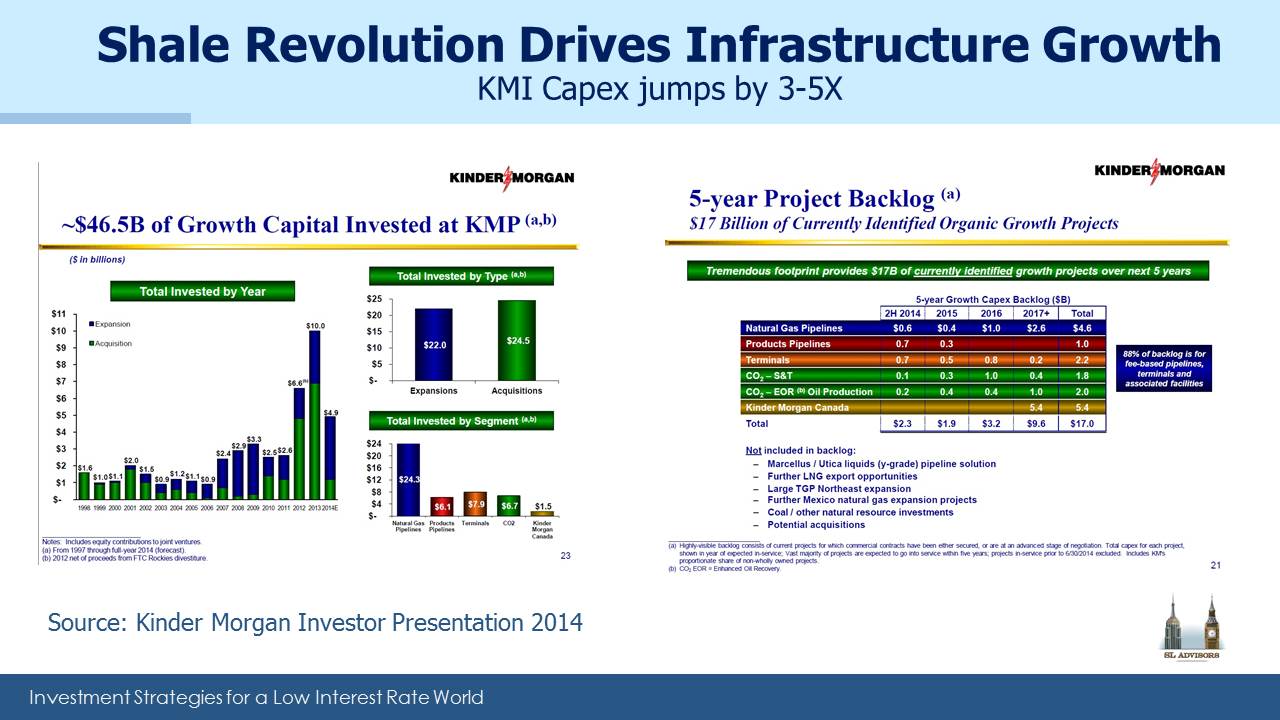
Before we get to that, it’s worth contrasting recent news on planned capital investment from Royal Dutch Shell (RDS) with plans at Kinder Morgan (KMI). RDS announced they were cutting 6,500 jobs (out of a total workforce of 94,000) and reducing their planned capital spending by $7BN (to $30BN) as a result of weak oil prices which they expect to persist. There is a substantial timelag between shifts in the price of oil and changes in supply, but here’s one example of a reduction in future supply in response to lower prices. Kinder Morgan (as we noted in a previous blog post Kinder Morgan Isn’t Greek) recently increased its backlog of projects from $18.3BN to $22BN during the most recent quarter (these cover several years so longer than the one year over which RDS cut its planned investments). Both companies are in the Energy sector, and yet they’re experiencing the fluctuations in oil prices very differently.

To return to recent earnings, results from the companies we care about were generally good. Williams Companies (WMB) affirmed its 10-15% dividend growth through 2020 and currently yields 4.8%. Enterprise Products Partners (EPD) raised its distribution by 6% year-on-year and yields 5.25% with very conservative 1.3X coverage. Western Gas Equity Partners (WGP), the General Partner for Western Gas, LP (WES), increased its distribution by 34% year-on-year and reaffirmed its outlook for 30% growth going forward. It yields 2.5%. Finally, U.S. Silica (SLCA), whose main business provides sand to companies for use in fracking, saw its revenues fall 28% and sand volumes drop 13%, less than expected, resulting in a 15% jump in its stock price on the day of the release (although admittedly it remains lower than we originally expected.

In short, fundamentals on individual names are showing that the energy infrastructure business remains sound in spite of the weakness in their stock prices. Everybody would like to know when prices will rise; while we can note several solid earnings reports and can opine on business conditions, calling equity markets is hard. But the news we received over this past week was positive.