Bonds Are Dead Money

If you aspire to achieve acceptable returns from bond investments, the Fed is in no hurry to help you. They have other objectives than ensuring a preservation of purchasing power for buyers of taxable fixed income securities. Their failure to raise rates on Thursday is not that important — what’s more significant is the steadily ratcheting down of their own forecasts for the long term equilibrium Fed Funds rate.

For nearly four years the Fed has published rate forecasts from individual FOMC members (never explicitly identified) via their chart of “blue dots”. They now produce a table of values so there’s little ambiguity about its interpretation. Traders care mightily about whether they’ll hike now or in three months. It’s all CNBC can talk about. For investors, the Fed’s expectation for rates over the long run is far more interesting.

Since you might expect long run expectations about many things to shift quite slowly, by this standard the Fed’s long run forecast has plunged. The steady downward drift accelerated in recent meetings and it’s now fallen more than 0.5% since last year, to 3.35% (see chart). What this means is that their definition of the “neutral” fed Funds rate (i.e. that which is neither stimulative nor constraining to economic output) is lower. They don’t have to raise rates quite as far to get back to neutral.

Their inflation target remains at 2%, although inflation, at least as measured, is clearly not today’s problem. So the real rate (i.e. the difference between the nominal rate and inflation) has now come down to less than 1.5%. Since bond yields are in theory a reflection of the average short term rate that will prevail over the life of a bond, the Fed believes investors in investment grade debt with negligible default risk should expect this kind of real return. For a taxable investor, this will result in more or less a zero real return after taxes.
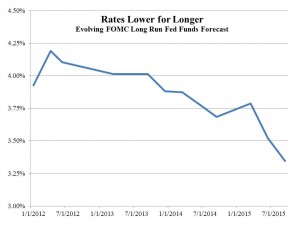
FOMC Rate Forecast Sept 2015The Fed’s communication strategy has  not been that helpful over the short run. Although we are provided with far more information about their thinking, it simply reveals that they don’t know much more than private sector economists and like them are always waiting for more information. The FOMC doesn’t want to provide firm guidance, since that requires a commitment which results in lost flexibility (see Advice for the Fed). The evenly split expectations for last Thursday show that forward guidance hasn’t helped traders much. But that doesn’t matter for investors; the insight into their long term thinking, presented as it is in a quantitative form, really is useful.

Hawkish is not an adjective that will be applied to this Fed anytime soon. In fact, one FOMC member included a forecast for a negative Fed Funds rate by year-end, a no doubt aspirational forecast but probably the first time an FOMC member has advocated such a thing. The Fed chair is clearly among ideological friends. Janet Yellen’s deeply held feelings for the unemployed inform her past writings and those of her husband George Akerlof. These are admirable personal qualities and not bad public policy concerns. Given that inflation remains below the Fed’s target, monetary policy can remain focused on doing all it can to promote growth, thus raising both employment AND inflation. Wgat some perceive as the Fed’s short run trade-off between maximizing employment and controlling inflation is unlikely to be tested anytime soon. Rates will rise slowly, because the future is always uncertain and because the neutral policy rate is in any case steadily falling towards the current one.

The low real rate contemplated by the Fed reflects their lower estimate of the economy’s growth potential. This is not a contentious view, it’s just that we’re seeing it play out through their rate forecasts.

The clear implication for bond investors though is that it’ll be a very long time before they make any money. The Barclays AGG is +0.64% YTD. This is the type of return bond investors can expect. Taxable investors are losing money in real terms and the Fed hasn’t even begun raising rates yet. Moreover, it’ll be years before this Fed gets bond yields to levels where a decent return is possible. It’s as I said two years ago in Bonds Are Not Forever; The Crisis Facing Fixed Income Investors. Bond holders are in for years of mediocre results or worse. It’s not going to be worth the effort. Take your money elsewhere.


Rate Hike Or Not, The Same Problems Persist

On May 22, 2013 then-Fed chairman Ben Bernanke inadvertently added “taper tantrum” to the lexicon of terms used to describe the impact of the Fed’s activities. That date marks the formal beginning of the Fed’s efforts to prepare financial markets for an eventual tightening of policy — or the start of the removal of accommodative policy, to use their description. In the belief that transparent policy deliberations reduce the possibility of a monetary surprise with its consequent financial market upheaval, the Fed’s public statements, release of projections and even the ubiquitous “blue dots” showing the rate forecast of each FOMC member have all been provided to help us. In fact, for almost four years I’ve been constructing an “FOMC Futures Curve”, which is what short term interest rate futures would look like if FOMC members were the only participants. It’s been absorbing for brief moments around four times a year when they provide updated information. Many might find it a nerdy preoccupation, but having spent a good part of my career in Fed-engineered darkness over their intentions, the shift to greater openness begun under Greenspan has been fascinating.

Forward guidance presumably is intended to let us know what the Fed will do before they do it. As we head into a two-day FOMC meeting on September 16-17, opinions are evenly split about whether they’ll raise rates. Perhaps we ought not to be surprised in either outcome, but it seems to me that if there’s no consensus after years of openness, the communication strategy has failed. The problem with providing meaningful forward guidance is that it involves a commitment, and a commitment reduces your ability to change your mind. The window into the Fed’s deliberations has simply revealed that they want to retain maximum flexibility until the day they meet. Announcing a hike with a delayed effective date would soften the blow (see Advice for the Fed) but it’s too late for that.

Following the FOMC’s announcement and the elimination of near term uncertainty, investors will be faced with the same dilemma as before: how are they to invest so as to preserve the purchasing power of their assets after taxes and inflation? Whether ten year treasury yields move up 0.25% or not this week, the paucity of assets offering acceptable returns will remain Dilemma #1.

Suppose a taxable investor visits her financial advisor with the objective of constructing a portfolio with a 6% return and moderate risk. Assuming our investor is facing a 30% average tax rate (combination of Federal and state taxes on capital gains, dividends and ordinary income), a pre-tax 6% is 4.2% afterwards. 2% inflation (the Fed’s target) knocks that return down to 2.2%. Then there are the advisor’s fees, and the possibility that returns won’t be as hoped. 6% doesn’t seem that demanding given all of this, and yet the building blocks with which to achieve it are limited.

Public equities yield around 2%, and assuming the fifty-year average dividend growth rate of 5% prevails (for a total return of 7%), stocks clearly are part of the portfolio. Bonds (as defined by the iShares Aggregate Bond ETF which tracks the Barclays Aggregate Index) yield 2.4%. Since the yield at which you buy a bond heavily impacts your total return, it’s going to be hard to do much better than 2.4% with investment grade debt. Moreover, the ability of bonds to offset a falling equity market is limited given their already low yields. Backward-looking models may justify them, but to us they look like returnless risk. Moving up the risk spectrum to High Yield gets you 5.5% (as defined by the iShares High Yield Corporate Bond ETF). There is some chance for capital appreciation — but this year capital losses have more than wiped out coupon income reflecting the preponderance of energy names in the index.

REITs yield 4.4% (as defined by the Vanguard REIT ETF), and this, combined with some modest growth may deliver a return that at least equals the investor’s 6% target.

Regular readers can by now guess where this is going. The Alerian MLP Index, yields 7.25%, and MLP distributions even grew in 2009 following the financial crisis. However, MLPs are down 23% so far in 2015. In fact, they’ve fallen that much since the end of April, creating an unpleasant backdrop to an otherwise glorious Summer for anyone more than tangentially involved.

There is a bear story to MLPs, as those prescient enough to sell at the highs of August 2014 well know. A 33% drop can’t happen without a fundamental story, and the collapse in oil is challenging the expected production growth of U.S. shale plays with its attendant reduction in needed infrastructure. The growth story that has driven MLP prices is in doubt.

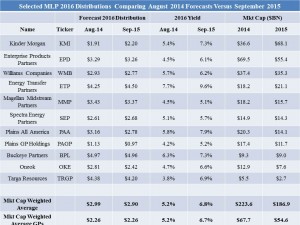
It’s therefore instructive to examine metrics on a number of businesses as they were in August 2014 and how they appear today. The table below shows forecasts for 2016 distributions from selected MLPs (chosen unscientifically because we are invested in them or the General Partners that control them), and shows how those 2016 forecast distributions have changed from the market peak in MLPs 13 months ago to now. The data is from JPMorgan but such figures are typically heavily influenced by company guidance.

Looking at the numbers, you certainly wouldn’t think we’d seen a collapse in oil. The 2016 forecast distribution for this group is modestly lower at $2.90 (cap-weighted) versus $2.99 a year ago. The market cap of these companies (excluding Kinder Morgan since during the intervening period it combined with its two outstanding MLPs to create a substantially larger entity) has fallen by 16%, hence the 2016 yield has risen from 5.2% to 6.8%. Just looking at the General Partners in this group (KMI, OKE, PAGP and WMB) provides a similar result. The operations of these firms and their cashflow generating abilities have on average not shifted that much. Plains All America (PAA) and its GP (PAGP) have seen forecast reductions because of their crude oil exposure. The same is true of Oneok (OKE).

But overall, the fall in their security prices has simply driven up their yields. These names are representative — they’re all midstream, which is to say they operate toll-like business midels with limited direct commodity exposure. There are MLPs concentrated in Exploration & Production (upstream) and others that run refineries (variable distribution MLPs), but we don’t care about those.

So for the investor seeking a 6% portfolio return, the most compelling reason to exclude MLPs is the 23% drop since April which has made few people happy. However, looking beyond the undoubted voting by many investors who have abandoned the sector, 7% yields combined with 8-9% growth rates (the cap-weighted forecast on the group of names listed) seems pretty compelling for long-term investors willing to look beyond recent price action and focus on the fundamentals by including MLPs, perhaps even with an overweight, in their portfolios.

MLP Distribution Forecasts September 11 2015 V2


Why You Might Care About Risk Parity Strategies

Everybody wants to know why the market just did what it did, and what is its next likely move. Chinese equities don’t seem that important to us, but the U.S. sell-off in August coincided with the Chinese one so maybe there’s a stronger connection than we thought. It’s important because investors would love to alter their risk profile profitably — taking more risk when markets are rising and less risk when they’re falling. There is of course an easy way to do this, which is through buying call options. Through their command of Greek, an option’s Delta (your exposure) moves in synchronicity with the market in a thoroughly satisfying way (if you’re long), and the more Gamma you have the more co-operatively your Delta recalibrates your risk appropriately. The snag with this most Utopian of investment postures is that buying options costs money. The happy state in which options deposit their holders cannot be had for free.

Nonetheless, the search for free, optimized risk is never-ending. Investors want more risk when it’s low and less when it’s high.  Put another way, they want less risk but not yet, as St. Augustine (“Give me chastity…but not yet”) might say if he was alive today and glued to CNBC. Older readers will recall Portfolio Insurance, which was blamed for the 1987 crash. Its adherents were required to sell when prices were falling and buy when they’re rising, mimicking the exposure shifts created by being long options but without having to fork over the option premium. It must have worked for a while, but most good ideas in investing eventually die of popularity, and too many portfolio insurers ultimately ran out of less-informed market participants against whom to trade. For the iron rule of hedging is that it requires the availability of a counterparty who isn’t hedging.

Today’s Risk Parity (RP) strategies are more sophisticated, as you might expect given the quantum increase in desktop computing power over the last 28 years. Practitioners target a specified amount of risk (typically defined as volatility) for each chosen asset class, and vary the amount of assets invested as needed. Higher expected volatility tomorrow, which is usually the result of higher actual market volatility today, requires reduced holdings in that asset class so as to maintain constant risk exposure. At its most basic, RP reduces down to changing your risk profile as your forecast of market volatility changes. Equity markets rise slowly and fall sharply, so looking back at a rising market makes you want more of it, and less of one that’s falling. These are pro-cyclical strategies, and they’ve evidently been very successful because their followers are growing in number. RP and other momentum strategies are now blamed by some for the performance of stocks in August. Leon Cooperman of Omega Advisors, a big hedge fund, blamed risk parity strategies for both his fund’s and the S&P500’s poor results. How ironic that one overcapitalized sector (hedge funds) is complaining about another over-capitalized one (RP). For more on hedge funds, see Direct or Indirect, the hedge fund industry can’t deliver.

Before you discount Leon Cooperman as offering a self-serving defense, you should know that JPMorgan’s Marko Kolanovic published a recent research note in which he sought to quantify the volume of selling that such strategies might execute in different market scenarios. By calculating the amount of RP and momentum-based capital and adding informed judgments on how it reacts, he came up with numbers, and he concluded that selling in the hundreds of billion of dollars is possible. Moreover, because such portfolio adjustments take place over many different time periods, the type of dislocation that we saw on, say, Monday August 24th will, in his opinion, be repeated.

Much of this risk on/risk off activity measures risk as volatility, which is not the best measure for most investors unless you use leverage. Investing with borrowed money means you not only care about whether an investment travels from 10 to 20, but also the path it takes on its way there. Stopping at 5 first represents merely an inconvenient detour for the cash investor but a potentially capital-destroying one for the leveraged one as a margin call forces untimely liquidation. Cash investors who worry excessively about the market are emotionally leveraged if not economically so; their best move is to reduce their positions to the point at which they are more concerned with their golf swing. For a cash investor, the risk of a permanent loss is the risk they care about. If you own companies with strong balance sheets and earnings power, the path prices follow needn’t concern you. Just focus on the health of your companies’ businesses.

The nice thing about Leon Cooperman’s complaints is that our inability to link Chinese equity volatility with the U.S. looks slightly more forgivable. In fact, it renders most short term market judgments invalid unless they accommodate the emotionless algorithmic activity of RP. Explaining market moves in the context of fundamental developments may be less important than interpreting them through the eyes of systemic traders. This is our Brave New World. Investors should conduct their affairs accordingly.


Advice for the Fed

There must be more words written about the Federal Reserve and tightening of interest rates than any other issue that affects financial markets. A Google search throws up an imprecise “about 750,000” results! If each one is 250 words (less than your blogger’s typical post) that is 239 versions of the King James Version of the Bible. Although this most secular of topics is clearly not short of coverage, I’ll try and offer a different perspective.

An estimated 187 million words or so reflects the importance of a move in rates. Since the last rate hike was nine years ago, the Fed is spending much effort trying to make the eventual move anti-climactic. If their announcement is greeted with a financial yawn, that will represent a successful communication strategy. It’s not just that we’re out of practice in dealing with rising rates; it’s that the announcement and implementation both happen together. The Fed announces a hike in the Fed Funds rate, and implements it right away. The result is that we head into the day of an FOMC meeting with countless market participants and unfathomable amounts of borrowed money not knowing if their cost of borrowing overnight money will be instantly higher than it was yesterday. The uncertainty about how others will react to an immediate change in their cost of financing is why there is so much angst surrounding the “normalization” of monetary policy.

It occurred to me that the Fed could separate the two. Instead of offering various shades of certainty around when they will raise rates, why not say that any hike will take effect with a three month delay? Term money market rates would immediately adjust, but if the Fed announced a hike with effect at a certain future date the knowledge of higher financing would not coincide with the actual impact on financing over three months and less. Trading strategies that rely on a certain level of financing will have some time to adjust. Market participants will know for certain that rates will be higher in three months’ time, as opposed to having to make informed judgments based on public statements and economic data. And while the clear expectation will be that the pre-announced tightening will take place on schedule, the Fed does retain the flexibility to undo it in extraordinary circumstances.  It would take some of the guesswork out of getting the timing right.

It’s seems such a simple fix to the problem. I haven’t read all of the 750,000 Google results to see if they include this suggestion, but I’ve never seen it myself. Maybe someone at the Fed will read this. They may conclude it’s worth what they paid for it, like any free advice. We’ll see.


Prognosticating the Effect of Higher Interest Rates

People often ask me how I think equity markets, including Master Limited Partnerships (MLPs), will perform when interest rates are rising. It’s a timely question, since bond yields have been moving higher for the past couple of months. The yield on the ten year U.S. treasury recently touched 2.5% as markets look ahead to a tightening by the Fed later this year. Of course, the Fed has been steadily pushing back the first rate hike, since it turns out they’re not any better at forecasting rates than the private sector, as I wrote a couple of months ago in Preparing for Higher Rates. Nonetheless, they will be right eventually and financial advisors would like to be prepared.

The relationship between interest rates and most asset classes is not simple. Bond prices mathematically fall with rising yields since their payouts are fixed, but equity securities whose return comes from both dividends and dividend growth have a more complicated relationship with rates.

Stronger economic activity can be expected to translate into faster profit growth and higher dividends, in which case higher rates represent confirmation of a more robust economy and need not be negative. Conversely, if rates rise while inflation is unchanged, it results in higher real rates (i.e. after inflation) and this in theory reduces the value of all assets.

But we know rates will rise, and the yield curve is pricing in the expectation of a higher Fed Funds rate in the next 6-12 months. So part of the question comes down to what the market will do if the market’s own forecast of the timing of rising rates turns out to be correct. In this respect, it boils down to a question of market psychology; if rates rise following the path already reflected in the yield curve, it ought not to surprise. In fact, the prices of treasury bonds ought not to change, in theory, since their prices already reflect that path. They obviously will move, but where will they, and equity markets, settle?

I have a friend who has an exceptionally acute sense of such things. Through seemingly logical analysis, he often arrives at an insight that sometimes seems so obvious but wasn’t at all clear until he pointed it out. On this topic, he recently noted to me that if he was considering buying stocks but planned to sell upon a Fed rate hike later this year, he wouldn’t invest. It seems so blindingly obvious, but if something unsurprising will happen that would cause you to sell, you would avoid putting yourself in that position.

Therefore, if you put yourself in the mind of this mythical yet rational investor; if this participant isn’t going to sell stocks at that time, who is? And the answer is, people with a short term horizon who expect selling by others and wish to avoid a near-term drop in their portfolios, or hope to buy back shortly afterwards. And from whom exactly will they buy back their shares, if our mythical yet rational investor (perhaps with many like-minded folk) is not then a seller?

This is exactly the kind of set-up that can cause equity markets to reach higher prices than existed prior to the “news”, as the participants expecting to buy from other more hasty investors find far fewer such impulsive folk exist than they might have expected. We don’t forecast equity markets, but don’t be shocked if stocks rally on the first rate hike.

The analysis of market psychology is of course an endless game that never ends. Events big and small are anticipated, happen and are reacted to along with big and small surprises too. As soon as the aftermath of one event reveals the true disposition of willing buyers and sellers through their subsequent actions, the build-up to another event begins. It’s very hard to be good at figuring this out, and in my experience the supply of people with opinions far and away exceeds the number whose views result in profitable outcomes. But I know just a very few who have turned astute observation into market profitability.

For our part, while this type of prognostication can be fascinating, there isn’t a plausible move in interest rates that would cause us to sell investments which are, by definition, held for the long run. Several months at least lie between today and the resolution of that particular event. When it happens, if equity markets fall, we shall be among those whose portfolios suffer a loss in value. However, we shall not be a seller in response to something not surprising. Ben Graham is believed to have said that in the short run the market is a voting machine while in the long run it’s a weighing machine. We’ll weigh things up down the road.


U.S. Natural Gas Terms of Trade Continue to Shift

Data recently released by the Energy Information Agency (EIA)  highlighted the continuing shift in U.S. terms of trade regarding natural gas. The North East U.S. (NY, OH, PA, NJ, MD, DE and VA) was for the first time in 2014 no longer a net importer of natural gas from Canada, as production in the Marcellus Shale in Pennsylvania finally grew so as to make the region self-sufficient. The Great Lakes states (MI, WI, MN) have been net exporters for several years, now joined by another region as defined in the EIA’s release.

Even though the North East is reducing its reliance on Canadian natural gas, there remain infrastructure bottlenecks in New England preventing sufficient peak supplies reaching customers. Boston paid as much as $30/MCF for natural gas this past winter to meet high electricity demand, and limited regional pipeline capacity is expected to cause continued seasonal spikes for the next few years. The states in the region have begun to co-ordinate their efforts to improve access to electricity, natural gas and renewables. Spectra Energy (SE) is just one of the energy infrastructure companies seeking support from state and local governments in the region for its plans to improve natural gas distribution.

In related news, the first LNG export facility in the lower 48 states is expected to begin operations later this year (The Kenai LNG export terminal in Alaska is currently the only source of U.S. LNG exports). The Sabine Pass facility in Louisiana is owned by Cheniere Energy Partners (CQH). It is run by a colorful character named Charif Souki, memorably portrayed in Greg Zuckerman’s 2014 book The Frackers. Last year CQH’s parent company, Cheniere Inc (LNG) was forced to withdraw its proposed compensation plan following investor lawsuits arguing it was too generous. Meanwhile, CQH spent $17MM on distributions to MLP investors last year, no doubt fostering a warm feeling about their stable business. However, unlike most MLPs, distribution coverage isn’t a useful metric since CQH has no revenues yet. One wonders how many unitholders actually know that. No doubt when  the Sabine Pass facility begins operations their income statement will look wholly different, but this was one name that didn’t make it through our screening process, although LNG exports remain a fascinating story.

As an aside, in a previous career as a restaurant operator Souki had the misfortune to own the L.A. restaurant where Nicole Brown Simpson, OJ Simpson’s wife, last ate prior to being murdered in 1994. Souki’s business career includes episodes of near-bankruptcy and it’s fair to say he and I have different risk appetites. However, having successfully converted Sabine Pass from an LNG import facility to one that exports, he’s likely to be one of the winners from U.S. energy independence.

Of the names mentioned, we are invested in SE.


The U.S.'s Self-Imposed Oil Embargo

In an interview on CNBC last week, Continental Resources CEO Harold Hamm elegantly exposed the increasingly anachronistic ban on crude oil exports from the U.S. By noting that sanctions on Iran would soon be lifted, allowing that country to once again export oil, he characterized the U.S. export ban as a self-imposed sanction, benefiting other producers and certainly not helping the U.S.

It’s an obvious contrast to draw, and such a devastating soundbite targeted at the dwindling supporters of maintaining current law, which dates back to the 1973 Arab Oil Embargo when the world was a very different place. Some believe that U.S. producers could realize an additional $5-14 barrel by selling to overseas customers. Other 1970’s era energy-related laws such as price controls and rationing were dropped long ago. In fact, arguably the main beneficiaries of current law are domestic refiners who are able to buy crude oil in a domestic market with fewer options than it might otherwise have.

Alaska’s senator Lisa Murkowski has promised to introduce legislation repealing the ban. Ever since oil began its collapse last Summer, hurting employment in a booming domestic energy industry, the ban has received increasing attention. Conventional wisdom continues to hold that the status quo will prevail. This may be so, but sometimes a position can be summed up in a soundbite that works for TV or for a speaker on the Senate floor looking for a 10 second clip on the nightly news. The contrast between lifting sanctions on Iran and maintaining our own self-imposed one is a powerful one easily communicated in a single sentence. It just might shift the debate, since articulating the opposite view doesn’t offer anything like the same optics or brevity of response.

If the oil export ban is eventually lifted, it’ll benefit a number of Master Limited Partnerships (MLPs) that have assets that handle liquids, including Magellan Midstream (MMP), Energy Transfer Equity (ETE), because of its ownership of the GP in Sunoco Logistics (SXL), and Plains GP Holdings (PAGP). Other MLPs, such as Targa Resources (TRGP) and Enterprise Products Partners (EPD) have Gulf Coast based assets that would also benefit from increased movement of crude oil through the Gulf on its way to foreign markets. We are invested in all the names just mentioned.


Sclumberger's Perspective

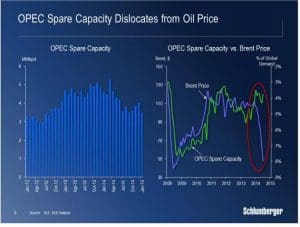
Schlumberger (SLB) provides services worldwide in support of gas and oil exploration and production companies. They are at the sharp end of shifts in production, and as such have an interesting perspective on the upheaval in the crude oil market. A recent investor presentation highlighted that increased global demand of around 1 MMBD (million barrels per day) annually has been fully met by higher North American output. Global supply capacity away from North America has remained flat. Increased production from North America (from just under 12 MMBD in 2011 to 16 mmbd last year) is of course not news, but I thought the fact that this has fully accounted for increased global demand and not just a portion of it highlighted the importance of unconventional drilling.

OPEC has consequently been losing market share, and OPEC’s desire to push back against this loss in behind price drop. Historically, OPESBI Global Capacity 2C spare capacity has tracked the price of Brent crude oil fairly closely, as can be seen in the chart on the left. This was in effect OPEC (mainly Saudi Arabia) acting to smooth oil price swings by countering moves up (down) in price by reducing (increasing) their spare capacity. Over the past couple of years OPEC’s spare capacity has been falling both as MMBD but also as a percentage of demand as they lost market share to new North American production. Their maintenance of relatively low spare capacity in the face of the fall in price (as opposed to past practice whereby they would increase spare capacity, or reduce production somewhat) is of course what we’ve seen.

The real question is what does it mean for prices in the future. North America is now the swing producer. Break even costs vary widely and it’s not meaningful to talk about a shale break-even price. The sharp drop in the rig count in recent months illustrates how responsive new activity is to prices; unconventional drilling results in wells with faster decline rates, so new wells are always being drilled. EIA forecasts are for a flattening of U.S. oil production this year and a modest drop in 2016. Much will depend on the ability of domestic producers to continue to reduce their costs, which is where Schlumberger and its competitors play a key role.

Meanwhile, U.S. oil stocks are approaching 500 million barrels, almost 20% above the top of the five year range, which makes it a good time to be an MLP with storage assets. The worst environment for energy infrastructure is one of demand destruction, usually caused by excessively high prices. That is clearly not today’s world. The mutual fund we manage is doing very well in its Morningstar category.

Please click here for Legal disclosures.


The Outlook for Energy

Exxon Mobil publishes a long term energy outlook (The Outlook for Energy: A View to 2040) which they update annually. It’s full of interesting facts and charts on energy use and is well worth reading. Integrated energy companies like Exxon Mobil commit capital to projects whose payoff can take decades, and so they are inevitably in the long term forecasting business. The Outlook for Energy provides a perspective on their thinking as well as an interesting snapshot of likely shifts in energy consumption.

Globally, the number of middle-class households (defined as having discretionary income to spend beyond basic necessities) is the most important input into the demand side. Although demographers forecast global population to rise by 2 billion to 9 billion by 2040, more significant for energy demand will be the more than doubling of members of middle class households in just fifteen years, from 1.9 billion to 4.7 billion by 2030 (according to the Brookings Institution). In spite of this, The Outlook for Energy anticipates substantially slower rate of actual energy demand as energy intensity (the amount of energy required to produce a fixed amount of GDP) improves in the developing world to reach present day levels in the U.S.

Half of the increase in energy demand from Transportation will occur in China and India, as a result of which heavy-duty use (trucks) will substantially outpace light-duty (mainly private automobiles). In spite of an expected near doubling in the number of cars of the roads, substantial improvements in energy efficiency will result in little overall change in energy demand from this sector.

As a result of increased efforts to control pollution, CO2 emissions are expected to eventually flatten out and then begin declining over the next 10-15 years. Given the uneven nature of such initiatives globally, this must be one of the more speculative forecasts.

The most significant change in long term supply in recent years is most assuredly the development of “tight”, unconventional oil and natural gas liquids (NGLs) in North America. In just a few years unconventional gas production in North America is likely to exceed the total from the Middle East, turning the U.S. into a significant net exporter within ten years. Although coal will continue to be a substantial source of electricity supply through coal-burning power stations, it has been falling as a percentage of fossil fuels used for many years. In fact, recently Beijing announced it would be closing its last coal-fired power plant by the end of 2016.

Overall, The Outlook for Energy provides a useful global, long term perspective and highlights America’s place evolving role as a producer.


Activist Update

Activist hedge funds can be a positive force. Although this isn’t always true (Keith Meister of Convergex so abused ADT investors that his actions caused us to apply the “Corvex Discount” to other stocks in his viewfinder), it’s probably more often than not beneficial to existing investors when a hedge fund shows up.

The most recent case involves Tetra Technologies (TTI), about which we wrote a few weeks ago as an example of the power of the MLP General Partner. Dimitri Balyasny just filed a 13G (indicating a passive stake) in TTI and a 5.3% investment. Acquiring 4.3 million shares of TTI is quite a trick, considering their average daily volume of under 1 million shares.

Other activist-owned stocks of interest to us that were recently in the news include Dow Chemical (DOW), which last week announced the sale of its chlorine business (DOW shareholders will own 50.5% of the resulting chlorine business with Olin Corp). Hedge fund Third Point has been a long-time advocate for value-enhancing moves. Another is Hertz (HTZ), which is owned by a virtual who’s who of hedge funds including funds run by Carl Icahn, Larry Robbins, Jeffrey Tannenbaum and Barry Rosenstein. HTZ has been recovering from some self inflicted wounds including accounting mistakes, poor pricing strategy and the relocation of its headquarters to Naples, Florida so as to be close to the (now former) CEO’s golf club. The persistent lethargy in HTZ’s stock price shows that it takes more than four activist investors to raise the price. However, moves in recent months to hire new management are positive signs. Today Morgan Stanley lifted its sell recommendation.

We are invested in TTI, DOW and HTZ.