Bonds Still Can’t Compete with Stocks

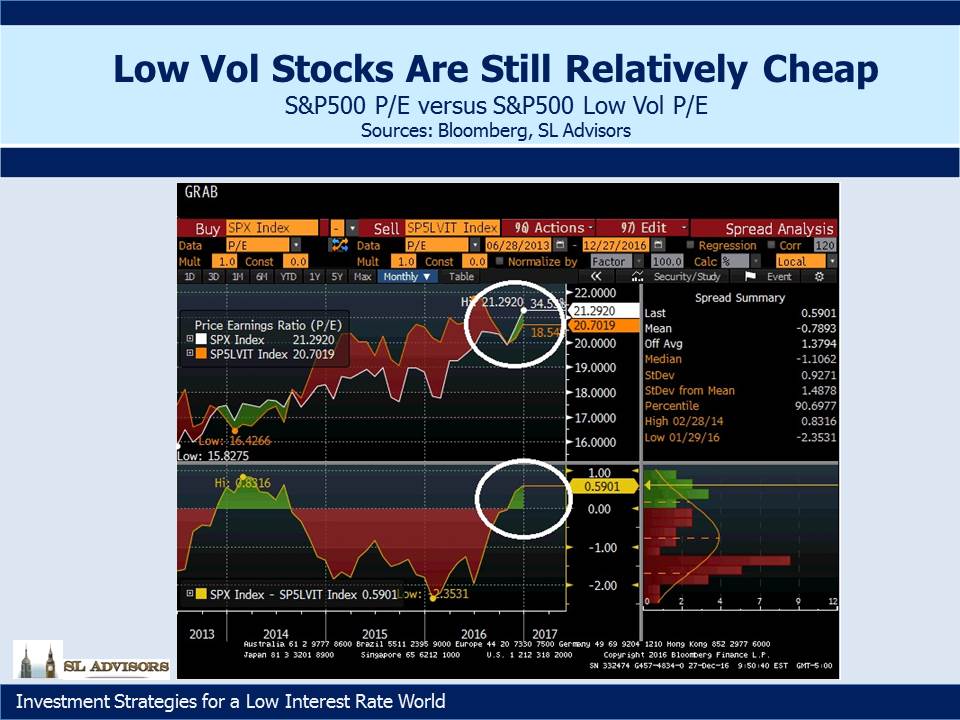
The Equity Risk Premium (ERP) is a handy way to compare valuations of equity with fixed income. It compares bond yields with the earnings yield on stocks (the earnings yield is reciprocal of the price/earnings ratio). Six years ago, when the Fed was well into quantitative easing and bond buying, it gave a clear signal that stocks were a far better long term investment than bonds. The yield on ten year treasuries was below 2%. Government policy was to create a huge disincentive for investors to hold fixed income through unattractively low rates, and it worked. Holding risky assets such as equities has substantially outperformed less risky bonds.

It’s not only relative valuations that supported stocks, but earnings growth. 2018 earnings on the S&P500 are coming in 22% higher than 2017. Pessimists will note that this growth won’t be sustained into next year, but the FactSet consensus estimate for 2019 is still 10% growth, which isn’t bad.

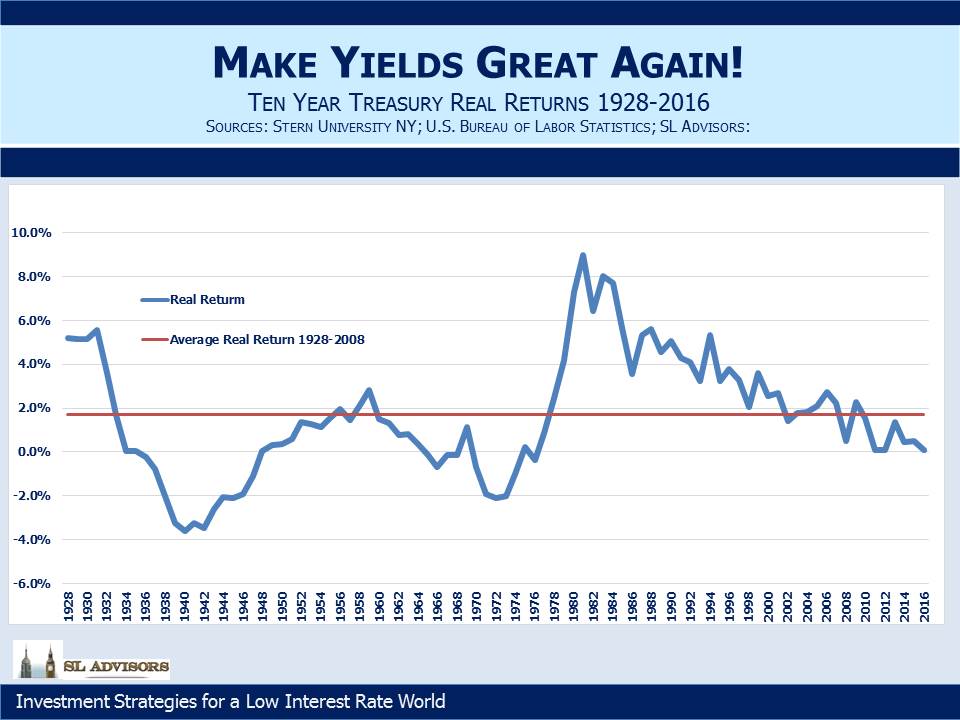
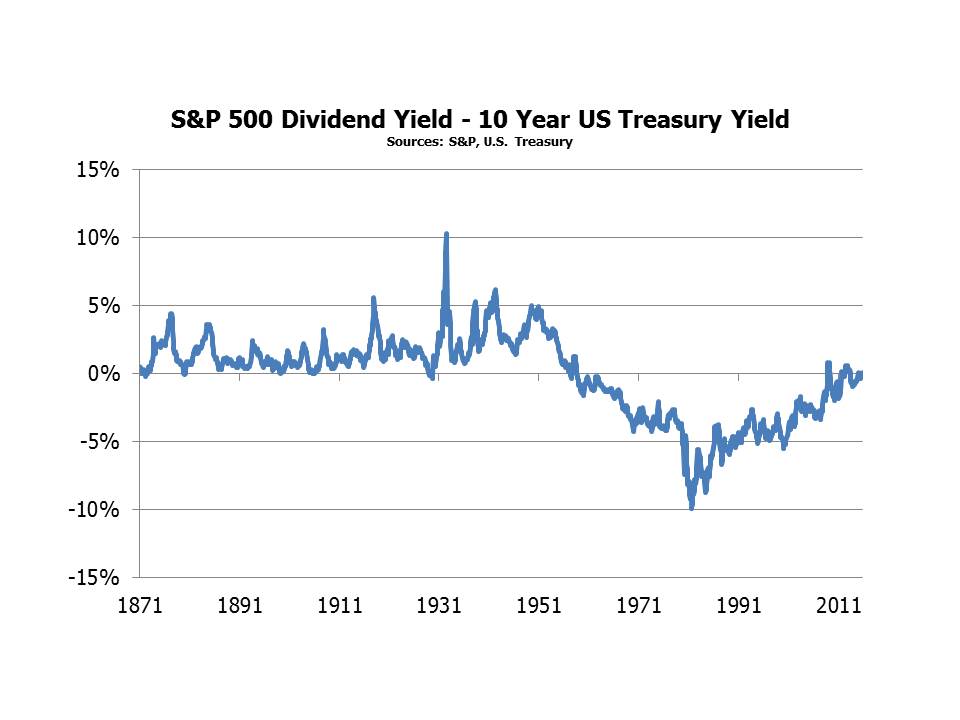
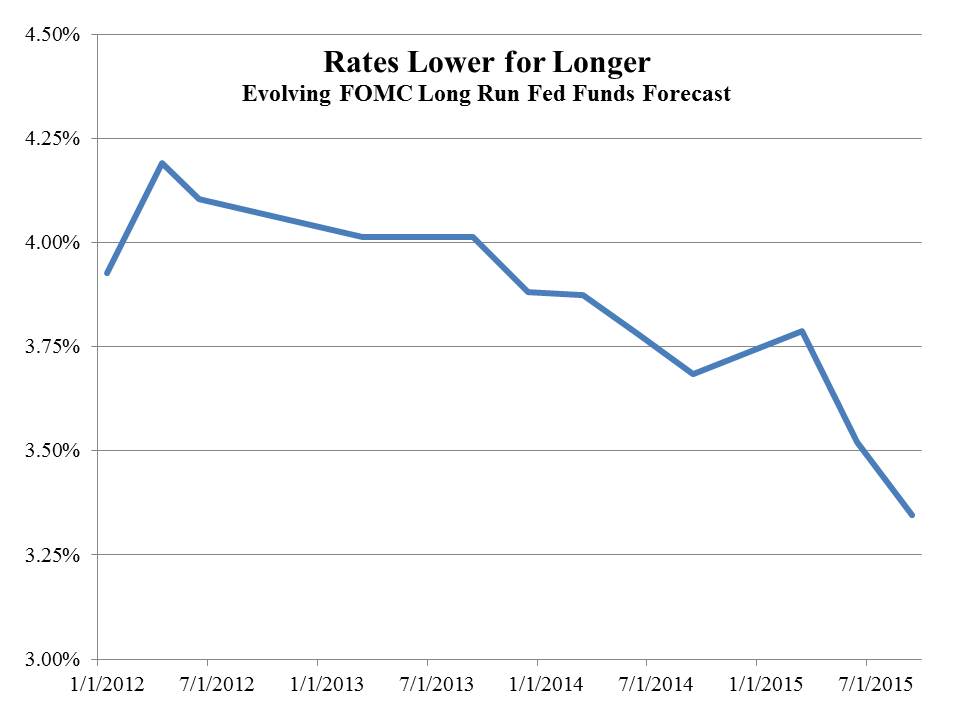
So what is the ERP telling us now? In 2012 the difference between yield on S&P500 earnings and ten year treasuries reached 5.6%, the widest since the 1970s and fully 5% above the 50+ year average. Interest rates were artificially low, and had they risen rapidly, the relative attraction of stocks would have quickly receded. But there were good reasons to expect low interest rates to persist, as I wrote in Bonds Are Not Forever; The Crisis Facing Fixed Income Investors. A financial crisis caused by too much debt required low rates to ease the deleveraging. Although bond yields have been rising, they’re still not historically high. The long term real return on ten year treasury notes is 2%. That suggests 4% is a neutral yield (2% historic real return plus 2% projected inflation). At a little over 3%, rates are still well short of neutral. It would take a jump of at least 2% in bond yields before they’d look historically attractive.

Although Trump is so far associated with a strong stock market, October’s rout has pretty much wiped out any positive return for the year. As Stephen Gandel pointed out in Bloomberg last week, on a valuation basis equities are now lower than they were before the 2016 election. In other words, earnings growth has outpaced the market.

Moderately rising bond yields combined with strong earnings growth that hasn’t flowed through to prices means that stocks look attractive. Today’s ERP of 2.9% isn’t as compelling as in 2012, but it’s wider than the prior couple of years. Moreover, next year it’ll widen to 3.6% because of earnings growth, the third best level in the past decade. Relative valuations can withstand a continued gentle move higher in interest rates.

An interesting way to compare stocks and bonds is to calculate how much of $100 you’d need to hold in equities, with the balance in cash (six month treasury bills, which yield around 2.5%), in order to replicate the return from holding ten year treasuries. It relies on some simplifying assumptions: that the current yield on the S&P500 persists, that tax rates won’t change, and an estimate for dividend growth (we used 4%). Keeping the dividend yield unchanged means stocks would appreciate at the same rate as dividends.

We’ve used this analogy for many years – see The Sorry Math of Bonds from October 2011. Back then, bond yields were 2% and we showed that a portfolio invested 20/80 between stocks and cash had a good chance of matching an investment in bonds. What was striking about that analysis was it assumed the 80% in cash earned nothing for the full ten years. Although short term rates were 0% back then, they were likely to rise over the following decade as they clearly have. That 20/80 allocation has worked very well.

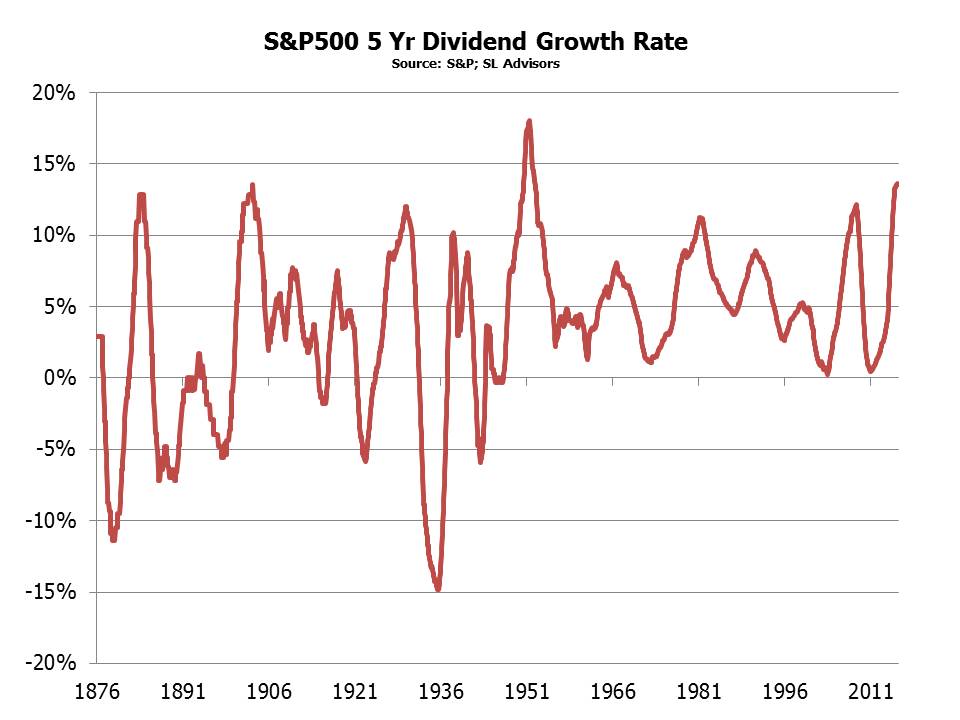
Today’s S&P yield is 1.8%, ten year yields are around 3%, and cash pays 2.5%. We’ll retain the 4% dividend growth rate we assumed before, although that’s probably conservative. The trailing growth rate is 8.65%.

The net result is that a 15/85 split between stocks and cash delivers the same return as 100% in bonds. In other words, stocks are relatively an even better bet.

This might seem surprising since bond yields have risen so as to be more competitive, and the dividend yield on stocks is lower. The big difference comes from cash rates, which are currently 2.5%. Cash is no longer trash, so it contributes to the return, whereas in our 2011 example it didn’t. And bond yields still aren’t that high. You pick up less than 0.75% by moving from short term to ten years, not much additional return for the risk.

It works because dividend growth is a powerful driver of returns. The static return on bonds is no match over the long run for rising S&P500 earnings which support dividend hikes. The tax code also favors dividends and capital gains over the ordinary income of bonds. Put another way, since the yield curve only offers 0.75% to move out on the curve, you don’t need much in a risky asset to generate that additional return.

Because we invest in energy infrastructure, we’ve also run the Math assuming you use the American Energy Independence Index (AEITR), yielding around 5%, instead of the S&P500. This is an index of the biggest North American pipeline companies, mostly corporations with 20% MLPs.

We expect 10% annual dividend growth on our index over the next couple of years, but conservatively assuming the same 4% as with the S&P500, a 6/94 split between AEITR and Cash would match bonds. Dividends are important, and because pipeline stocks yield more than bonds, the Math works powerfully.

The Equity Risk Premium shows that stocks are cheap. But if recent market volatility makes you want to move to fixed income, you can synthetically create your own bond with the 15/85 portfolio. For even the most bearish investor, the case for holding some equities remains a powerful one for the long term.


Bond Investors Agree With the Fed…For Now

The Federal Reserve has brought transparency to their decisions. The famous “blue dots” which show visually each FOMC voting member’s forecast for rates provides insight into their thinking, even if it doesn’t attach names to each dot. We’ve come a long way from Alan Greenspan’s Senate testimony, “Since becoming a central banker, I have learned to mumble with great incoherence. If I seem unduly clear to you, you must have misunderstood what I said.”

Transparency has removed the mystique. It’s now clear that the Fed doesn’t know much more than the rest of us about the economy. They’re also only average forecasters. Ever since the blue dots laid out the likely path of short term rates, which the Fed largely controls, they’ve consistently overestimated where they would set rates. It’s been a source of some amusement – if they can’t even forecast their own actions with accuracy, how can they forecast the economy?

10yr Treasury Yield Matches Feds Long Run Rate

Bond investors long ago concluded that rates would stay lower for longer than the FOMC thought. Ten year treasury yields approximately reflect the bond market’s expectation for short term rates over the next decade. If the FOMC’s thinking aligns with investors, the Fed’s long run forecast of the Federal Funds rate should be similar to the ten year yield. This is the neutral rate, the equilibrium that they regard as being neither accommodative nor restrictive. Historically, it was believed to be around 2% above inflation, for a “real” rate of 2%. Since the inflation target is itself around 2%, 4% was held to be the equilibrium Fed funds rate.

As the Fed provided greater transparency, it revealed a yawning gap between their thinking and that of bond buyers. The bond market turned out to be right, and low treasury yields correctly reflected that short term rates would rise very slowly.

Interestingly though, the Fed’s equilibrium rate also began to slide lower. Since their inflation target of 2% hasn’t changed, it means their equilibrium real rate has dropped to only 1%.

One of the enduring puzzles of the past 25 years is why inflation has been so well behaved. Countless forecasters have been wrong-footed in expecting inflation to rise – with the U.S. unemployment rate at 3.7%, the lowest in living memory, few could be surprised if inflation does move sharply higher. But the FOMC implicitly expects that a less restrictive (i.e. lower real rate) will be needed than in the past to slow things down.

With the Great Recession now ten years old and the need for ultra-low rates gone, views are starting to converge. The Fed’s moderating long run forecast has now crossed the ten year treasury yield. For the first time since the regime of greater transparency, the market and the Fed are in agreement.

However, if treasury yields continue to rise, this will show that the bond market’s forecast of equilibrium rates is higher than the Fed’s. It’ll cause commentators to worry that the Fed is reacting too slowly to the threat of inflation.

It looks likely the Fed Funds rate will approach the 3% equilibrium by next year. The Fed expects moves beyond those levels to become restrictive, which is a normal part of the rate cycle. The interplay between bond yields and Fed Funds forecasts will become more important. So far, investors have been more accurate than voting FOMC members. If treasury yields head towards 3.5% it’ll suggest that the FOMC has allowed their equilibrium rate to drift too low. In that case, expect more White House tweets on rates.


Down’s A Long Way for Bonds

In my 2013 book Bonds Are Not Forever; The Crisis Facing Fixed Income Investors, I forecast that interest rates would stay lower for longer than many people thought. The 2008 Financial Crisis was caused in part by excessive levels of debt. Interest rates below inflation are a time-tested way to gradually lessen the burden of a country’s unmanageable obligations. The book’s forecast was right, and more importantly the low rate strategy has succeeded. Household debt service costs have fallen as a proportion of income. U.S. GDP is growing solidly at 2.5% and possibly faster, and at 4.1% the Unemployment rate has fallen to levels that were previously associated with rising inflation. We are enjoying synchronized global growth. In short, regarding Low Rates: Job Done.

The Federal Open Market Committee (FOMC) has been unwinding its policy of extreme accommodation at a measured pace. Short term interest rates have been lifted from 0% to 1.4%. Bond yields have also been rising, with the Federal Reserve having announced last year the end of their bond buying program. Their balance sheet is close to $4.5TN, and although they’ll continue to reinvest interest income it will eventually start shrinking as their holdings mature.

Lastly, the 2017 Tax Cuts and Jobs Act was stimulative. Falling household debt service, synchronized global growth, no more Fed buying of bonds and tax stimulus are not likely to be supportive for bond prices.

It’s true that in recent years many forecasters have mistakenly expected rates to rise faster than they have. Although the FOMC is not known for frivolity, even they must have chuckled in embarrassment at their own forecasting errors. For several years now, the FOMC has issued forecasts for the Fed Funds rate (i.e. the interest rate they control directly) only to consistently undershoot. They correctly value achieving the right policy rate more than saving their blushes as forecasters.

The challenge for bond investors, as they contemplate the declining value of their holdings, is to identify their fair value. Using ten year treasury yields as a benchmark, what is its neutral level?

The news is not good. As we noted recently (see Rising Rates and MLPs: Not What You Think), the real return (i.e. the return above inflation) on ten year treasuries going back to 1927 is 1.9%. This means that today’s investors should require at least 4% (approximately, inflation plus the historic real return). A 4% yield would deliver the average real return assuming inflation averages 2% over the next decade. Although yields are rising, the current 2.8% ten year yield is inadequate on this measure.

Synchronized global growth and fiscal stimulus are both heading in the wrong direction for a bond investor. Although the FOMC is forecasting 2.5% U.S. GDP growth this year and 2.1% next, they maintain that the long run trend is only 1.8%. This is why they’re projecting higher short term rates over the next couple of years, as well as Personal Consumption Expenditures inflation (their preferred measure) creeping up from 1.5% last year to 2% next year. In a sign that a tightening labor market is stoking wage inflation, Friday’s Employment report included a 2.9% annual increase in hourly earnings, the biggest jump since 2009.

A few weeks ago we revisited the Equity Risk Premium (ERP), which shows that stocks are cheap, relative to bonds. The corollary is that bonds are expensive relative to stocks. Yields need to rise by around 2% to return the ERP back to its 50+ year average. Historical comparisons with real returns and relative valuation to equities both argue that today’s bond market is a poor investment. Although this has been the case for several years, now the fiscal and economic stars are aligned against fixed income. It means that, if yields move up through 3%, taking the prices of many other bond sectors lower, investors considering where valuation support might lie will find little of substance in their favor.

We’re not forecasting that yields will move sharply higher — but we are noting there’s nothing fundamentally attractive about today’s levels. Bear in mind also that few FOMC members can be regarded as inflation “hawks” (does anybody even remember the term?). They’ve been dovish, correctly, for years. If inflation does surprise to the upside, bond investors may need some visible reassurance from new FOMC Chair Jerome Powell that he possesses “inflation-fighting credentials”. Earning such credibility would require raising short term rates even higher.

In September, ten year yields were close to 2% before beginning their current ascent. The last time we saw a 2% increase in yields (i.e. what it would take to return to 4%, approaching long term fair value) was in 1999, when technology stocks were leading us into the dot.com boom and subsequent bust. A generation of market participants has not experienced a real fixed income bear market. As a retired bond trader friend of mine says, when you add all these factors up, for bond prices “Down’s a Long Way”.

Unlike fixed income, energy infrastructure does offer solid valuation support. Moreover, the correlation with bond yields is historically low and likely to remain that way. Few MLP investors expect stable, boring returns anymore and rising GDP growth is good for energy demand. Selling bonds that are substantially above fair value and switching into undervalued energy infrastructure aligns with the macro forces currently at work.

The American Energy Independence Index (AEITR) finished the week -6.5%. Since the November 29th low in the sector, the AEITR has rebounded 7.6%.


2017 Low Vol Outlook

Although we mostly write about the energy infrastructure sector, we also run an investment strategy designed around low volatility stocks. There’s generally less to say on this sector – we long ago concluded that exploiting the relative under-pricing of such stocks could not be improved much with market timing. So we hold securities we’d be happy to hold for years and generally don’t mess with it too much. We define low vol stocks as businesses that have a long history of steady earnings and dividend growth, above average return on invested capital, moderate need for ongoing capital expenditure, dividend yield above 3% and volatility approximately less than half that of the S&P500. We run three versions of this strategy: Low Vol Long Only, Low Vol Hedged and Low Vol Best Ideas. For more detail about this strategy see Why the Tortoise Beats the Hare and check out our Strategies page.

2016 was a good year for this type of investing – last January we had no idea this would turn out to be the case beyond a suspicion that mean reversion would cause 2015’s relatively flat results to be improved upon. Active managers tend to pick stocks that will move more than the market. Otherwise, demonstrating skill at security selection would take too long. Slow moving stocks deliver their results slowly, and if you’re going to fail at something it’s better to do so quickly so you can move on to the next thing. Consequently, low vol stocks experience little love from the CNBC crowd. This in turn makes them interesting if your goal is the best chance of steady, relatively tax efficient appreciation in your portfolio. We sometimes describe it as low octane equity exposure – good for someone who likes stocks but is wary of a big drop. These stocks will drop too, but generally not as far and when they are down at least they won’t give your wife reason to question your sanity (see How To Invest Like A Woman in our June 2014 newsletter).

We check the results of this strategy every day and I can tell you it’s impossible to predict its performance even if you know what the broader market has done. This low correlation with the S&P500 is complemented by a tendency to do relatively poorly in a strong market and relatively well in a weak one. In a hedged format one might expect it to lose money when stocks are up a lot and make money when they’re down, a useful form of diversification to most portfolios.

This brings us to the outlook for 2017. Since we noted in the first paragraph that we don’t see much benefit to timing this strategy, those looking for such insight will be disappointed. However, we have given more thought than normal to this issue because of the election. Trump’s victory didn’t just suggest alternative employment to pollsters; it has led to significant portfolio shifts as investors adjust to a sharply different outlook for many elements of Federal government policy including fiscal, trade, health care, regulatory and defense.

While the direction of Trump’s policies can be reasonably guessed at, their execution and possible unintended consequences are hard to assess at this point. Fiscal expansion with tax cuts will increase Federal borrowing. The Fed’s glacial pace of tightening will quicken, although on their forecast of three hikes in 2017 we’d take the under. A stronger US$ will moderate GDP growth from being quite as high as fiscal stimulus would otherwise drive it. The specific impact of trade conflict is very hard to predict.

It’s quite possible that stocks could deliver double digit returns next year, propelled by a cyclical upswing in earnings. Low vol stocks would not be the sector of choice in such an environment. Hedged low vol stocks might lose money.

The blogging investment manager creates countless opportunities for public embarrassment, and what follows is potentially another. Our inclination not to modify our low vol strategy in this light reflects not arrogant certainty, but instead a modest acknowledgment that tactical shifts are hard to do well. Investing is all about choices – it’s meaningless to describe an asset class as expensive except by reference to another, cheaper one.

It starts with interest rates, since they (1) define the discount rate at which future cashflows are valued, and (2) represent the main alternative to stocks. Yields on ten year U.S. treasuries may have put in their absolute low in 2016, but that doesn’t mean that they will quickly return to a level which discerning investors might consider attractive. We’ve noted before that the Federal Open Market Committee (FOMC) rarely misses an opportunity to do nothing when a previous Fed chair would have acted. Betting on them not doing what they threaten has worked for long enough now that there seems little point in overthinking things. We’d have to be surprised first before changing our view. So on the Fed’s forecast of three tightenings in 2017, we think two is more likely. For more on our past musings on Bonds see Bonds Are Dead Money.

Assume a ten year yield 0.50% higher at around 3%, and 2017 S&P500 Earnings Per Share (EPS) of $131.75 (the average of the FactSet Top-Down and Bottom-Up forecasts). The Equity Risk Premium in the chart above still favors stocks over bonds. We may be in an environment in which real interest rates (i.e. treasury yields minus expected inflation) are permanently low. If so, we’re unlikely to favor bonds anytime soon. The spread between yields and stocks would need to be at least 2% narrower before we’d assess bonds were competitive with stocks. We’re not holding our breath.

So if the S&P500 continues to offer better prospects than bonds, what about low vol stocks? The macro shifts outlined above have prompted many commentators to question their prospects. And yet, on a relative valuation basis using trailing Price/Earnings ratios, low vol stocks if anything look relatively cheap compared with the broad index. The two areas circled show the S&P500’s P/E of just over 21X with the S&P500 Low Vol Index figure of just under 20X, and compares with their history over the past three years.

The two charts aren’t definitive, but together they provide us with sufficient basis to be optimistic about the long run performance of our low vol strategies continuing. Forecasting the next couple of quarters is very hard, but over longer periods we believe we are increasingly likely to be happy with the result.


The Bond Market Loses Its Friends

In 2013, my book Bonds Are Not Forever; The Crisis Facing Fixed Income Investors presented a populist framework for evaluating interest rates. The prospects for the bond market can only be evaluated by considering the U.S. fiscal situation, which is steadily deteriorating along with that of many states. I was dismayed to read the other day of an analysis that places New Jersey (where I live) dead last behind even Illinois in its funding of public sector pensions. We have, at almost every level of government and household, too much debt.

The solution has, since the 2008 Financial Crisis been low rates. If you owe a lot of money low rates are better than high ones. Financial repression in the form of returns that fail to beat inflation after taxes is a stealth means of transferring wealth from savers (lenders) to borrowers. Count the central banks of China and Japan with their >$1TN in U.S. treasury holdings among those on the wrong side of this trade, along with many other foreign governments and sovereign wealth funds.

Some have argued that low rates only help the wealthy (through driving up asset prices); they impede lending (because lending rates aren’t high enough to induce banks to take risk); they force savers to save more (thereby consuming less) than they otherwise would, because returns are so low; and they communicate central bank concern about future economic prospects. Low mortgage rates help homeowners and drive up home values which helps McMansion owners but not first-time buyers. Low rates may be good for the wealthy, and by lessening the burden of the government’s debt they may indirectly help everyone. But to someone with little or no savings, the tangible benefits are not obvious even if they are real (through higher employment, for example).

Nonetheless, we are likely at the early stages of watching this benign process swing into reverse. The conventional result of lower taxes combined with higher spending should be a wider deficit, rising inflation and therefore higher interest rates. The bond market is already beginning to price this in through higher yields, well before any discussions of next year’s budget (or even the appointment of a White House Budget Director).

Part of the problem is that bonds don’t offer much value to begin with. They’ve represented an over-priced asset class for years, and it’ll take more than a 0.50% jump in yields to fix that. From 1928 until 2008 when the Federal Reserve’s Quantitative Easing program began distorting yields, the average annual return over inflation (that is, the real return) on ten year treasuries was 1.7%. This is calculated by comparing the average yield each year with the inflation rate that prevailed over the subsequent decade-long holding period of that security. So investing in a ten year treasury note today at 2% would, if the Fed hits its inflation target of 2% over the next ten years, deliver a 0% real return (worse after taxes).

Given the Federal Reserve’s 2% inflation target, even a 4% ten year treasury (roughly double its current yield) would appear to represent a no better than neutral valuation. The deficit was already set to begin rising again before even considering any Republican-enacted tax cuts and other stimulus (such as infrastructure spending). In fact, borrowing at today’s low rates to invest in projects that will improve productivity makes sense in many cases. But under such circumstances, with the possibility of inflation above 2%, perhaps a yield of 5% or even 6% is the threshold at which ten year treasuries (and by extension other long term U.S. corporate bonds at an appropriate spread higher) could justify an investment.

Holding out for such a yield is fanciful. Millions of investors demand far less, which is why we don’t bother with the bond market. Our valuation requirements render us wholly uncompetitive buyers.

Low rates may be the best policy for America, but it looks as if we’re about to try boosting growth through greater fiscal stimulus. The Federal Reserve will seek to normalize short term rates, perhaps faster than their current practice of annual 0.25% hikes. The twin friends of gridlock-induced fiscal discipline (sort of) and low rates are moving on, leaving fixed income investors to fend for themselves. Bonds are a very long way from representing an attractive investment.


Why the Tortoise Beats the Hare

There may have been a time when the long view predominated among investors, but if it did it’s more likely to be a fable than an historical fact. We live in an age when far too many investors are necessarily familiar with the Vix index (an index of equity market volatility), and this makes the decidedly unsexy world of low volatility investments especially appealing. People want to beat the averages, and they often try and do so in a hurry. In fact, one of the most reliable ways to win at investing is to be content at winning slowly.

We’ve run low volatility strategies for many years. We used to call them “Low Beta” to indicate their connection with the Capital Asset Pricing Model (CAPM) and a flaw we seek to exploit, but few people outside of Finance care about Beta and so this month we renamed them to be more plainly descriptive. The amount of return you expect depends on the amount of risk you’re willing to take; low volatility stocks suggest low returns, and yet investors who follow such a strategy wind up turning some of the worst instincts of other investors to their advantage. The renamed strategies are listed below. Nothing else has changed other than their names. Strategy descriptions are available on our website, or you can ask for more information.

New Name Old Name
Low Vol Long Only High Dividend Low Beta
Low Vol Hedged Hedged Dividend Capture
Low Vol Best Ideas Low Beta Long-Short


In our opinion, the persistent relative outperformance of low volatility stocks relies on an interesting behavioral finance quirk. A substantial portion of actively managed equity portfolios are benchmarked against an equity index, ranging from large separately managed institutional accounts to retail-focused mutual funds. Because the investors are human, they tend to focus most closely on the relative performance of their chosen manager when returns are positive; when returns are negative they’re more concerned with the magnitude of the losses rather than whether they look good compared with a benchmark. Just think back to your own experience of evaluating positive and negative investment results to see if this reflects your own biases. We ought to value beating the benchmark by 2% in any year, but it turns out to be more valuable when returns are positive.

Active managers on average respond to this by structuring portfolios that are more likely to outperform a rising market. This is most easily done by investing in stocks that have higher beta (or volatility) than the market because they will probably go up faster. Their proclivity to fall faster hurts the manager less, since assets are best raised in a rising market. Therefore, equity managers who are not personally invested alongside their clients have an incentive to run portfolios that are more risky than the market. An alternative interpretation is that investors inadvertently favor such managers, but in any event it’s why low volatility stocks outperform. Although low volatility stocks are widely owned, they’re not widely owned by active managers because they don’t rise enough in a bull market.

This is a form of principal-agent risk, and the most effective alignment of interests is to ensure that your chosen active manager is substantially invested alongside the client. This is what we practice at SL Advisors, and in 2015 low volatility exposure provided a welcome distraction from the turmoil of MLPs.

Some pundits regularly lament the increasingly short-term nature of today’s investors. John Kay’s recent book Other People’s Money; The Real Business of Finance is a fascinating read for those who fret that today’s capital markets are overly dedicated to trading rather than their more appropriate purpose of efficiently channeling savings to those businesses that can deploy capital in attractive ways. I am increasingly in that camp. The media, and most especially broadcast media, meets a very real need of their viewers to figure out where the market’s going today. It should be a misplaced need if you’re investing for the long run but today’s extraordinarily cheap access to public equity markets is wonderful if not wholly beneficial. The narrow difference between a day trader in stocks and one who spends his days betting on sports renders both little more than punters managing their shrinking capital.

The case that the short term outlook rules isn’t limited to perusing the media. Some of today’s investment products provide additional evidence. Leveraged ETFs, the subject of a blog in June 2014 (see Are Leveraged ETFs a Legitimate Investment?) are not intended to be used as part of any long term investment strategy and their prospectus plainly says so. Their successful existence illustrates the demand for cheap ways to bet on the market’s direction. Consenting adults are generally free to engage in any behavior they wish as long as it doesn’t hurt anybody else. Since such investments eventually have to go to zero (see “Compounding” below), the facilitation of self-harm to the buyers of one’s products surely puts the seller in the company of casino owners if not worse.

Tortoise v Hare Blog Jan 31 2016

Compounding returns has long been a reliable way to build wealth, but it’s important to make it work for you. Most readers will be aware that a 10% drop in a security requires an 11% jump to get back to even. Lose half your value and prices then need to double. This means that a security that is up 2.00% on half of trading days and -1.96% on the other half will remain stubbornly at your purchase price in spite of the up days being bigger than the down days. However, obtaining such exposure through a 2X Leveraged ETF, which has to rebalance its leverage every day, would have you lose 10% in the course of a year. Maintaining constant leverage causes you to buy more of the asset after it’s risen, and sell more after it’s fallen, a self-destructive course of action. In the stylized chart of two growing companies, Hare and Tortoise (Source: SL Advisors), Hare grows earnings at 10% annually with one stumble when they drop 20%. Tortoise grows at 6.55% every year, thereby equaling Hare’s 10 year compound growth rate. They reach the same place, but you’d rather own Tortoise for the less stressful ride even though their visible growth rate is only two thirds of Hare. The power of compounding works best with low volatility.

Closed end funds, perhaps most spectacularly including those focused on Master Limited Partnerships, employ leverage. As bad as the Alerian Index was in 2015 at -32.6%, it was possible to do far worse. A Kayne Anderson fund (KYN) lost 51% in part because it was forced to reduce leverage following market drops, as noted in last month’s newsletter. Two leveraged MLP-linked exchange traded notes (ETNs) issued by UBS did even worse, as briefly noted at the end of a recent blog (How Do You Break a Pipeline Contract?).

This letter began by expounding on the beauty of low volatility before moving on to the perils of leverage. If it’s not already clear, they are connected. Positive returns that don’t vary that much will often get you to a better place than those that fluctuate widely. Compounding works better with low volatility. It’s an area of investing where the low volatility, boring tortoise beats the volatile hare. If Aesop was a client of SL Advisors today, he would be in our Low Vol Strategy.


Growth Prospects So Good We'll Cut Our Payouts to Investors

Thursday saw another example of tone-deaf decision making by the management of an MLP. Teekay LNG Partners (TGP) is an operator of ships that transport Liquified natural gas, petroleum gas and crude oil. Shipping is a horrible business; unlike pipelines, ships are highly mobile and so you’re never the only transport solution from A to B. On top of that, when industry overcapacity drives a ship owner out of business the ships live on, still contributing to the pressure on rates. Bankrupt shipping companies could provide a service to their competitors by scuttling their ships, but unfortunately they never do.

TGP cut their distribution by 80% on Thursday, claiming that they would fund their growth plans with internally generated cashflow since the equity markets are effectively closed to them.  In other words, the opportunities to reinvest cash in their business are so good they’re taking the decision out of their investors’ hands and redirecting the cash for them. Even though TGP was yielding 15% prior to the announcement, this implausibly high distribution yield evidently wasn’t reflective of widespread expectation of a cut since the stock promptly sank 50%. This may be due to the fact that although TGP’s press release claimed that “cash flows remain stable and growing” the company declined to provide any guidance for 2016 EBITDA. So it’s hard to know if they’re telling the truth. MLP investors value their regular distributions, and the persistent high yields on MLPs indicate that investors would prefer growth plans to be cut. A management that ignores this is looking for a new set of investors, a betrayal of the trust placed in them by the original ones. In fact, there’s something bordering on dishonesty about what TGP has done. If your operating results aren’t good enough to cover the quarterly payout, well that’s a risk that investors accepted. But TGP claims that business is good, cashflows “stable and growing.” Deciding to stop making payments to investors in order to reinvest the cash in new projects is to deny the message that the already high yield communicates. Investors don’t value those growth opportunities very highly, which is why TGP had already fallen 50% this year before the cut. There’s not much difference between TGP’s behavior and a hedge fund manager who prevents withdrawals by claiming unreasonably low prices on the securities he’d have to sell to meet the redemption. If they’re telling the truth about operating performance then they’re taking investors’ money to invest as they see fit, simply because they can, in spite of the fact that investors would clearly prefer that they did not. Or, operating performance is not as good as they say. Either way, it’s hard to see how management can regain trust after such  betrayal.

The other day one MLP investor was reeling off to me a list of tickers of MLPs that he owns, including well-known names such as EPD, ETP and PAA. He noted his portfolio also included regrettable overweights to OMG and WTF. It’s been that kind of year.

While we’ve wrestled with understanding operating performance, it’s increasingly clear to us that investor psychology is far more important in explaining returns on MLPs this year. U.S. K-1 tolerant high net worth investors remain the chief source of capital for MLPs. Crossover buying by U.S. and foreign institutions is impeded by significant tax barriers, so the sales made by ’40 Act MLP funds as their investors flee have a limited set of potential buyers. We’ll be exploring this more in our 2015 letter.

We are invested in EPD.


Bond Yields Reach Another Milestone

Recently, an important threshold was breached in terms of relative valuation between stocks and bonds. The yield on ten year U.S. treasuries drifted below the dividend yield on the S&P 500. It’s happened a couple of times in recent years but only because of a flight to quality and never for very long. This time looks different.

It’s worth examining  this relationship over a very long period of time. The chart below goes back to 1871 and reminds us that for decades stock dividends were regarded as risky and uncertain. Little attention was paid to the possibility of dividend growth, and investors clearly placed greater value on the security of coupon payments from bonds.

This spread began to reverse in the late 1950s and since then, during the careers of a substantial percentage of today’s investors, bond yields have remained the higher of the two. Dividend growth (defined as the trailing five year annualized growth rate) was more variable prior to the 1950s with several periods when it was negative, so it’s understandable that investors of the day regarded dividends as quite uncertain. However, since the S&P500 dividend yield dipped below treasury yields, dividend growth has never been negative. The five year annualized growth rate since 1960 is 5.8%. Assessing a long term return target for equities is inevitably a combination of art and science, but adding a 5% growth rate to today’s 2% dividend yield suggests 7% is a defensible assumed return.S&P Yield Minus 10 Yr Treasury Oct 23 2015

The trend of bond yields to decline towards dividend yields began a long time ago – back in 1981 when interest rates and inflation were peaking. It’s taken over 30 years, but the relationship is now back where it was during the Korean War. The investment outlook is, as always, uncertain with multiple areas of concern. However, the Federal Open Market Committee has made it abundantly clear that rates will rise slowly; recent earnings reports from Coke (KO), Dow Chemical (DOW), Microsoft (MSFT) and Amazon (AMZN) have all been good. These and many other stocks are near 52-week highs and in some cases all-time highs. FactSet projects earnings and dividends to grow mid to high single digits over the next year. These considerations are once again highlighting the inadequacy of fixed return securities as a source of after-tax real returns, and with one major asset class devoid of any value investors are again turning to stocks. The tumultuous markets of late August and September are receding; rather than portending a coming economic collapse, they simply represent additional evidence that far too much capital employs leverage.

S&P Dividend Growth Rate October 23 2015

The long term trend suggests that treasury yields will remain below dividend yields for the foreseeable future. We’re not forecasting such, simply noting that a 2% yield that is likely to grow on a diversified portfolio of stocks looks a whole lot more attractive than a 2% yield that’s fixed. It didn’t look so smart in recent weeks, but if you don’t use leverage and restrict yourself to companies with strong balance sheets you can watch such shenanigans from the sidelines.

Master Limited Partnerships (MLPs) have begun reporting earnings. Kinder Morgan (KMI) disappointed investors by trimming their 2016 dividend growth from 10% to 6-10%. KMI isn’t technically an MLP any more since they reorganized into a C-corp last year. However, they are squarely in the energy infrastructure business like midstream MLPs. Rather than issue equity to fund their growth projects, they plan to access an alternate, not yet disclosed source of capital through the middle of next year. Their free cashflow covers their distribution, and they access the capital markets to finance growth.

MLPs have had a torrid year, with the sector down far more (in our view) than lower crude oil would justify. As Rich Kinder said, “…we are insulated from the direct and indirect impacts of very low commodity environment, but we are not immune.” KMI owns pipelines and terminals; 54% of their cashflows come from natural gas pipelines; 11% come from a CO2 business that supports oil production; they transport about a third of the natural gas consumed in the U.S. 96% of their cashflows are fee-based or hedged: “insulated…but not immune”.

Selling energy infrastructure stocks is fashionable, and owning them is not. While bond yields are dipping below the S&P’s 2% dividend yield, KMI yields more than three times as much (7.25% on its 2016 dividend assuming the low end of the 6-10% growth range) and its dividend will grow at least as fast. Owning such securities will once more be fashionable.

We are invested in KO, DOW and KMI.


A Hedge Fund Manager Trading At A High Yield

Many years ago, in a different investing climate and a different decade, a cut in interest rates was usually regarded as a stimulative move by the Federal Reserve. Lower financing costs were regarded as helping the economy more than hurting it. They certainly help the U.S. Federal Government, as the world’s biggest borrower. The amount of treasury bills issued at a 0% interest rate recently reached a cumulative $1 trillion. Although declining interest rates adjust the return on lending in favor of the borrower and at the expense of the lender, a lower cost of capital stimulates more borrowing for more investment and consequently boosts demand. However, the intoxicating nectar of ultra-low rates is gradually losing its potency, and while it’s overstating the case to say that markets would cheer higher rates, certain sectors would and the confirmation of an economy robust enough to prosper without “extraordinary accommodation” as the Fed puts it would be novel to say the least.

Several major banks released their quarterly earnings over the past week. Balance sheets continue to strengthen, but another less welcome trend was the continued pressure low interest rates are imposing on income statements. Deutsche Bank expects most major banks to report declining Net Interest Margins (NIMs) as older, higher yielding investments mature and are replaced with securities at lower, current rates. JPMorgan expects to make further operating expense reductions since quarterly earnings were lower than expected.

It’s a problem facing millions of investors. The timing of a normalization of interest rates, which is to say an increase, is both closely watched and yet seemingly never closer. If you look hard enough you can always find a reason to delay a hike, and the Yellen Federal Open Market Committee (FOMC) looks everywhere. Recent speeches by two FOMC members suggest a December decision to hike may not receive unanimous support. The FOMC’s long run rate forecasts continue to drop, as shown in this chart (source: FOMC).FOMC Rate Forecast Sept 2015

Income seeking investors are unlikely to find much solace in the bond market. As I wrote in Bonds Are Not Forever, when rates are punitively low, discerning investors take their money elsewhere.

Suppose you could buy equity in a hedge fund manager, a fanciful suggestion because they’re virtually all privately held. But suppose just for a moment that such a security existed. The question is, how should you value this investment? What multiple of fees to the manager would you be willing to pay or in other words what yield would entice you into this investment?

Hedge fund managers don’t need much in assets beyond working capital and office equipment; the assets they care about sit in the hedge fund they control. So let’s consider a hedge fund manager’s balance sheet which consists mostly of a small investment in its hedge fund, representing a portion of the hedge fund’s total assets, and a bit of cash. It has virtually no debt. Our hedge fund manager earns income from its hedge fund investment, as well as a payment for managing all of the other assets that sit in the hedge fund. These two revenue streams are roughly equal today and constitute 100% of the hedge fund manager’s revenue. The fees charged by the hedge fund manager for overseeing the hedge fund aren’t the familiar “2 & 20”, but are instead are currently 13% of the free cash flow generated by those assets and 25% of all incremental cash flows going forward. Moreover, the equity capital in the hedge fund is permanent capital, which is to say that investors can exit by selling their interests to someone else but cannot expect to redeem from the hedge fund. Meanwhile, our hedge fund manager can decide to grow his hedge fund and thereby his fee stream for managing its assets by directing the hedge fund to raise new capital from investors. This represents substantial optionality to grow when it suits the manager by using Other People’s Money (OPM). This hedge fund’s assets are not other securities but physical assets such as crude oil terminals, storage facilities and pipelines. The hedge fund is returning 9% and is expected to grow its returns by 4+% annually over the next few years.

The hedge fund manager in this example is publicly traded NuStar GP Holdings, LLC (symblol: NSH), the General Partner (GP) for NuStar Energy, LP (symbol: NS). NSH, by virtue of being the GP of NS and receiving Incentive Distribution Rights (IDRs) equal to roughly 25% of NS’s incremental free cash flow, is compensated like a hedge fund manager. NS, a midstream MLP,  is like a hedge fund, albeit the good kind with far more reliable prospects and greater visibility than the more prosaic kind, whose returns have generally remained poor since I predicted as much in The Hedge Fund Mirage four years ago. To return to our question: at what yield would you buy this hedge fund manager’s “fees”, given its option to increase the size of its hedge fund, the hedge fund’s respectable and growing return, the permanence of its capital and the perpetual nature of its substantial claim to the hedge fund’s free cash flow? NSH currently yields 7.6% which should increase ~10% annually over the next several years based on the company’s capex guidance at NS.

We are invested in NSH.


Bonds Are Dead Money

If you aspire to achieve acceptable returns from bond investments, the Fed is in no hurry to help you. They have other objectives than ensuring a preservation of purchasing power for buyers of taxable fixed income securities. Their failure to raise rates on Thursday is not that important — what’s more significant is the steadily ratcheting down of their own forecasts for the long term equilibrium Fed Funds rate.

For nearly four years the Fed has published rate forecasts from individual FOMC members (never explicitly identified) via their chart of “blue dots”. They now produce a table of values so there’s little ambiguity about its interpretation. Traders care mightily about whether they’ll hike now or in three months. It’s all CNBC can talk about. For investors, the Fed’s expectation for rates over the long run is far more interesting.

Since you might expect long run expectations about many things to shift quite slowly, by this standard the Fed’s long run forecast has plunged. The steady downward drift accelerated in recent meetings and it’s now fallen more than 0.5% since last year, to 3.35% (see chart). What this means is that their definition of the “neutral” fed Funds rate (i.e. that which is neither stimulative nor constraining to economic output) is lower. They don’t have to raise rates quite as far to get back to neutral.

Their inflation target remains at 2%, although inflation, at least as measured, is clearly not today’s problem. So the real rate (i.e. the difference between the nominal rate and inflation) has now come down to less than 1.5%. Since bond yields are in theory a reflection of the average short term rate that will prevail over the life of a bond, the Fed believes investors in investment grade debt with negligible default risk should expect this kind of real return. For a taxable investor, this will result in more or less a zero real return after taxes.

FOMC Rate Forecast Sept 2015The Fed’s communication strategy has  not been that helpful over the short run. Although we are provided with far more information about their thinking, it simply reveals that they don’t know much more than private sector economists and like them are always waiting for more information. The FOMC doesn’t want to provide firm guidance, since that requires a commitment which results in lost flexibility (see Advice for the Fed). The evenly split expectations for last Thursday show that forward guidance hasn’t helped traders much. But that doesn’t matter for investors; the insight into their long term thinking, presented as it is in a quantitative form, really is useful.

Hawkish is not an adjective that will be applied to this Fed anytime soon. In fact, one FOMC member included a forecast for a negative Fed Funds rate by year-end, a no doubt aspirational forecast but probably the first time an FOMC member has advocated such a thing. The Fed chair is clearly among ideological friends. Janet Yellen’s deeply held feelings for the unemployed inform her past writings and those of her husband George Akerlof. These are admirable personal qualities and not bad public policy concerns. Given that inflation remains below the Fed’s target, monetary policy can remain focused on doing all it can to promote growth, thus raising both employment AND inflation. Wgat some perceive as the Fed’s short run trade-off between maximizing employment and controlling inflation is unlikely to be tested anytime soon. Rates will rise slowly, because the future is always uncertain and because the neutral policy rate is in any case steadily falling towards the current one.

The low real rate contemplated by the Fed reflects their lower estimate of the economy’s growth potential. This is not a contentious view, it’s just that we’re seeing it play out through their rate forecasts.

The clear implication for bond investors though is that it’ll be a very long time before they make any money. The Barclays AGG is +0.64% YTD. This is the type of return bond investors can expect. Taxable investors are losing money in real terms and the Fed hasn’t even begun raising rates yet. Moreover, it’ll be years before this Fed gets bond yields to levels where a decent return is possible. It’s as I said two years ago in Bonds Are Not Forever; The Crisis Facing Fixed Income Investors. Bond holders are in for years of mediocre results or worse. It’s not going to be worth the effort. Take your money elsewhere.