Hertz is on its Way to a New Driver
Sometimes being invested in a stock can feel like being trapped while the enemy takes shots at you from all sides. You were expecting reinforcements to arrive at this exact spot, and while you know you can hang on it sure would be nice to not be fighting this battle alone.
Then, out of nowhere arrives the U.S. Cavalry and although the fight’s not over, you finally believe that victory might be at hand. The stock in question is Hertz (HTZ), which we own, and right now Carl Icahn looks a lot like the U.S. Cavalry.
When an industry has two big publicly traded competitors, comparing their performance is an obvious element of researching their investment potential. HTZ and Avis (CAR), along with privately held Enterprise, dominate the North American car rental market. Consolidation has dramatically improved the prospects for the surviving firms, by reducing competition and thereby allowing price hikes. Rental firms are also making better use of their biggest asset, which is cars. HTZ for example owns Dollar Thrifty and can recycle cars from the Hertz brand whose customers expect a newer car downstream to a lower price point, thereby getting more use out of their cars before selling them. HTZ and Avis are also experimenting with hourly rentals which turn out to be complimentary to their traditional business (business travelers rent for days during the week while hourly renters are typically on weekends). In short, the fundamentals for the business are great.
To examine the periodic public comments from HTZ and Avis you would think they operate in completely different environments. Avis introduced their 2Q results with the following summary, “Our strong second quarter results were driven by our continued growth in both volume and pricing in North America and our relentless focus on accelerating growth in our most profitable channels,” said Ronald L. Nelson, Avis Budget Group Chairman and Chief Executive Officer. “Summer volume and pricing have continued the trends we saw in the first half of the year, and we expect to post record results in our third quarter.”
Meanwhile HTZ, which hasn’t filed a comprehensive financial report this year due to accounting software issues, recently said, “The Company now expects to be well below the low end of its 2014 guidance due to operational challenges in the rental car and equipment segments…”
The operational challenges in the rental market are self-inflicted. The company has been wrong-footed by higher than expected demand combined with recalls on some of their models, with the odd result that, as noted in their recent 8-K filing “Fulfilling advance reservations and contracted business consumed the majority of available fleet. This left the company without inventory to capture more of the higher-rate leisure close-in rentals, which typically generate greater ancillary sales.”
HTZ is a company begging for new leadership. They’re shooting themselves in the foot when their biggest competitor is growing its EBITDA by 19% and expecting a record 3Q. As well as performing poorly, HTZ keeps requesting more time to produce restated financials for 2011-13. It increasingly looks to be just a matter of time before some adult supervision gets involved.
That’s the beauty of investing in public companies. You’re not alone. Carl Icahn has a wonderful quote on his blog from comments he made at a 1988 Texaco annual meeting: “A lot of people died fighting tyranny. The least I can do is vote against it.”
Icahn doesn’t appear to have lost any appetite for a fight during the subsequent 26 years. In the 13D disclosing his 8.7% holding in HTZ, “… lack of confidence in management” was listed as one of the reasons. We share that view. Other notable investors include Glenview (run by Larry Robbins) and Fir Tree (run by Jeffrey Tannenbaum). They’re also fed up with the ongoing mistakes. Tannenbaum recently said that HTZ CEO Mark Frissora, “has completely lost credibility.” We look forward to some fireworks, and to Mark Frissora devoting more time to his golf game.
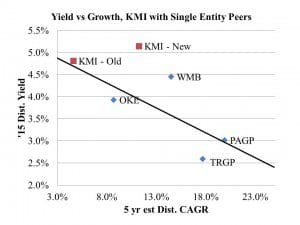 liminated its IDR and cleverly created $20BN of tax savings, it has a higher dividend with better growth prospects than before. Conventional valuation of KMI compares it with other C-corps that own their GP and have an MLP underneath on which they rely to fund capital investments and funnel cashflows back up to the GP. KMI’s peer group in this regard includes Oneok Inc (OKE), Williams Companies (WMB), Targa Resources Corp (TRGP) and Plains GP Holdings (PAGP). Generally, faster growth prospects (defined here as 5 year estimated Distribution Compounded Annual Growth Rate) dictate a lower yield, and so the chart to the left illustrates where these securities lie. KMI-Old (i.e. before the announcement) was on a regression line linking its peers, but we liked it because we felt there was the possibility of a transformational transaction such as the one we’ve just seen, KMI-New appears to be a relatively more attractive security because its better growth prospects don’t appear to be fully reflected in its yield. If KMI’s yield dropped down to the regression line its price would be around $50 versus its current level of $39.50 (we’ve assumed they buy back the outstanding warrants at current prices and adjusted their sharecount accordingly). So we still own KMI.
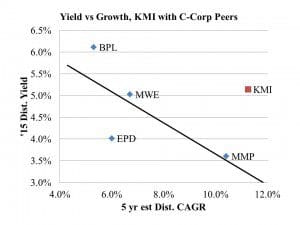 heir simplifying transaction closes later this year that will no longer be the case. KMI will actually look more like a different peer group, consisting of MLPs that no longer have a GP. This peer group includes Buckeye Partners (BPL), Enterprise Products Partners (EPD), Markwest Energy Partners (MWE) and Magellan Midstream Partners (MMP). The revised Yield vs Growth chart comparing KMI with this new peer group is on the right. If KMI was on the new regression line its price would be around $61.