6% Yields on MLPs Are Looking Attractive

Another day and another new low for crude oil. Since stocks are moving with oil, trying to figure out the short term direction of the equity market requires being an oil trader. Few of us are any good at this although it’s easy to have an opinion. For our part, we don’t bet on the direction of oil although many of our investments react to it so we’re certainly experiencing the moves.

Master Limited Partnerships (MLPs) as I write this are close to flat on the year (as represented by the Alerian index). Distribution yields have drifted up to 6%. Midstream MLPs care about volumes of product, crude and refined, that they gather and process, store and transport. Lower oil is currently forecast to add 0.5% to US GDP in 2015 as the tax cut that it represents feeds through to higher consumption. Energy demand is unlikely to fall, and obviously should increase at the margin. Americans will drive a little more and worry a little less about conservation. The outlook for MLPs is generally good.

The shale boom may slow, with reductions in capex and therefore at the margin some growth projects that could fuel faster distribution growth may be delayed or cancelled altogether. U.S. oil production may not grow as fast as expected. Of course, it’s not only U.S. production that may slow. Halliburton announced 1,000 job cuts in response to weaker demand for their services across Europe, Russia, Africa and the Middle East. Day rates for offshore drilling are plummeting as reported by Transocean (RIG) and Diamond Offshore (DO). The U.S. is one of the few places where productions costs are falling. Range Resources (RRC) has been reducing its output costs of natural gas from SW Pennsylvania by 7% annually for several years.

Seasonally, MLPs typically rally in December and January as retail investors reallocate cash. So far December is not typical. But 6% yields are attractive with even half the growth you thought MLPs might be generating, and there’s certainly no reason to expect any demand destruction which is what most hurts their businesses. Falling asset prices are never pleasant for the holders of those assets. But an unleveraged investment in MLPs at today’s levels is likely to look prescient a year from now.


A Good and a Poor View on the Value of Liquidity

A couple of months ago Roger Ibbotson and I were both presenters at a CFA Conference in Toronto. Ibbotson is a professor of Finance at Yale School of Management and also chairman of Zebra Capital Management, an investment firm whose style of investing reflects his work. Liquidity as an Investment Style was the title of his presentation, based on his recent academic paper.

Investors like liquidity. Not everybody agrees on its definition; for some it is measured by volume. This superficial metric is used by proponents of High Frequency Trading (HFT), since they argue more volume is always good for investors. The issue of HFT’s utility to markets is complex, albeit more widely debated thanks to Michael Lewis’s book Flash Boys. But measuring volume alone is too simplistic because it doesn’t capture potentially adverse activity by algorithms that can increase the costs of trading for others. The actual transaction cost incurred by an investor is a more useful measure, although devilishly hard to measure precisely. Some look at the bid/ask spread to estimate this; institutions that trade heavily use more sophisticated tools that compare their actual transaction prices with market prices prior to their activity to estimate their cost to trade.

Private equity investors often set their return target with reference to returns in public equity markets, such as 5% over the return on the Russell 2000 (a small cap index more reflective of the companies that private equity funds finance). Our strong preference for the flexibility to change our minds makes private investing highly unattractive, so we only invest in publicly listed companies. It’s not that we trade a lot – in fact, far from it. But liquidity reduces the penalty for mistakes and their early recognition allows redeployment of capital to more attractive places. Investment relationships with private equity managers can last ten years or more, and if the actual outcome doesn’t resemble the glossy brochure shared at inception, it can truly feel like purgatory.

Moreover, when you dig into the research it turns out that the illiquidity return has a very narrow source. It comes from a handful of stocks in the bottom quartile of liquidity suddenly becoming momentum stocks, no doubt because of a positive development. The vast majority of illiquid stocks stay that way; over the period covered (1972-2011), just 1% jump from the bottom to the top quartile, more than doubling in value as they go (returning 109%). Another 3.5% jump to the next highest quartile, returning 61%. So if you own the bottom quartile of stocks you might expect that 4.5% of them will generate just over a 3% excess return (that is, 1% X 109% added to 3.5% X 61%). That’s a good portion of what the phenomenon is worth, and such a narrow source of return likely means that it varies substantially from one year to the next. If the annual returns to illiquidity vary widely, investors are likely to experience markedly different outcomes from seeking to exploit it. This also makes it much harder to persist with the strategy during the inevitable disappointing years, and means it’s probably hard to profit from the concept.Liquidity as an Investment Style takes the view that less liquid stocks offer higher returns than more liquid ones. If liquidity is desirable then it makes sense for investors to set higher required return targets for securities whose entry and exit is more costly. This is not news for most people, but Ibbotson’s paper seeks to measure the additional return illiquidity offers. It goes on to posit that illiquidity itself can be a source of “excess return”. There are some factors that are already acknowledged to be a long term source of return. Value Investing is one (variously defined, but generally a focus on stocks with low P/E ratios or sometimes low Price/Book Value). Momentum is another, which consists of buying what’s going up and dumping what’s going down. Such concepts work more often than not, but by no means all the time. The idea that Illiquidity could be another factor like these is interesting, although personally I’m less comfortable with it. The lower return that liquid stocks offer (think of it as the “liquidity discount”) provides the holder with the comfort of an easy exit should they so decide. Stocks are not just sold because of bad news. Sometimes investors need cash for reasons quite unrelated to what they’re selling, maybe for reasons that were not anticipated. A self-styled long term investor owning illiquid stocks to profit from this may be surprised to find their outlook is not as long term as they thought. Liquidity provides the flexibility to change your mind, and in that respect is different than the factors such as value or momentum listed above.

Nonetheless, it is an interesting perspective and worth reading if you care about such things. That illiquidity should offer higher returns is widely accepted in Finance.

Not everybody agrees, however. To find the naysayers we must revisit a topic I have covered before, non-traded Real Estate Investment Trusts (REITs). This particular backwater of Wall Street seems to harbor many of the things that give Finance a bad name. Non-traded REITs (NTRs) are notable for underwriting fees as high as 15% (paid by the investor and shared with the broker recommending the investment); additional fees when the NTR buys properties, maintains them and sells them; numerous conflicts of interest; and no public market liquidity. As registered securities they can be sold to anybody. As unlisted securities they don’t draw much research because there are no commissions to be earned from trading. Their multiple investor-unfriendly features are why their sponsors operate in that regulatory gap: an illiquid security whose sale would normally be restricted to sophisticated investors, but whose SEC registration renders them publicly available.

While the illiquidity of NTRs ought to mean they have a higher expected return (i.e. need to be sold to investors at a lower price to compensate), some proponents have sought to turn this hitherto unattractive feature into a selling point. Sameer Jain is the Chief Economist of American Realty Capital (a big distributor of NTRs). Jain is a graduate of both MIT and Harvard, so presumably has a passing familiarity with financial theory. And yet, on a website recommending his chosen sector he lists as one of the advantages, “Illiquidity that favors the long-term investor”. As he goes on to explain, liquid REITs are inferior because “…the share price can drop below the value of the underlying real estate”. By contrast, because you can’t sell an NTR you benefit from, “…the inability of investors to “panic sell” their securities.”

Jain further notes that conventional, publicly traded REITs are subject to more market volatility than NTRs which, he asserts, makes them more risky. This is because NTRs don’t trade, and they update their asset values infrequently. Of course, publicly traded REITs aren’t inherently more risky, their prices are simply more current. Yet Mr. Jain argues that, because your brokerage statement will show fewer fluctuations in NTRs (because there are no new prices), rational investors (as oddly defined by Jain) should demand a higher return for publicly traded REITs versus the NTRs he prefers. He wants you to choose the illiquid security over the liquid one. This is in spite of the fact that the Financial Industry Regulatory Authority (FINRA), which regulates American Realty Capital, has a warning on its website that the, “Lack of a public trading market creates illiquidity and valuation complexities for NTRs.”

What’s wrong with this is that Sameer Jain’s educational background leads the casual reader to assume he’s intelligent. Evidently, the presumption of a high IQ should not be confused with a genuine desire to offer investors good advice. It’s hard to comprehend why he holds such a view, and causes one to consider an alternative plausible explanation, that he’s disingenuously offering “advice” that benefits his business while believing something different. When Wall Street analysts were caught doing this during the dot.com bubble it resulted in large fines and the subsequent inclusion of an Analyst Certification on every report saying that the writer believed what he wrote. Of course it shouldn’t have been necessary, and yet you can still find examples of people writing what they surely know cannot be right.

It’s what gives Finance a bad name. Daylight is often the best disinfectant.

This was originally published in our December newsletter. 


Health Care Versus Energy Within the S&P500

The chart below shows the performance of different sectors of the equity market so far this year. Of course, there are always sectors that are outperforming, so nothing much new there. However, if in general as an investor you don’t commit much to health care and you are overweight energy, recent months have likely given you reason to examine comparative performance rather more closely, as we have. If in addition you’ve had a couple of small positions in smaller energy names, you’ve also experienced first hand the relative underperformance of small cap stocks versus the market. Suffice it to say that the results of owning a handful of large health care stocks and being short a smattering of small energy stocks would have been about as perfect a position to hold over the last three months.

"Energy
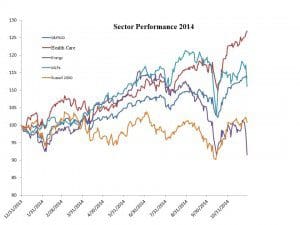
The chart tells the story, but to put numbers on it, while the S&P500 is +14% this year, Healthcare (defined as XLV, the sector ETF) has returned almost double at +27% while Energy is -19%. A good portion of the Health Care/Energy relative performance has occurred just in the past three months (28%). Interestingly, the daily returns of MLPs have been most highly correlated with Energy (64%), even though MLPs have outperformed Energy by a whopping 19.5%. In fact, at +11% for the year the performance of MLPs is not far short of the S&P500.  What’s happened is that bigger than typical daily falls in Energy spill over to MLPs even though midstream energy infrastructure (what most MLPs are engaged in) has a very different risk profile from Exploration and Production. So on days when XLE fell 1%, the correlation with MLPs was higher than normal, at 76%. MLPs react to sudden moves, but on the days when Energy is not down 1% or more (84% of the time this year) they react to their own economics.

So what does one conclude? The surprise of the past 2-3 years has been that ACA (The Affordable Care Act, or “Obamacare”) has been very good for the health care sector. I doubt many architects of that legislation expected to create such wealth for health care providers. However, the major news story of 2014 is clearly Oil. Small energy sector servicers have been extremely weak, while the economics for many energy infrastructure businesses have remained sound notwithstanding big drops in some of their customers’ stock prices. Friday was such a day. with the Energy sector -6.3% and MLPs -5.3%. There are substantial crosscurrents beneath the simply headline result of the S&P500.


Continental Resources Exploits the Optionality in Its Portfolio

Harold Hamm, CEO of Continental Resources (CLR), has most recently been in the news because of his $995 million divorce settlement, which his wife is appealing. Far more interesting though, was Continental’s recent decision to remove all of its hedges on future oil production. Closing out the short positions in oil futures generated a one-time $433 million gain, while of course also leaving the company exposed to further drops in oil prices. However, CLR also cut back its planned 2015 capex budget from $5.2 billion to $4.6 billion. This highlighted the optionality that E&P companies possess, in that within limits they can decide not to produce oil from certain fields if prices aren’t sufficiently attractive. In those cases, rather than being long oil they have a position that looks more like a long call option on oil. As option traders will readily recognize, a long oil call option combined with a short oil position (through the hedges they had) creates a long put option on oil. In effect, CLR’s ownership of oil producing assets combined with its hedges has acted in part like a put option on oil. Harold Hamm said that they believe oil has to rise in price, and that’s a good enough reason to remove the hedges. But if they’re wrong, they can at least mitigate the situation by producing less. If you’re long options, a volatile market is usually good (it increases the potential value of your position). CLR is making full use of the volatility in oil by trading their effective long put option on oil. Harold Hamm’s divorce reminded me of someone who was just going through his third. Harold probably won’t see the humor in this at present, but this serial divorcer I’m thinking of had names for his three ex-wives: Half, Quarter and Eighth, denoting approximately what he was left with following each event in the unfortunate sequence.


Why Offshore Oil Producers Will Likely Be the First to Cut Output

There has been plenty of concern recently that the drop in oil prices would cause many domestic E&P names in the U.S. to curtail their activities at marginal plays. This in turn would have a knock-on effect on oil servicers and the MLPs that manage and build energy infrastructure needed to exploit America’s shale boom. Several MLPs recently commented that they felt current oil prices wouldn’t have much impact on U.S. production. For example, Enterprise Products’ (EPD) CEO Michael Creel said, “Our analysis shows that most if not all of the core drilling area in key oil plays such as the Eagle Ford, Permian and Bakken are profitable at numbers below where we are today and U.S. drilling is certainly not grinding to a hault.”

In fact, the marginal producer of crude oil looks very much like an offshore producer.

Transocean (RIG) is an industry leader in the ownership and operation of offshore drilling rigs. In their quarterly earnings call this morning, CEO Steve Newman said,

“The market pause we began discussing with you more than a year ago has evolved into a cyclical downturn. Although our customers take a decidedly long-term view in making investment decisions, the approximately 27% decline in oil prices observed over the last three months is likely to increase their challenge to improve short-term returns to their shareholders.

In turn, this may temporarily exacerbate the offshore rig supply and balance that has already resulted in dayrate and utilization pressures and an increase in the inter-contract idle time in stacking of rigs and potentially delay the cynical recovery.”

In addition, their just filed 10Q included the following:

GoodwillSubsequent to September 30, 2014, market conditions have continued to deteriorate, and we identified additional adverse trends, including continued declines of the market value of our stock and that of other industry participants, declines in oil and natural gas prices, the cancellation or suspension of drilling contracts, the permanent retirement of certain drilling units in the industry and increasingly unfavorable changes to actual and anticipated market conditions.  On that basis, in the three months ending December 31, 2014, we expect to reevaluate whether the fair value of our reporting unit has again fallen below its carrying amount, which could result in us recognizing additional, potentially significant, losses on impairment of goodwill.

So while lower oil prices may well hurt providers of services and infrastructure globally, it looks as if the most immediate pain is being felt in areas away from U.S. shale plays.


A Scandal That Should Shock Nobody

I was struck the other day by some of the commentary on Seeking Alpha surrounding American Realty Capital Properties (ARCP). ARCP is a REIT. Their chairman is Nick Schorsch, who is also chairman of American Realty Capital which is built around the origination and distribution of non-traded Real Estate Investment Trusts (REITs). While conventional, publicly traded REITS have their place in an investor’s portfolio, the non-traded variety represent a far more dubious sector.

In February I wrote about a non-traded REIT,  Inland American Realty (not managed by ARCP). Like many others,it’s a great investment for brokers, but far worse for their hapless clients. It includes features such as 15% of your investment as fees up front, additional fees for buying and managing properties, incentive fees and myriad conflicts of interest, in addition to which you can’t sell it because it’s not publicly listed. Foregoing a public listing is sensible if you’d rather not invite the attention of sell-side research analysts to the egregious fees you charge buyers of your product. No public listing means no trading, so no commissions and not much point in writing about it if you work for a sell-side research firm.

This is of course all disclosed, and therefore quite legal. American Realty Capital is the largest manager of non-traded REITs, with a portfolio of $30BN in assets. But the growth of the industry speaks more to the power of high fees to induce some brokers whose clients’ interests lie substantially below their own to push such products. It’s hard to conceive how anybody associated with an investment that starts life pocketing 15% of your money could in good conscience claim to be helping you grow your savings.

So now we turn to the recent news on ARCP, which is that it is being investigated by the SEC for knowingly mis-stating its financials. Two employees have resigned because they apparently concealed the mis-statement. Their bonuses were set to be higher with the higher figures.

The stock has fallen 40% since the disclosure, as the company has announced that 2013 financial statements previously issued could no longer be relied upon. Some investors wonder publicly whether to hold or sell, seeking to balance what they perceive as the good versus what is reported to be the bad in their comments.

And yet, ARCP is headed by someone who has built a business by selling  securities through ethically-challenged, fee-hungry intermediaries with little regard for the reasonableness of the resulting economics for their clients. ARCP is not American Realty Capital (their confusingly similar names initially confused me as well) but if a company’s tone is set at the top,  ARCP is run by someone who clearly cares more about fee generation that the interests of his clients.

It reminds me of Bernie Madoff. Many of his investors believed that his persistently attractive and steady investment returns were derived from the ability of his hedge fund to front-run the orders of its brokerage clients. Harry Markopolos reports that this was so in his terrific book on Madoff’s scam, No One Would ListenAs hedge fund investors, they thought they were the passive beneficiaries of such illegal behavior. They believed they incurred no risk, and probably expected that if the front-running behavior was detected, the authorities would simply punish Bernie Madoff but not his investors. They were perfectly fine investing with someone that they knew to be dishonest, reasoning that the dishonesty was directed at unwitting others and that their crooked investment manager was honest with them. Such tortured logic delivered its own type of just reward when the truth revealed no such profitable front running activity at all, delivering large losses to the gullible.

The analogy of ARCP with Bernie Madoff is not perfect, but the non-traded REIT business is not an area that reflects well on the people who traffic in them.  It’s not a nice business. ARCP investors should look carefully at the people with whom they’re invested.


MLP Seasonals

Seasonal patterns to the returns of most asset classes rarely seem to last beyond their discovery. “Sell in May and Go Away” has been shown to either work or not work depending on precisely when you close the trade out. Rather than the Summer being a bad time for stocks it’s just that September is poor. Whether that’s for some reason or just random is unclear. As so often in statistics, correlation doesn’t mean causality. One month of the year has to be the worst one during which to be invested in stocks. Since 1960 it’s been September. In 2014 September was poor but January was, unusually, worse. There was no January effect this year. September’s poor record could just be random, absent any compelling explanation.

Master Limited Partnerships (MLPs) have a more pronounced seasonal effect, and it’s likely for good reason (i.e. correlation with causation). It turns out that December and January together have generated 36% of the return on the Alerian MLP Index since 1996 (whereas if monthly returns didn’t vary you’d expect only 17%, or 2/12). The reason is probably that retail investors, who tend to predominate among MLP investors, apply long term consideration to their portfolios around year-end. This can be because year-end bonuses alter their net worth and asset allocation, because it’s the end of the tax year or simply because doing the analysis provides a break from all that family time that comes with the holidays.

In any event, we’re heading into a period of time where the seasonals would suggest that, if you’re considering making an MLP investment over the next six months, committing capital in November may well produce a better result than waiting until February. Naturally, there are always the non-seasonal factors to consider and the volatility in energy-related stocks could understandably give anyone pause. The most recent Saudi news that they’ve cut prices for U.S. buyers so as to protect market share looks like a direct aim at North American unconventional production, and is likely to send another wave of worry through related equities.

Midstream MLP companies that have reported earnings in recent days appear sanguine about current oil prices and their effect on their businesses. If you own a pipeline, storage facilities or a gathering and processing network you care most about volumes rather than the value of the product you’re handling. It’ll take some time to see how that plays out in reported profits for the sector. In the meantime, news reports may continue to pressure everything energy related. If the recent pressure on MLPs turns out to be due to misplaced concern that their profits will suffer along with E&P names who have direct commodity price exposure, then returns over the next few months could be good.


As Bad as IBM's Been, Amazon's Been Worse

About a year ago our newsletter compared the valuation of IBM and Amazon (AMZN). At the time IBM had a P/E of 10X (AMZN’s was 166X), was growing Free Cash Flow (versus flat at AMZN) and seemed wholly more attractively priced than AMZN. As we noted then, we owned IBM and not AMZN, where  we think that being a customer is so much better than being an owner.

A year later, IBM has so far been a disappointment. Its most recent quarterly earnings saw continued weak sales, an abandonment of their long-held 2015 forecast of $20 in EPS,  and a payment of $1.5 billion to a firm kind enough to take their loss-making chip manufacturing business off their hands. From November 1, 2013 through today IBM has returned -7% (including dividends), substantially worse than the S&P500’s +13.5% total return over the same period.

It’s hard to compare the P/E they were trading at last year with their current level, because for now management isn’t making a 2015 earnings forecast. However, using consensus estimates of $16.91, it’s trading at less than last year’s 10X multiple that we found attractive. The critics point to the challenge of adapting their business model to cloud-based software as a service and away from their licensing model. So far events seems to agree with them. And yet, the company continues to generate $12-14 billion of free cashflow, some of which buys back stock which helps its per share metrics. We were obviously early with IBM, but are staying the course.

Although it’s hard to believe, owning AMZN for the past year would have been worse than the 20% relative underperformance delivered by IBM. AMZN CEO Jeff Bezos and his penchant for putting growth ahead of profits helped drive AMZN’s most recent quarterly earnings disappointment and is behind their -20% one year return, 33% worse than the S&P500. Bezos has always wanted to deliver profits sometime in the future. It’s why they’re such an exciting company to watch and why I buy all kinds of obscure items without having to set foot in a brick and mortar store. In the last several weeks I have bought beach shoes, a replacement license plate light bulb, batteries, leather luggage tags, a belt and several 1lb bags of shelled Brazil nuts. I love AMZN investors for helping keep the company’s cost of capital low so that they can offer all these products and millions of others.

Some people thought long AMZN/short IBM was a great pairs trade. Well, IBM certainly has been a worse investment than the S&P500, but handily better than AMZN. If you’re not leveraged, waiting for IBM to beat the benchmark as well isn’t that expensive.


The Dilemma of Hedging

Assuming you’re not the type of investor whose mood is synchronized with the daily gyrations of the stock market, October has been an interesting month. Although it’s not over yet so of course anything can happen, to this point October looks like a big, short-lived margin call. Leveraged investors and those who like to hedge their downside have had a torrid time and many must regard their recent activity wondering how so much frenetic portfolio adjusting could have been so harmful.

It will be especially interesting to see how hedge funds finish the month. Industry apologists long ago perfected shifting the goalposts of performance. What was once the Absolute Return industry moved to generating attractive relative returns, later supplanted by uncorrelated returns as each description of the performance objective was found to be at odds with the empirical results. Nowadays sophisticated hedge fund consultants promote downside protection as the raison d’etre of a hedge fund allocation.

So what to make of the way October is shaping up? Through yesterday, the S&P500 was down 1.6% for the month, an innocuous result that scarcely describes the wealth adjustment that was inflicted earlier. MLPs, in which we have more than a passing interest, were at one point down 14% before the V-shaped market move thankfully began its ascent.

Hedge funds, as defined by the HFRX Global Hedge Fund Index, are currently estimated to be down 2.5%. Many hedge funds, particularly those focused on equities,  have done far worse. Stocks may of course spend the rest of the month falling, but assuming they don’t one imagines there will be some uncomfortable conversations as investors contemplate the value destruction that’s possible when hedged strategies test the market timing skills of their practitioners beyond the level of their ability.

It’s a fair question to ask that, in a market environment characterized by a sharp trip down followed by an equally fast return, what exactly should a hedged strategy return? Presumably, if a hedge fund maintains constant exposure, the round trip ought not to be much different than for the long only investor. But it’s looking very much as if the risk management being practiced is of the “dynamic” variety, which is to say highly responsive to market moves, or perhaps less generously, prone to sell low and buy high.

It reminded me a little of the crash of October 1987, whose 27th anniversary of course just passed on Monday. Not nearly as traumatic of course, and spread over a longer period of days, but what both events have in common is the use of hedging strategies that rely on risk reduction in response to falling prices. In 1987 it was called Portfolio Insurance. Its 2014 version has more complexity and variety of implementation, but thematically is another version of taking more risk when prices are rising and less when they’re not. There are other ways to grow your savings.


Bulls Talk While Bears Sell

We’re in one of those periods of time in the market where participants are simply talking past one another. The fundamentally-driven bull case acknowledges that sharply lower oil prices are bad for E&P companies but notes that for the rest of the economy it’s like a tax cut. Power consumption just got cheaper. And yes, growth overseas is slowing, notably in the EU but also in China and Brazil. But the U.S. economy is doing fine. And finally, Ebola is in every conversation but the media hype and fear are magnitudes out of proportion to the actual incidence of infections.

Meanwhile, the sellers don’t engage in the debate on these issues at all, but simply keep selling. Not because they want to, but because they have to. In fact, it’s quite extraordinary that after all the losses and capital destruction that went on during the financial crisis in 2008, that there is still so much money invested on a seeming hair trigger. So many participants evidently  operate under a psychological margin call that induces them to sell when prices fall a certain amount, or indeed an actual one. Investing with leverage is generally not a smart way to grow your savings, but a lot of people obviously still do it in one form or another. Perhaps one of the most bearish items over the near term is that the bearish case is so rarely articulated. Most of what you can read or watch on TV seems to be another fundamentally driven bullish analysis.

Meanwhile, Kinder Morgan (KMI) reported after the close yesterday and reaffirmed their $2 dividend for 2015, 10% annual dividend growth and a backlog of projects up from $17 billion to $17.9 billion (even after dropping $1.1 billion into production, so $2 billion of projects were added). We think at $35 it’s a good investment. We also think Burger King (BKW) apparently a widely-owned hedge fund stock is starting to look attractive as its price is now retreating back towards its level prior to the merger announcement with Tim Horton (THI).

It ought to be a great opportunity for hedge funds to demonstrate their added value as uncorrelated investments that can dampen downside volatility, as opposed to showing that they are in fact over-capitalized. So far this year, the simple 60/40 S&P500 and Dow Jones Corporate Bond combination has returned +4.6% (through Tuesday) compared with the HFRX Global Hedge Fund Index (HFRX) of -1.6%, closing in on an incredible 12th straight year of underperforming the 60/40 alternative.