The Sky High Expenses of MLP Funds
If the arcane tax accounting of the mutual funds and ETFs that invest in Master Limited Partnerships (MLPs) is of no interest to you, let me save you some time and advise you to skip reading.
As the rest of you who have proceeded past the warning probably know, the attractive tax-deferred yields offered by MLPs require the investor to receive K-1s rather than 1099s at tax time. Many investors want to invest in MLPs without K-1s, and consequently funds were launched that provided a solution, of sorts. ’40 Act funds can hold MLPs on behalf of their investors and provide 1099s, but they may have to pay corporate tax on the returns. If the fund is RIC-compliant, in that it owns less than 25% publicly traded partnerships (i.e. MLPs), investors get pass-through tax status. However, if the fund is not RIC-compliant it is structured as a C-corp and subject to corporate taxes. So the result is that the investors in non-RIC compliant funds only receive 65% of the return (i.e. 1 minus the 35% corporate tax rate). The Mainstay Cushing Fund (CSHAX) is an example, but there are others. Unfortunately, $52BN of the $64BN invested in MLP investments via ’40 Act funds are structured as C-corps (Source: Alerian). Ron Rowland wrote about this issue as long ago as 2010.
The tax drag shows up as part of the expense ratio, so CSHAX sports an eye-popping 9.42% expense for the year through 2/27/15, of which 7.49%-7.94% is taxes. Other funds are similar. Remarkably, few investors are aware of the tax drag in the MLP investment funds they own. Not surprisingly, it’s hard to get anywhere close to the benchmark Alerian Index under such circumstances, since such funds solve the K-1 problem by throwing substantial amounts of their investors’ money at it — or more accurately, to the U.S. Treasury.
There is an odd sort of silver lining to this tax drag though; it works in both directions. Just as the fund delivers 65% of the upside, it also delivers 65% of the downside. As MLP investors are painfully aware, prices have been in retreat since last August, and in recent weeks retreat has become rout. Since the tax bill comes from unrealized gains, a reduction in those gains through a drop in market prices reduces the future tax bite commensurately. It results in lower volatility, which is normally a desirable quality for investors although in this case of dubious value; volatility could be further reduced if the corporate tax rate was increased beyond 35%, which is clearly not the type of risk management investors want.
There is an interesting and so far unanswered dilemma that can face such a taxable MLP investment product during an extended market turndown (perhaps such as the one we’re enduring). Just as the Deferred Tax Liability for unrealized gains can fluctuate with market moves, it can in theory become a Deferred Tax Asset (DTA). This can come about when the non-RIC compliant investment fund holds investments that are at a mark-to-market loss, such that rather than creating a future tax burden they represent something similar to a tax-loss carryforward, or a net operating loss. CSHAX among others seems to contemplate holding a DTA where market moves create one, according to its prospectus. This has the effect of increasing the fund’s NAV above what it would be simply based on the securities it holds. However, the accounting can quickly get tricky if investors begin to exit the fund. This is because an exiting C-corp ’40 Act investor that receives an NAV on their shares subsidized by the DTA leaves behind a fund that is now slightly smaller but has the same DTA, meaning the DTA represents a larger share of the remaining investors’ NAV. Continuing redemptions could propel this process to where benefiting from the DTA was no longer plausible, at which point the DTA could be subject to a “valuation allowance” (the language in the CSHAX prospectus). At that point, the fund might be in the unenviable position of providing investors still only 65% of the market upside combined with 100% of the downside, a set of circumstances likely to induce further redemptions, exacerbating the situation. As the funds themselves point out, the appropriate tax treatment is not clear. It’s an untested area.
This is theoretical. We haven’t actually seen this play out yet, but it’s a useful scenario to consider for such investors.
What should you do? If you own an MLP mutual fund or ETF, look carefully at the expense ratio. Funds set up as C-corps (i.e. not RIC-compliant) are an expensive way to access the asset class, and are unlikely to offer satisfactory returns. The best course is to sell and consider replacing with a RIC-compliant fund. At least the harm of the original investment error has been mitigated by the recent sell-off, since the tax treatment has cushioned the losses you’ve incurred. And if the Deferred Tax Liability of your MLP investment fund is heading in the direction of becoming a Deferred Tax Asset, with its uncertain ultimate realization to the fund, consider a more speedy exit.
How ironic that investors seeking to avoid the tax complexity of K-1s are nonetheless facing tax complexity of a different sort.
We also run a RIC-compliant mutual fund, and you can learn more about it here.
Nothing in this blog should be construed as offering tax advice. Investors should seek their own tax adviser or tax attorney. This document is not an offer to purchase or sell, nor a solicitation of an offer to purchase or sell an interest in a Fund.
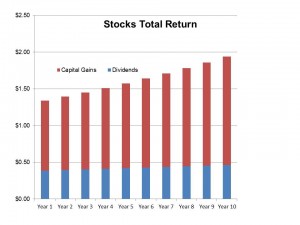 ed while stock dividends grow. The S&P500 currently yields around 2%. Historically, dividends have grown at around 5% annually. So if you invested $100 in stocks today you’d receive a $2 dividend after the first year but if past dividend growth of 5% annually continued, in ten years your $2 dividend would have grown to $3.26. Put another way, if dividend yields are still 2% in ten years time, your $100 will have grown to $162.89 (that’s the price at which a $3.26 dividend yields 2%). Since returns on stocks come from dividends plus their growth, a 2% dividend plus 5% growth equals a 7% return. Naturally, the two imponderables are (1) will dividends grow at 5%, and (2) will stocks yield 2% in 10 years (or put another way, where will stocks be?). These are the not unreasonable questions of the bond investor as he contemplates a larger holding of risky stocks in place of bonds with their confiscatory interest rates.
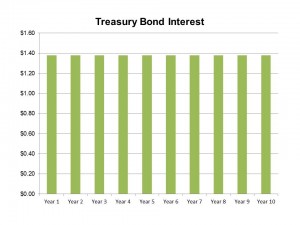 xes, around $0.38. This assumes the Federal dividend tax rate and the ObamaCare surcharge but excludes state taxes.
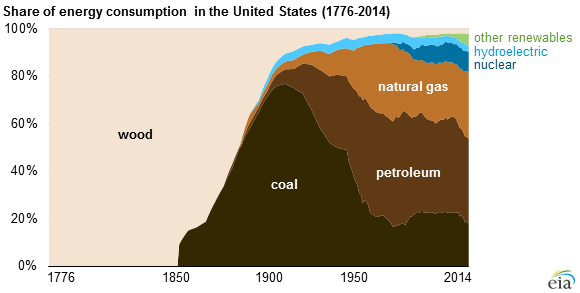
 historical context. Our use of natural gas has been increasing but our use of petroleum has if anything decreased in the past several years. However, the big story here is our decreasing reliance on imports. The
 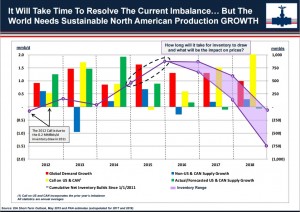 profitable to hold crude oil for future delivery if the storage costs can be covered, and in some cases oil tankers act as temporary floating storage.
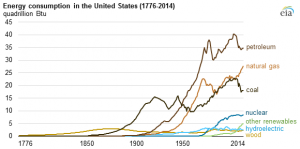
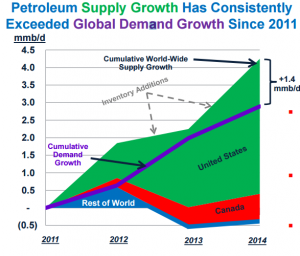 wn. Moreover, North America has met more than 100% of this increase in global demand, since output in the rest of the world has net fallen somewhat. This simple graphic illustrates as well as anything that the Shale Revolution in the U.S. has not just been a North American story but has impacted the global oil market, most obviously through the drop in prices since last Summer.