The Four Horsemen of the Apocalypse, as far as long term investment returns are concerned, are excessive fees, leverage, taxes and over-trading. Any one of these can be relied upon to eat into the results sought by the long term investor. Add an excess of all four and you wind up with a toxic brew that impedes reaching your investment goals and can seriously impair your capital. We recently came across a security which incorporates all of them, and it provides a startling reminder of just how relentlessly capital can be destroyed when these four villains are able to work in concert together. As you’ll see, they have wrought an investment disaster of biblical proportions.
The Cushing MLP Total Return Fund (SRV) stands as a testament to much that is wrong with some of the investment products on offer. Although I often write about Master Limited Partnerships (MLPs), this fund’s focus on our favorite asset class is incidental to the story. The lessons herein apply to any investment.
To begin with, SRV is a closed end fund (CEF). This is an intriguing backwater in which we once dabbled before concluding that there wasn’t enough liquidity to justify the time. CEFs are like mutual funds except that their share count is fixed; consequently, price and Net Asset Value (NAV) can and invariably do deviate from one another. One of the enduring mysteries of the CEF business is why anybody buys Initial Public Offerings (IPOs). With admittedly unfortunate timing, on August 27, 2007 Morgan Stanley led an underwriting of 8.75 million shares of SRV at $20, of which $0.94 went in underwriting fees. So investors were immediately down 4.7% on their investment, and could have chosen to avoid the excitement of the IPO and buy SRV the following day (presumably 4.7% cheaper if it traded at NAV). After all, this was not Google, but simply a fund holding other publicly listed securities. But the machine worked, as it usually does, and investors were duly parted from a modest portion of their funds in exchange for misplaced hope.
SRV is organized as a corporation rather than as a Registered Investment Company (“RIC”), and I’ll spare readers detail of the consequences other than to note that SRV expected to pay 35% of its returns to the U.S. Treasury as corporate income tax (since it is a corporation). SRV planned to use up to 40% leverage, relying on the leverage-magnified returns to cover most of the tax. This only really works when a security such as SRV only goes up, but to point out this possible flaw seems small-minded in the face of such boldness.
The 2008 financial crisis was just months away. The demise of Bear Stearns, collapse of Lehman and government bailout of AIG led many to pray for investment relief. They were dark days indeed. For comparison, we are going to consider SRV’s returns against two other indices; the Alerian Total Return Index (AMZX), and a customized index reflecting SRV’s structure, which uses AMZX with 40% leverage, a 35% tax rate, and 5% expenses (all assumptions lifted from the 2007 prospectus). We’ll call this the Alerian Stupid (AMZS) in honor of the hapless souls who aspired to its results.
In spite of the storm clouds in 2007, the AMZX returned 3.3% for the remainder of the year following SRV’s IPO, and even the AMZS was +1.7%. However, SRV left its initial investors smarting with a -14.4% reduction in the value of their investment. Worse was to come, and markets plunged in 2008 with AMZX delivering -36.9%. AMZS was only slightly worse, at -37.4%. While leverage amplified the losses, the tax burden is assumed to work as a benefit in a down market rather like a net operating loss (those interested in more detail can find it on our blog under The Sky High Expenses of MLP Funds). SRV quickly parted company with these indices, and turned in an eye-popping -69.3%. CEF experts may note that many closed end funds moved to a substantial discount to NAV in 2008 which exacerbated the fall in price many suffered. However, Morningstar shows that SRV remained at a premium to NAV f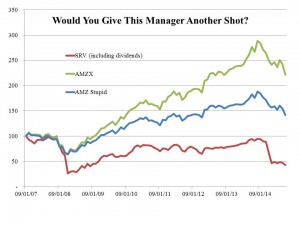 or most of the year and indeed throughout its life until the end of last year. CEFs usually trade at a discount to NAV and many individual investors trade them seeking to exploit this fact. The consistent premium at which SRV has traded reflects optimism by investors tragically not repaid by results.
In 2009 markets roared back, and SRV delivered an astonishing +118.6%, well ahead of AMZX at +76.4% and AMZS at +60.2% (taxes really hurt that year). Emboldened by this performance, SRV investors drove the premium to NAV up during the year and by early 2010 it reached 40%, an apogee of irrational exuberance that causes wistful nostalgia in today’s investors. At this point Cushing, aided by a different set of underwriters, sensibly exploited the premium by announcing a secondary offering of 6 million shares priced at $10, half the level of the IPO. A 2011 supplement to the 2010 prospectus also revealed portfolio turnover of 301% in 2010 and 526% in 2009 (high turnover is our fourth horseman). Holders of SRV may have thought they were investors, whereas the data suggests a manager frantically trading with little evidence of any thoughtful strategy.
The years since have not been kind to the faithful (and their composition has changed via trading in the secondary market). Inconveniently, SRV has not risen consistently in price so as to most effectively avail itself of the benefits of leverage. The annual return from inception to June 2015 is -10.2%, compared with +4.6% for AMZS and 10.7% for AMZX. It shows the enormous difference between selecting the right asset class (since MLPs have done very well) and the wrong instrument.
The result is that today SRV languishes at $3.45, a country mile from its IPO price and at a discount of over 20% to its NAV. In 2015 MLPs have of course been weak, but the discount suggests that the level of enthusiasm for the stewardship of this fund has finally conceded to the reality of truly awful performance. The financial equivalent of Conquest, War, Famine and Death symbolized by the Four Horsemen have surely been visited upon the holders of this fund. Defenders might find fault with picking on an investment launched back in 2007, at a time when perhaps underwriting standards were lower. They might care to consider the Cushing Royalty & Income Fund (SRF), launched in 2012 and having lost 77% for investors since then for a -34% annual return. Obviously they have found a formula that works, after a fashion.
I have heard reports that a new portfolio strategy has been put in place for SRV and that prospects are better than in a long while for those investors willing to cast the past aside. There will probably be some – for although underwriters deserve blame for bringing poor products to market, self-destructive behavior by investors is also necessary to produce stories such as this one. The right thing for Cushing to do is liquidate the portfolio and buy back shares, thus ending a sorry chapter for an MLP manager that has produced ample wealth for its founders if not always for its investors. At least the remaining faithful would profit from the closing of the NAV discount. However, closed end funds represent permanent capital, in that they generate fees in perpetuity for the manager, and winding the fund up is never going to be as appealing to a commercially-driven operator as trying again with a new set of investors.
Even with the benefit of hindsight, it’s hard to fathom just how the underwriters and manager of SRV ever expected to generate acceptable returns. The tax drag, leverage, fees and subsequent turnover represented a formidable headwind, as shown by the difference between AMZX and our customized index, AMZS. Although SRV appeared just prior to a tumultuous time, overall asset class returns during its life have been good; better, perhaps, than those involved in its creation might have hoped in 2007. It was a structurally flawed security, and its existence reflects poorly on all the firms who have been associated with it. I recently chatted with a friend who was considering entering investment management but worried that he did not possess a sustainable investing edge. His caution was reasonable given his desire to offer a value-added service. However, as I pointed out to him, in some places the bar is set pretty low.
 .
.
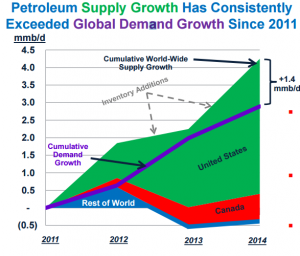 conspiracy theories to speculate. What follows is an insight drawn from production and price data.