Equity Underwriting for Dummies; Kinder's Blunder
If a banker approaches the CEO of a Master Limited Partnership (MLP) with an offer to help, the CEO should run (not walk) in the other direction. The latest victim is the management of Columbia Pipeline Group Inc (CPGX). A month ago management had indicated that they’d be tapping the markets for equity via their MLP, Columbia Pipeline Partners (CPPL). This is how it’s meant to work, with CPGX as the General Partner (GP) directing the MLP it controls to raise capital and invest it, sending half the free cashflow up to CPGX via the Incentive Distribution Rights (IDRs). They currently have $8BN in projects, notwithstanding the market’s current skepticism about MLP growth prospects. To reuse the hedge fund analogy, CPGX is the hedge fund manager (i.e. earning a share of the profits and providing management) and CPPL is the hedge fund (i.e. doing as directed by the GP).
But a month later, no doubt advised by its self-serving equity underwriters Goldman Sachs and Credit Suisse, CPGX instead issued equity, thereby raising capital at the GP level rather than the MLP level. “Hedge fund manager dilutes itself by issuing equity” is not a headline as commonly viewed as “Investors pile into hedge fund”. In this case, CPGX acted as the former when they ought to know better.
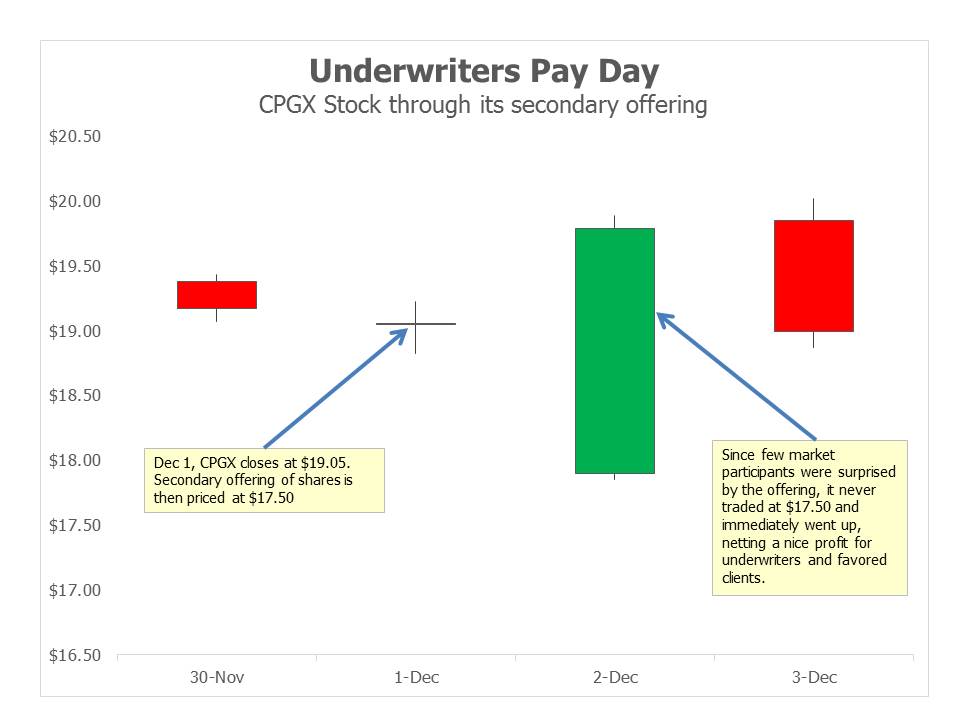
Goldman and Credit Suisse did what they do well, which is to ensure that CPGX stock traded down until the moment of pricing, ensuring a profit for the underwriters and favored clients at the expense of existing CPGX investors. The offering was priced at $17.50 on December 1, an 8% discount to the prior day’s close and a level at which it had never previously traded. Due to strong demand the offering was upsized from 51M shares to 71.5 and the stock quickly traded up while the underwriters exercised their option to buy an additional 10.725 million shares (upsized from 7.65 million shares) on top of the 71 million originally sold. Clearly, the market was not surprised; the circumstantial evidence points strongly to the underwriters alerting clients to the offering in the preceding days and thereby softening the market. This is because only the underwriters had both the advance knowledge of the offering and the incentive to see the stock trade off in the days prior to pricing. Perhaps the equity capital markets staff use hand signals to alert their colleagues on the other side of the Chinese wall about what’s coming, so as to avoid leaving any evidence of their communication. In any event, the result was a success for all involved, except regrettably for CPGX investors whose shares were valued as high as $22 just a month earlier. Make that another win for Wall Street bankers. My book Wall Street Potholes will soon need a Volume 2. You can never be too cynical.
I reviewed several corporate finance blunders a few weeks ago in Investment Bankers Are Not Helping MLPs. Kinder Morgan (KMI) was part of that with their poorly handled offer of mandatory convertible securities. But on reflection, they may have committed the biggest blunder of all last year with their restructuring in August 2014. It looked clever at the time, and to our subsequent regret we liked it (see Valuing Kinder Morgan in Its new Structure). By acquiring their MLPs, Kinder Morgan Partners (KMP) and El Paso (EP), they were able to revalue their assets to current market prices and thereby create a higher tax-deductible depreciation charge that fueled a faster growth rate in their dividend. It was pretty slick.
But in hindsight, the reasons for the restructuring were a warning. At their size, they were unable to finance enough accretive projects to continue growing their dividend at its previous rate. The hedge fund analogy is useful here, because almost every hedge fund eventually gets too big. KMI, the GP of two MLPs and in effect the hedge fund manager, should have accepted that slower growth was inevitable and been satisfied with 1) a recurring 6.8% distribution yield growing modestly at KMP, effectively its hedge fund, or 2) consolidating and financing growth from retained earnings like all the other large C-corps. Instead, they adopted a structure yielding 5% with 10% projected growth fueled by the higher depreciation charge but reliant on equity markets to provide capital to finance part of their growth. Fifteen months and a more than 50% drop later, they now have a 12% yielding security with 6-10% 2016 growth and questions swirl about their ability to finance accretive projects given that their cost of equity has doubled. Moreover, it’s no longer an MLP, and the pool of potential investors, while large, looks beyond distributable cashflow and distribution yield and to other metrics such as Enterprise Value/EBITDA, against which it didn’t look quite so cheap at the time.
It’s no doubt a better investment today than it was in August 2014, and it remains a modest holding of ours although substantially less than in the past as we’ve switched into more attractive names. But the MLP-GP structure, with its close comparison to the hedge fund-hedge fund manager, is how Rich Kinder became a billionaire. Incentive distribution rights, the mechanism by which KMI earned roughly half the free cashflow from KMP and (more recently) EP, are similar to a hedge fund manager’s 20% incentive fee. Rich Kinder was smart enough to figure that out, but not smart enough to recognize when it’s time to stop accessing the secondary market for financing. The largest MLP, Enterprise Products (EPD), funds its growth from internally generated cashflow rather than issuing equity and has 1.3x coverage on its distribution. Perhaps that’s why EPD unitholders have fared better.
Size is the enemy of performance in hedge funds and, at times, in MLPs. Shame on Rich Kinder for not realizing it and instead letting the investment bankers talk him into the value destroying structure. He bet faster growth would drive down the yield on KMI, making it an acquisition currency of less leveraged businesses in a downturn, which would in turn reduce KMI’s leverage. The strategy has backfired. KMI no longer gets credit for the dividend, which leads to questions about its sustainability. While it’s covered by cashflow and they don’t need to issue new equity until 2H16 since doing the mandatory convertible, if KMI still yields >10% in late 2016 it’ll make more sense for them to cut the dividend and thereby reduce or eliminate their need for additional equity. KMI has made the mistake of many hedge fund managers and investors, thinking they can grow indefinitely. Although some commentators are worried about pressure on pipeline tariffs from stressed E&P companies, there’s a stronger case for tariff increases since the cost of equity for pipeline owners (i.e. MLPs) has risen.
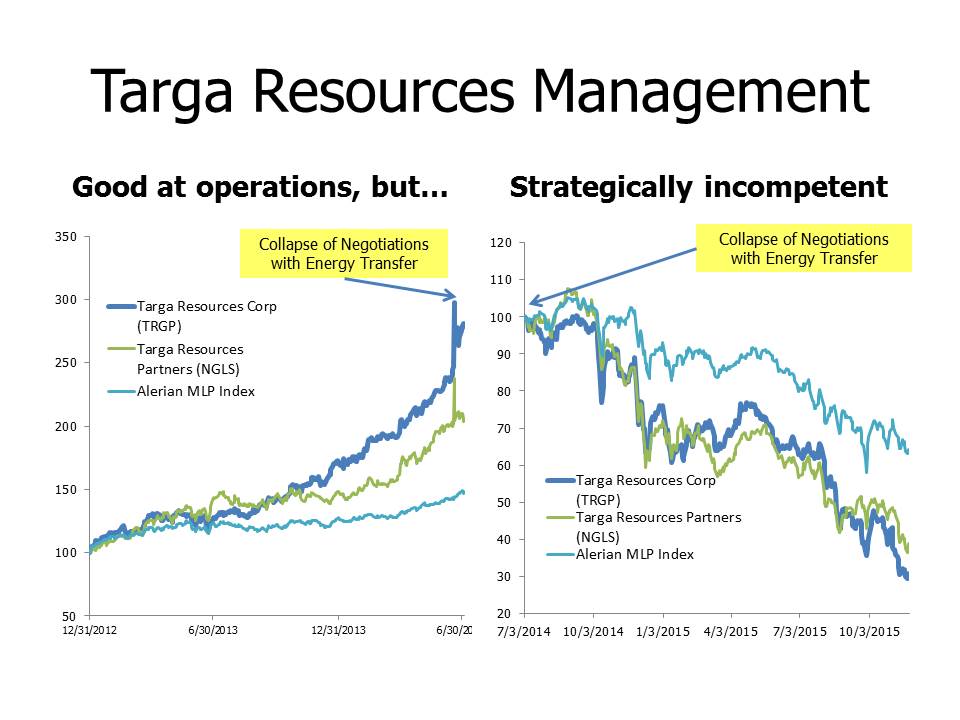
Hedge fund managers don’t buy their hedge funds, and MLP GPs shouldn’t buy their MLPs. Management at Targa Resources (TRGP) should take note (see Targa Resources Needs an Activist).
We are invested in CPGX, EPD, KMI and TRGP.