Pity the Equity Analyst

This week I felt a pang of pity for a sell-side research analyst. Not an obviously sympathetic constituency, you might well retort. There are many other categories of employment more deserving of such consideration – indeed, probably too numerous to list here. But I did, and here’s why.

This particular analyst (he’ll remain nameless because I don’t wish to embarrass him) has been a relentless cheerleader for Master Limited Partnerships and increasingly so as their prices have plummeted. That’s already sufficient reason for me to express my sympathy. You may have spotted that we have something in common.

Explaining why MLPs keep falling in willful defiance of what an evident minority asserts is compelling valuation can be tiring, and some become weary of it before others.

Plains All America (PAA) is the midstream infrastructure MLP most clearly linked with falling crude oil prices. Like most MLPs they rely on issuing equity to fund their growth plans, and PAA has been growing in recent years to accommodate increased domestic oil production. Acknowledging the unwillingness of investors to fund growth as well as the reality of falling domestic production, PAA recently cut their 2016 growth plans from $2.1BN to $1.5BN.

On Tuesday, January 12th PAA announced they had raised $1.5BN through a convertible preferred security yielding 8%, some 5% less than the yield on their equity. It was privately placed with several institutions, and as a result PAA has no need to issue equity through 2017. Moreover, it was pretty cheap capital since it is convertible to equity at the holder’s option in two years or at PAA’s option (under certain circumstances) in three. In any event, it is junior to all their other liabilities and is in reality equity (which is how PAA regards it). Private equity investors, not normally accused of superficial research, saw fit to invest $1.5BN in equity in an MLP.

So you have a piece of news that is unambiguously positive, in that PAA raised capital on surprisingly inexpensive terms from informed investors and is no longer a seller of its own equity. Now let’s return to our sell-side analyst.PAA Chart for Jan 17 2016

Research reports include a history of the Certifying Analyst’s prior recommendations on the stock. PAA had been a Buy (called an “Overweight”) since October 2011, at which time it was trading at $30 with a price target of $34.50. Through 19 subsequent revisions the Buy recommendation remained, with the price target regularly adjusted so as to be always 10-20% higher than the current price. In October 2014, with PAA at $58 the peak price target of $66 was recorded.

To quote a friend of mine, from that point down was a long way and on Monday, January 11th just prior to PAA’s announcement, its stock closed at $20.36, 70% below its target of fifteen months earlier. Now put the numbers aside, and consider what the past fifteen months have been like for the sell-side analyst. He has doggedly articulated the bullish case through the most relentless selling. He has noted the fee-based nature of PAA’s cashflows, the highly regarded management and their history of solid execution. His analysis is widely read and his day must have increasingly been one of verbal jousting with his firm’s salespeople as they relayed client dissatisfaction and most likely anger. When losing money on an investment it’s some small solace to blame one of the unapologetic cheerleaders.

Sell-side analysts can be highly paid (although one suspects that MLP analysts face a supply/demand imbalance similar to crude oil). But even highly paid people have a breaking point, and this week our analyst reached his. We know this because on Wednesday, January 13th following PAA’s $1.5BN capital raise the sequence of 20 consecutive Buy recommendations was finally broken with a switch to Neutral. The unspoken message was clear:

I am tired of this. Let me hide in the obscurity of the current market price. I no longer wish to explain what cannot be explained to my colleagues or my clients. I am out.

This is how it feels to sell after intending to never sell. If you’re planning to panic, it’s best done immediately.

How do I infer this from a research report that doesn’t make such a confession? Because of what it does say. Acknowledging that the capital raise was undoubtedly good, our analyst nonetheless downgrades the stock because of lack of visibility around crude oil. Of course the crude oil price remains both highly visible and unpleasant. Moreover, because all good research must include a Mathematical basis by which the current price target is derived, the discount rate on PAA’s future cashflows was arbitrarily jacked up to 11% and a zero growth rate was assumed on their terminal value beyond ten years. This last point will seem obscure but is important – PAA is highly unlikely to forego forever price increases on its assets in the future. Or put another way, how do you change the spreadsheet inputs so as to get the desired output, which is an innocuous price target close to the current market so I don’t have to talk about PAA anymore.

Also of note was that our analyst didn’t rely on any of the familiar criticisms of industry bears, such as that the MLP model is irretrievably broken, that contracts will suffer widespread renegotiation or abrogation in bankruptcy court, or that MLPs are a Ponzi scheme. This is because he for one can’t find much evidence of that or he would most assuredly have relied on such to justify his about-face following a 70% drop. He’s just had enough.

Meanwhile, on Wednesday PAA yielded 14% on an unchanged dividend newly declared. Its General Partner, Plains GP Holdings (PAGP) which we own yielded 11.5%. The analyst isn’t even forecasting a dividend cut.

The point of this story is not to argue that PAA or PAGP are cheap, but to show why MLPs remain so weak. The people involved are reaching the limits of their tolerance for remaining bullish when the P&L’s of countless MLP holders say very loudly that any MLP proponent must have an IQ lower than room temperature. The facts as reflected in market prices relentlessly say so. One guy’s had enough, and I feel his pain but shan’t follow his lead.


We’re All Crude Oil Traders Now

Pioneer Natural Resources (PXD) was dubbed “The MotherFracker” by David Einhorn last May at the Ira Sohn Value Investing Conference. Einhorn is bearish on PXD and other E&P companies that use hydraulic fracturing to release crude oil from shale formations because he calculates that after properly accounting for their capital investment they don’t grow their reserves or generate free cash flow. We have no position in PXD and no view on Einhorn’s bearish call. PXD has lost roughly half its value from its high is the Summer of 2014 and has also fallen sharply since Einhorn’s presentation last May. Like the Alerian Index, PXD has followed crude oil lower.

MotherFracker

The other day an investor presentation from PXD caught our attention, in part because PXD executed a $1.4BN secondary offering. We never like it when a company issues new equity following a substantial fall, and I doubt PXD investors were happy about it either. But it shows there is money available to domestic E&P companies in spite of plummeting crude oil.

Part of the reason probably relates to the continued operating efficiencies being squeezed out by companies such as PXD. As the charts from their December presentation show, costs have been falling 18-25% over the past couple of years; time to drill a well has fallen 40%. As a result, they increased production by 12% last year.

Whether or not this is good for the oil market, it can’t be bad for the energy infrastructure companies that gather, process and transport their output. It highlights the resilience of the domestic E&P industry to the collapse in crude.PXD Slide1 for Jan 10 2016 Blog

Not every E&P company looks like Pioneer though, and crude production is falling in North America as U.S. output expected to be lower this year versus 2015 with both the Bakken in North Dakota and Eagle Ford in south Texas contributing to the drop. Canadian producers in Alberta have long struggled with limited options to get their output to market. This is why the Keystone pipeline is such a big deal for them. The limited transport options mean Alberta crude trades at a substantial discount to the benchmarks, and it recently dropped below $20 a barrel which has caused some wells to be shut in rather than fail to cover even their operating costs. Reports indicate a reduction of more than 35,000 barrels a day of output from two producers.

PXD Slide 2 for Jan 10 2016 Blog

At this point I imagine the discussions over crude oil strategy within the Saudi government must be heated to say the least. The stubborn refusal of large swathes of non-OPEC production to collapse is opening an enormous hole in Saudi Arabia’s budget as well as many other countries. If the Saudis have a strategy, it requires substantial optimism to find examples of its eventual success. What they need is a face-saving way to shift gears; to declare victory and leave the battlefield. They produced 10 million barrels a day in November and around 25% of this is consumed domestically. Assuming they receive $30 a barrel (their grades of crude are typically subject to a few dollar discount) and it costs them $5 a barrel to produce, they clear $188 million a day on the 7.5 million barrels they export. If they claimed that their strategy had been a success and were therefore announcing a one third reduction in exports, the loss of 2.5 million barrels of supply would cause the global oil market quite a jolt. A $12.50 jump in crude would see Saudi oil revenues unchanged. It’s a thought experiment, but with crude this low some odd things become possible.


The 2015 MLP Crash; Why and What’s Next

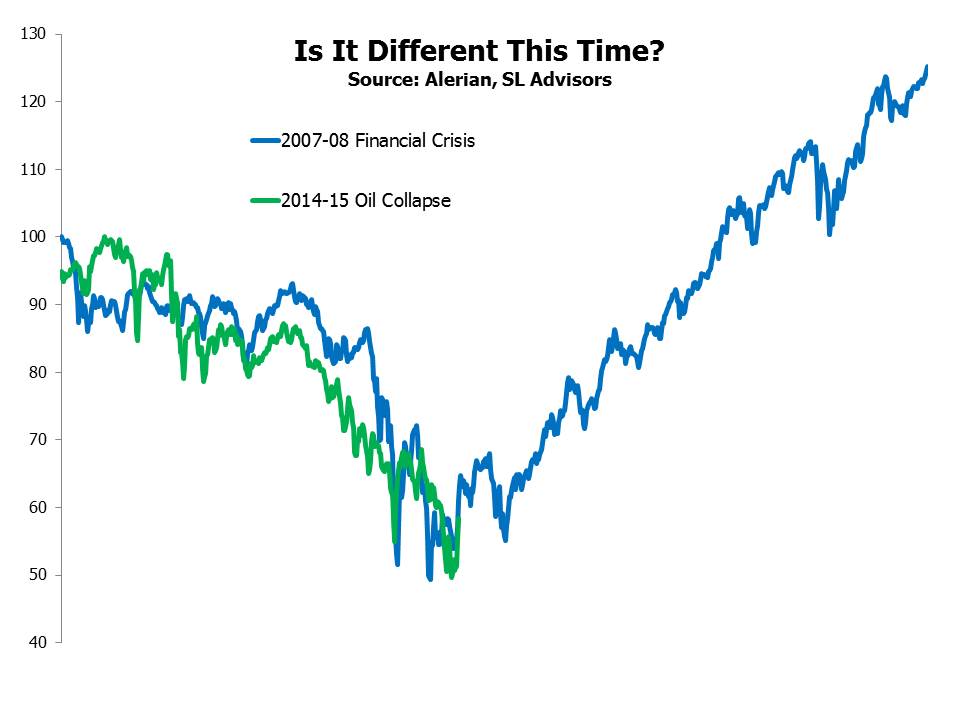
The 32.6% collapse in MLPs was in many ways worse than the 2008 financial crisis. Although not as bad as 2008 when MLPs lost 36.9%, almost every asset class was down that year so there was little unique about MLP performance. In 2015 MLPs endured their own, private performance disaster. The Energy sector was in the background singing a similar tune, but midstream energy infrastructure with its reliably boring toll model behaved like a group of highly-leveraged, high-cost oil drilling businesses, sucking investor positions seemingly into a black hole. Like most MLP investors, we didn’t see it coming. A forest from the trees problem due to being too close. We’re going to offer our perspective on how we got here and what it means for future returns.

How We Got Here

First, a little bit of history. The Master Limited Partnership (MLP) legal structure was enshrined in the 1986 Tax Reform Act signed by President Reagan. Provisions to this law passed by Congress in 1987 limited the use of the MLP structure to natural resource activities. Through subsequent IRS rulings this has evolved to mean anything to do with oil, natural gas, natural gas liquids and coal all along the value chain from extraction to distribution.

The exemption from corporate income tax represents the main and significant advantage of the MLP for equity owners. The familiar “double taxation” of corporate profits via corporate income tax followed by dividends or capital gains tax to the equity holder is avoided with MLPs, since they are “pass-through” vehicles. Their profits are only taxed once, at the equity holder’s level. Because more of the profits from an asset go to the owner, MLPs are a good legal structure within which to hold eligible assets. However, because the MLP itself doesn’t pay tax, the tax code ensures that the owners of the MLP most assuredly do.

The structure is most suitable for U.S. High Net Worth (HNW) investors. MLP tax reporting, as with limited partnerships in general, uses a K-1 form rather than the simpler 1099. Few people who file their own tax returns without the help of an accountant will tolerate this. Many accountants guide their clients away from K-1s although in my experience it’s because they find them tiresome and disregard the economic benefits to their clients.

Most of the money invested in U.S. public equities that might consider MLP equity securities isn’t subject to U.S. taxes, either because it’s tax-exempt (such as pensions, endowments and foundations) or because it’s non-U.S. (sometimes subject to dividend taxes; specific tax treatment isn’t important for our purposes). U.S. tax-exempt investors who choose to hold MLPs can be liable for UBIT (Unincorporated Business Income Tax) which they usually reject because they don’t wish to file a tax return. Non-U.S. investors can be subject to Effectively Connected Income Tax (ECI), which can reach Draconian levels and effectively eliminates their MLP appetite. Taxable corporations (such as insurance companies) can hold MLPs so the investor base isn’t limited to U.S. HNW investors. However, expanding the universe of MLP investors beyond its traditional base is not easy, and this remains an important consideration as we learned in 2015.

My first involvement in MLPs was back in 2005, when at JPMorgan we seeded Alerian Capital Management’s offshore hedge fund. Gabriel “Gabe” Hammond, Alerian’s founder, launched the Alerian Index with his partner Kenny Feng (now Alerian’s CEO). Because the K-1 tax reporting was unpalatable to millions of smaller U.S. retail investors much effort was expended with tax accountants in search of the holy grail, which was a tax-efficient way to allow MLP investors to receive a 1099. Solving this problem would open up an entirely new investor class to MLPs. The payoff was potentially huge. Many different structures and solutions were considered. It just wasn’t possible.

MLP Sources and Use for Jan 3 2016 Blog

However, the absence of a tax-efficient way to give MLP investors 1099s didn’t remain a hurdle for long. Within a few years mutual funds and exchange traded funds appeared which were structured as C-corp ’40 Act funds[1].  They invested in MLPs, delivered 1099s to their investors and paid 35% corporate income tax on the returns. There was no tax-efficient way to avoid the K-1, so it was done in a decidedly tax-inefficient way. To this day, most of the mutual funds and ETFs that focus on MLPs are taxed as corporations, although a few are highly tax efficient RIC-compliant structure such as ours that limit their MLP investments to 25% of the fund. Investors are amazingly oblivious to this, in part because it doesn’t reduce the stated yield but rather comes out of the fund’s Net Asset Value. Although the taxes show up in the form of eye-popping expense ratios of as much as 9%, few retail investors or their financial advisors are aware of this. Even worse, those that do have knowledge of this substantial burden operate under the belief that the tax component is somehow not real. Maybe an expense ratio this high looks like a mistake. Who could possibly design such a thing? These funds carefully avoid stating that achieving the return on the Alerian Index is their objective, because it is of course unattainable and their historic returns show this. The sequential thought process through 2013 was (1) MLPs have done well (2) I don’t want K-1s (3) Here’s a vehicle that gives me MLPs without K-1s. Fund inflows boomed.

Many things are clear in hindsight. One of them is that much of the new money entering the MLP sector via very tax-inefficient funds didn’t possess the same understanding of what they were buying as the HNW investor. They hadn’t examined underlying holdings or thought much about future prospects. Recent positive returns were their investment thesis. Consequently, just as rising prices drew them in, falling prices have seen them flee.

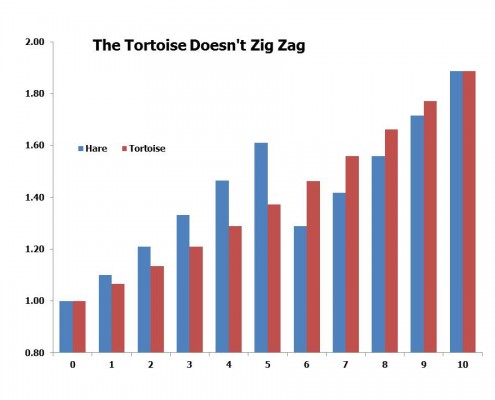
The HNW investor was attracted by stable distributions that were largely tax-deferred (another benefit of investing directly in MLPs) with modest growth. Such investors don’t trade their positions, because to do so would undo the tax deferral benefits. As a result, MLPs enjoy far more stable ownership than most public companies, just the sort of long term outlook many commentators despair is absent from today’s capital markets. Midstream businesses are steady, fee-generating sources of income and they attracted appropriate long-term investors not looking for excitement or high growth. As long as MLPs paid their distributions things were fine.

Dividends are an inefficient way for corporations to return money to shareholders because they create a quarterly tax liability, as well as being taxed twice (once via corporate tax and a second time to the investor). Stock buybacks return capital more efficiently because an investor can always manufacture a 3% dividend by selling 3% of her stock while retaining control of the timing. Nonetheless, reliable dividends are valued. MLP distributions are generally not taxable when they’re paid and so their high payout model doesn’t suffer the same tax inefficiency. The MLP model of distributing its free cashflow relies on external financing (i.e. issuing debt and equity) to fund growth. The average corporation pays out a third of its profits and generally uses internally generated cash to fund growth. The MLP model of higher payouts and greater reliance on external funding sources is not inherently bad. Some feel it imposes extra financial discipline on management through making an explicit connection between capital and its intended use. Indeed, the Miller-Modigliani theory holds that investors should be indifferent to how a company sources its capital (debt, equity or reinvested profits); they should only care about how it’s invested. However, count Miller-Modigliani adherents among those MLP investors who were run over in 2015. The HNW investors who are the predominant financiers of MLPs like the high payout MLP model, so it has prevailed.

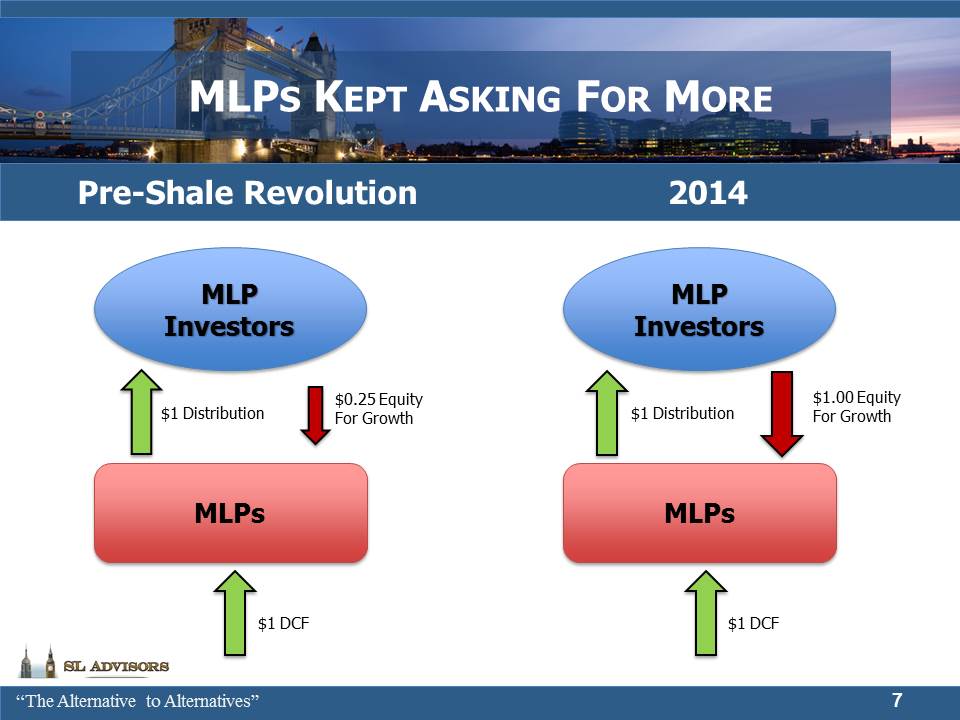
For many years, MLPs generated $1 of DCF, paid $1 of distributions (what MLPs call dividends) and tapped capital markets for $0.25-$0.50 to finance their growth plans. The shale revolution has challenged this model.

The Shale Revolution

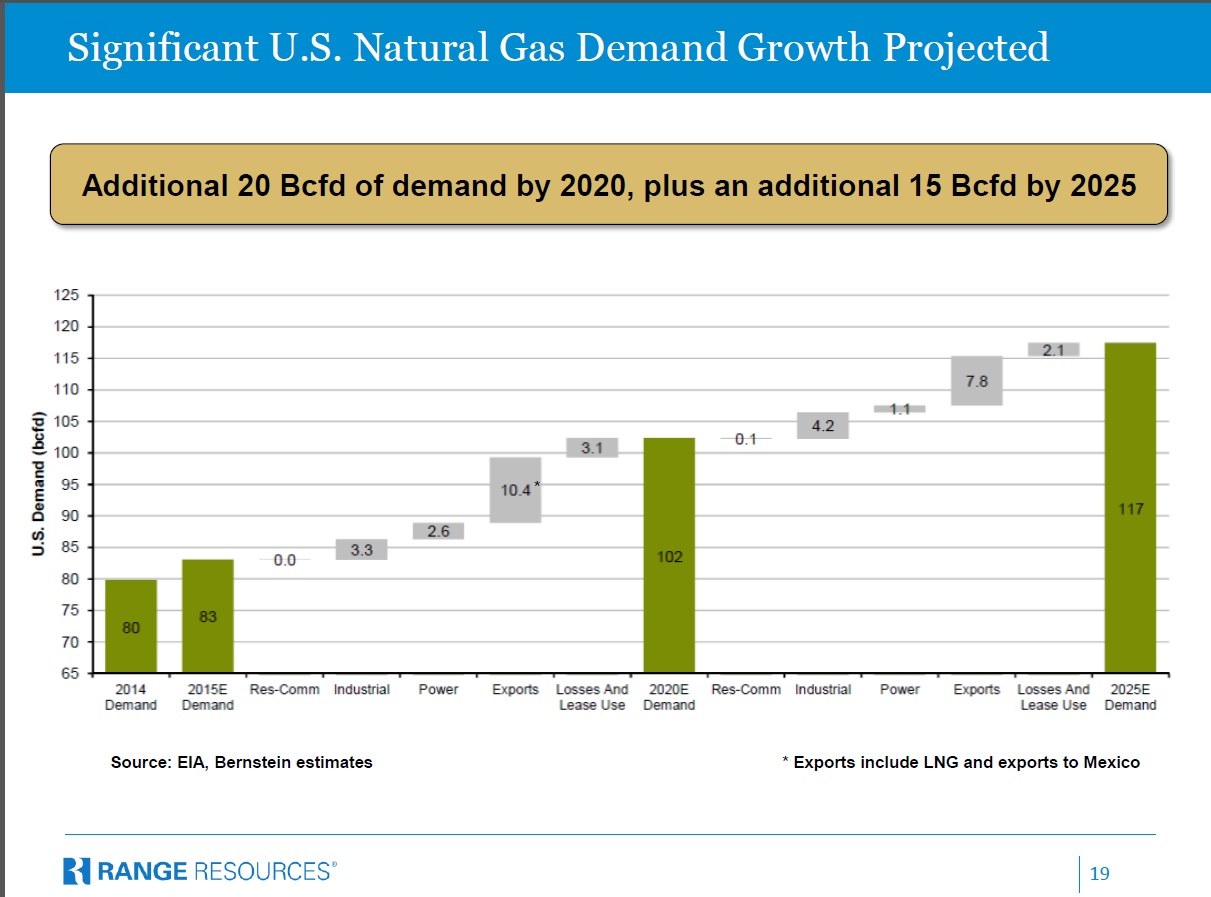
The development of horizontal drilling and hydraulic fracturing unlocked enormous supplies of crude oil, NGLs and natural gas in parts of the U.S. that weren’t established sources of hydrocarbons. Increased output from regions not previously supported with infrastructure added an important growth element to the MLP story. In 2014 the Interstate Natural Gas Association of America estimated that $640BN of new investment in energy infrastructure will be required over the next twenty years, as this table shows.

INGAA Infrastructure Estimates Blog Jan 3 2016

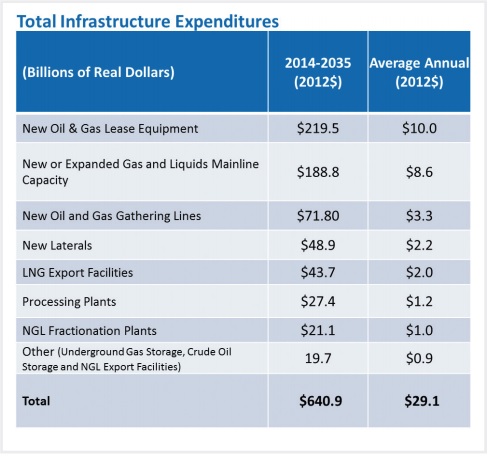
The high payout MLP model whereby most cashflow is returned to investors via distributions meant much of the new capital to fund this growth would need to be externally financed.

KMI Slide for Blog Jan 3 2016

Tapping pools of investor capital beyond the K-1 tolerant, taxable U.S. HNW faces formidable barriers as noted above. The most important new source was from smaller retail investors whose insistence on receiving the simpler 1099 tax reporting form was accommodated via the growing number of 40 Act funds that held MLPs. Falling crude oil challenged the growth element of the MLP story since reduced domestic production diminishes the need for new infrastructure.In spite of the collapse in crude oil, the fee-driven midstream MLP operating model turned out to be fairly robust to commodity prices – not immune, but with limited exposure. 2016 EBITDA forecasts for diversified midstream energy infrastructure names have been revised down by mid-single digit percentages; farther from the wellhead means less commodity sensitivity. Kinder Morgan’s 2015 operating results are coming in 5-6% below budget (and still up 5% on the year). Investors are clearly anticipating far worse.  As fund flows to the sector fell and finally turned negative, HNW investors were unwilling to provide additional capital even while MLP equity issuance fell. In 2015, MLP returns were dictated much more by capital flows than operating performance.

The high payout MLP model has come in for criticism from some who argue that MLP distributions are partially funded by issuing equity. This is untrue, but what is clear is that the growing infrastructure need to support increasing domestic hydrocarbon production has severely strained the available sources of capital. We believe 2015 performance is about the inadequacy of the long-established investor base to meet this growing need and the inability of alternative sources of capital to fill the gap. Operating results at midstream infrastructure businesses remained resilient with only modest exposure to collapsing crude oil prices. The growing conflict between high payouts and increasing growth plans is exemplified by Kinder Morgan.

RRC Nat Gas Projections Blog Jan 3 2016

Kinder Morgan

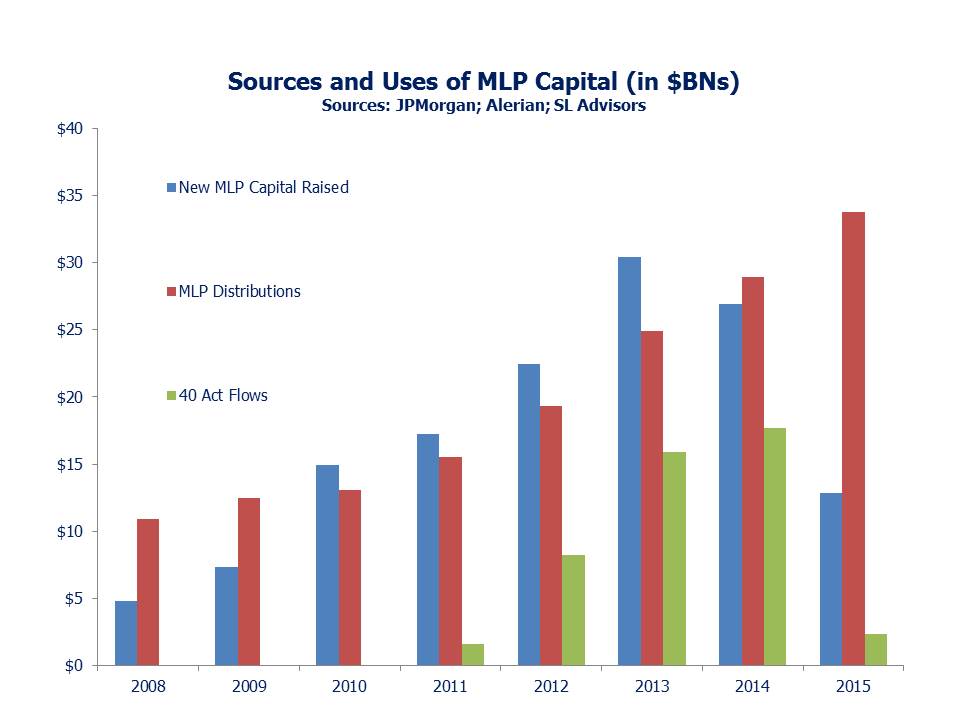
A simplistic model of how MLPs fund themselves is to examine what portion of the distributions MLPs pay out is then tapped as new capital via IPOs and secondary offerings. New equity raised increased from $5BN in 2008 to around $30BN in 2013. Distributions received by MLP investors grew from $10BN to $25BN. Therefore, new capital went from taking half of MLP distributions to well over 100%. Kinder Morgan Partners (KMP) reflected this trend, as their need for new equity capital rose from 73% of distributions paid out in 2008 to 101% in 2013. KMP investors in aggregate were reinvesting all of their distributions back into the business.

For a while the industry’s need for additional capital came from the growing number of MLP-focused ETFs and mutual funds, whose inflows increased tenfold from 2011 to 2013. This helped bridge the gap between the limited desire of K-1 tolerant MLP investors to reinvest more of their distributions back into the sector and the need of MLPs to finance growth.

Nonetheless, the yield on KMP units remained stubbornly high, consuming much management attention as their ambitious growth plans pushed up against the limits of customary MLP investors to provide financing. In 2014 they embarked on a significant restructuring that eventually resulted in a catastrophic destruction of value and betrayal of their core investor base. Recognizing the limits to external financing as an MLP, they became a conventional corporation (a “C-corp”) instead. Although this now gave them access to virtually any public equity investor, they persisted with the 100% MLP payout model and its reliance on external financing for growth. This variance with the more typical corporate funding model of a one third payout ratio and mostly internal financing eventually drove their cost of equity to where it no longer made sense to raise external funds. KMI had many choices including cutting their growth plans, selling assets and seeking JV partners. However, the 2014 restructuring had been about financing their growth and in 2015 that remained their priority.

For a while the market supported the new structure. KMI shares maintained their uptrend into 2Q15, but as the inflows to ’40 Act funds petered out and switched to outflows in the Summer the increasing selling pressure on MLPs affected KMI too. It was in some ways similar to a bank run; as long as the market believed they could finance growth by issuing equity at a 5% yield, they could. As the market began to question that by pushing the yield higher, their growth prospects became less attractive in a negative spiral.

Original KMP investors suffered enormously; they endured a dividend cut in 2014 as they received lower-yielding shares in Kinder Morgan Inc. (KMI); their exchange of KMP units for KMI was a taxable event; their new KMI units eventually collapsed, and then they suffered a second dividend cut in late 2015. KMI management owns around 18% of the shares, so they have suffered with their investors. It nonetheless shows that alignment of interests doesn’t guarantee good judgment.

KMI’s situation was different because they are bigger, more leveraged and have more ambitious growth plans than other MLPs. But the industry is being forced to reconcile its desired growth with the limited interest of traditional MLP investors to finance it. The shallow commitment of many ’40 Act fund investors became apparent when MLP prices stopped rising. The biggest monthly inflow to such funds of just under $3BN occurred in September 2014, merely a month after the Alerian Index peaked. A group that looks past the 35% tax drag prevalent on most funds and expense ratios as high as 9.4% (see Mainstay Cushing MLP Premier Fund[2]) can’t be expected to have done much research on their holdings. Their proclivity to be momentum investors, providing growth capital on the way up, continued on the way down. The cycle will probably repeat.

Valuation

At the risk of stating the obvious after such a year, valuations are as compelling as they’ve ever been for MLPs. The Alerian Index ended the year yielding 8.5% based on most recent distributions. Our SMA portfolio of GPs yields 7.3% and grew at 13.4% in 2015 (including KMI’s dividend cut). We expect 10% distribution growth over the next two years, and distribution coverage is 1.08X (excluding KMI which now covers its reduced dividend 4.6X).

Operating performance for many midstream infrastructure businesses was barely different in 2015 than expected a year earlier. For example, we went back and found JPMorgan forecasts of 2015 Distributable Cash Flow (DCF) per unit/share as they were in August 2014, when the market was peaking. We compared these forecasts with where 2015 results are coming in for the names in our MLP Strategy that are covered (around two thirds). DCF figures are coming in 1-2% lower than expected in the Summer of 2014, while their equity prices have fallen 40-50%. MLPs fell a long way for good reasons, but 2015 operating results were clearly not the major cause and we find it implausible that investors are looking ahead to far worse results in 2016. This is what prompted us to examine more closely the investor base, and to consider capital flows and the apparent unavailability of crossover buyers to invest at depressed prices.

What Next?

The absence of readily available capital to replace the exiting ’40 Act funds has highlighted the limited investor base. Although some commentators claim to see increasing institutional investment in MLPs, it’s more limited than they suggest. Google “Pension plans and MLPs”, examine SEC filings or look up who are the largest owners of MLPs, and you’ll find little evidence of pension funds, endowments or foundations. Such institutional investors that do exist are managing money on behalf of retail and HNW investors who have chosen the sector. There simply aren’t large pools of professionally managed institutional capital able to opportunistically and quickly increase their exposure to MLPs. The tax barriers substantially reduce the portion of the return they can keep, which drives up their required return (although current valuations may well be sufficient to draw in such capital in the months ahead). The fact that most MLP ’40 Act funds are highly tax-inefficient demonstrates that better alternatives generally don’t exist, unless you focus on MLP C-corps as we do. MLP closed-end funds (CEFs), which at least have permanent capital, nonetheless behaved like open-ended funds because forced deleveraging turned them into sellers too as prices fell. For example, Kayne Anderson (KYN), a large CEF, was down 51%.  Even other, generalist mutual funds which can theoretically hold up to 25% of their assets in publicly traded partnerships (which includes MLPs) are unlikely to shift much of their assets without doing careful research on a new sector, making them relatively slow-moving. As ’40 Act investors have been redeeming, their sales require a K-1 tolerant HNW investor to take the other side, often increasing his MLP exposure in a falling market. Anecdotal reports of macro hedge funds shorting the sector added further pressure.

As a result, the supply of MLP funding has turned out to be quite inelastic. Since crossover investors from other sectors are constrained by taxes, finding a balance between demand for capital and its supply relies mainly on traditional MLP investors shifting more of their portfolios to MLPs, something that has required an unexpectedly substantial drop in valuation.  The transfer from one type of investor to another has been highly disruptive.

Financing growth is the challenge facing the energy infrastructure industry. They have an advantageous tax structure but the investor base isn’t growing as fast as their need for new capital. How MLPs perform in 2016 and beyond will depend on how management teams resolve the conflict between their key investor base’s finite desire to reinvest more of their distributions and the industry’s growth plans. Clearly, new money from HNW investors required substantially higher yields, probably reflecting the fear that other managements will abuse them like Kinder Morgan and reinvest their capital for them by slashing payouts. The good news is that IPOs and secondary offerings fell sharply in 2015, reducing the portion of MLP distributions reinvested to below a third, lower than in 2008. This represents new buying capacity for the sector.

Kinder Morgan spectacularly demonstrated that converting to a corporation is not a solution. Smart management will slow existing growth plans so as to limit their need to access very expensive equity while maintaining payouts and will shift towards more internal financing, JV partners and asset sales. Buckeye Partners (BPL) and Magellan Midstream (MMP) both fund all their growth internally and have ample distribution coverage. All the General Partners we own have have coverage >1X.  Moreover, new projects should have higher required returns since MLPs’ cost of capital has risen. Less reliance on new equity should lead to faster per unit distribution growth in the future.

The MLP General Partner, as we have often written, still looks very much like a hedge fund manager and internally financed asset growth at the MLP can be just as profitable as using external capital. The pursuit of growth as a priority is not a value creating strategy, as Kinder Morgan showed. The shockingly high volatility of MLP prices in 2015 will lead to heightened perception of risk among investors for some time. The price collapse was not anticipated and initially we, like many others, struggled to reconcile it with steady operating results. In recent months our thinking has evolved to examining the investor base more carefully. We’ve concluded that capital flows were a far more important driver of MLP returns than operating results in 2015.

More modest growth plans can, by preserving payouts, attract more capital from long-established investors which will stabilize the sector and restore the trust between the industry and its providers of capital. Too much pursuit of growth will result in significant investor turnover and value destruction. Those MLP managements whose growth plans exceed investor appetite will abandon the MLP structure in favor of a C-corp, foregoing the tax advantages of the MLP structure in search of a bigger pool of clients and turning over their existing investor base in the process. More thoughtful management will tailor their growth to the MLP capital available. New equity issuance dropped sharply in 2015 coincident with fund outflows, and as a result the portion of distributions reinvested fell, potentially freeing up new capital to be invested. Current valuations are such that a demonstrated commitment to maintain payouts is all that’s needed to provide stability and thereafter positive returns. Our investment approach is guided by these views.

We are invested in BPL, KMI, and MMP

[1] Non ‘40 Act Exchange Traded Notes (ETNs) also provided MLP access to non-K-1 tolerant investors

[2] This was the expense ratio for the year ended 2/27/2015 as of 12/19/2015
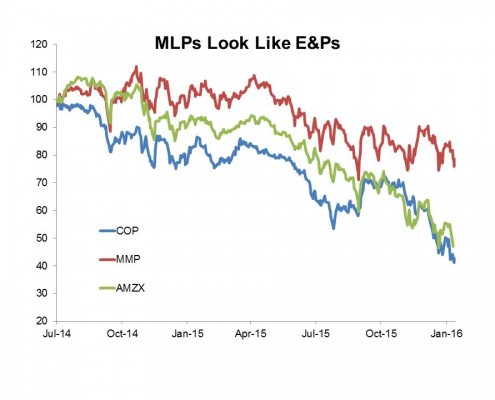


Adapting to New Circumstances

Investors are focusing carefully on the response of Master Limited Partnership (MLP) managements to the impact of a higher cost of equity on their growth plans. Those firms that moderate their growth forecasts in response so as to rely less on issuing equity and maintain their distribution coverage are acting thoughtfully with the best interests of their investors. To that end, Oneok (OKE) announced that they don’t anticipate issuing any equity at their MLP, Oneok Partners (OKS) until well into 2017. Their distribution coverage at OKE is expected to rise to 1.3X. It currently yields 10.2%. OKS yields 10.9% (both based on trailing distributions).

MLPs are reconciling their growth plans with the constrained appetite of investors to provide financing. MLP investors don’t tend to trade their positions that frequently because the tax deferral benefits grow over time for direct investors. Selling causes the  recapture of income previously received and a corresponding tax liability. Their long term investment horizon is rare today, with so much focus on the near term trend. OKE and OKS are recognizing the multi-year partnership with their investor base and behaving in a way that’s consistent with retaining their stakeholders.

The lifting of the U.S. ban on oil exports was quickly followed by an announcement by Enterprise Products (EPD) that it would provide pipeline and marine terminal services for the export of domestic, light crude. The first shipment is expected next month. It’s not a game-changer for midstream infrastructure, but is clearly good for them as well as for domestic crude oil producers.

We have concluded that an overlooked but important factor behind the collapse in MLP prices this year relates to capital flows and the investor base. In our first blog of 2016 we will publish a more detailed analysis of why understanding MLP capital flows is important and what it means for the sector going forward.

The chart below lines up the Alerian Index as it performed through the 2007-08 Financial Crisis and subsequent rebound with its performance through the crude oil collapse of 2014-15. An optimistic visual interpretation might suggest better days are ahead. We’ll see.

Blog Chart Dec 27 2015


Growth Prospects So Good We'll Cut Our Payouts to Investors

Thursday saw another example of tone-deaf decision making by the management of an MLP. Teekay LNG Partners (TGP) is an operator of ships that transport Liquified natural gas, petroleum gas and crude oil. Shipping is a horrible business; unlike pipelines, ships are highly mobile and so you’re never the only transport solution from A to B. On top of that, when industry overcapacity drives a ship owner out of business the ships live on, still contributing to the pressure on rates. Bankrupt shipping companies could provide a service to their competitors by scuttling their ships, but unfortunately they never do.

TGP cut their distribution by 80% on Thursday, claiming that they would fund their growth plans with internally generated cashflow since the equity markets are effectively closed to them.  In other words, the opportunities to reinvest cash in their business are so good they’re taking the decision out of their investors’ hands and redirecting the cash for them. Even though TGP was yielding 15% prior to the announcement, this implausibly high distribution yield evidently wasn’t reflective of widespread expectation of a cut since the stock promptly sank 50%. This may be due to the fact that although TGP’s press release claimed that “cash flows remain stable and growing” the company declined to provide any guidance for 2016 EBITDA. So it’s hard to know if they’re telling the truth. MLP investors value their regular distributions, and the persistent high yields on MLPs indicate that investors would prefer growth plans to be cut. A management that ignores this is looking for a new set of investors, a betrayal of the trust placed in them by the original ones. In fact, there’s something bordering on dishonesty about what TGP has done. If your operating results aren’t good enough to cover the quarterly payout, well that’s a risk that investors accepted. But TGP claims that business is good, cashflows “stable and growing.” Deciding to stop making payments to investors in order to reinvest the cash in new projects is to deny the message that the already high yield communicates. Investors don’t value those growth opportunities very highly, which is why TGP had already fallen 50% this year before the cut. There’s not much difference between TGP’s behavior and a hedge fund manager who prevents withdrawals by claiming unreasonably low prices on the securities he’d have to sell to meet the redemption. If they’re telling the truth about operating performance then they’re taking investors’ money to invest as they see fit, simply because they can, in spite of the fact that investors would clearly prefer that they did not. Or, operating performance is not as good as they say. Either way, it’s hard to see how management can regain trust after such  betrayal.

The other day one MLP investor was reeling off to me a list of tickers of MLPs that he owns, including well-known names such as EPD, ETP and PAA. He noted his portfolio also included regrettable overweights to OMG and WTF. It’s been that kind of year.

While we’ve wrestled with understanding operating performance, it’s increasingly clear to us that investor psychology is far more important in explaining returns on MLPs this year. U.S. K-1 tolerant high net worth investors remain the chief source of capital for MLPs. Crossover buying by U.S. and foreign institutions is impeded by significant tax barriers, so the sales made by ’40 Act MLP funds as their investors flee have a limited set of potential buyers. We’ll be exploring this more in our 2015 letter.

We are invested in EPD.


Kinder Shows The MLP Model is Changing

This week Kinder Morgan (KMI) did the right thing, after doing the wrong thing last year. By slashing their dividend they finally acknowledged that the MLP model of returning most free cashflow to investors and issuing new equity to finance growth doesn’t work in the C-corp structure they adopted in 2014. The square peg jammed in the round hole. Typical corporations pay out around a third of their profits in dividends and fund most growth with internally generated cashflow. KMI is conforming. Their mistake was committed last year (see Kinder’s Blunder), as was ours in not recognizing it sooner.

KMI isn’t an MLP, but they were once and most MLP investors also hold KMI. In many cases this is because they used to hold MLPs Kinder Morgan Partners or El Paso before they were rolled up into KMI last year. We reduced our KMI position in recent months in favor of more attractively valued names, but KMI affects investor sentiment so much that we’re all invested in KMI whether we own it directly or not. The MLP model isn’t broken. It retains its advantage in holding energy infrastructure assets since its freedom from corporate income tax gives it a lower cost of capital. MLP distributions continue to be tax-advantaged to investors. The MLP GP still looks like a hedge fund manager (see Energy Transfer’s Kelcy Warren Thinks Like a Hedge Fund Manager). KMI abandoned all this for the C-corp structure but kept operating like an MLP.

KMI’s operating performance in 2015 hasn’t been much different than expected a year ago. They budgeted $4.8BN of Distributable Cash Flow and are coming in at $4.6BN; EBITDA of $8BN, coming in at $7.5BN. Down 5-6%, because they’re not immune to crude oil prices, but no matter. Like their MLP cousins their stock price has sunk as investors look ahead to substantially worse operating performance next year. It may turn out that way but you won’t find much support for that view from recent financial reports or company guidance. Plains All America (PAA) expects rising EBITDA next year and in 2017, at which time they plan to resume annual distribution increases. They are considering numerous alternatives including a potential consolidation with their MLP and a distribution cut at PAA or PAGP is not off the table. We don’t expect it but can no longer rule it out. Meanwhile, Plains GP Holdings (PAGP) yields 10.0% based on its October 2015 dividend (which was +21% on a year ago). Energy Transfer Equity’s (ETE) CFO Jamie Welch was on CNBC noting their 7.5% yield with 1.2x coverage (based on their last dividend, +37% on a year ago) and predicting continued (albeit slower) growth.

But MLP stocks have collapsed this year so something must be badly wrong. Certainly the volatility of their securities has jumped, and investors will tread more warily for some time as a result. Most fundamental analysis and company guidance are severely at odds with market prices. The two will eventually reconcile.

An alternative interpretation is that the market is rejecting the industry’s plans to finance its growth through issuing new equity and debt. KMI’s problem is not unique, they’re just bigger, more leveraged and have a more extensive list of growth projects than others. They tried to solve it by becoming a C-corp and thereby accessing a bigger pool of investors. Their dividend cut was the traumatic acknowledgment of the problem.

It’s easy to dismiss today’s sellers as mistakenly expecting deteriorating operating performance next year. What’s more interesting though is to ask where are the new investors who ought to find current values compelling. Their absence, which has allowed yields to drive higher, may signal that MLP investors don’t want to provide the financing that’s needed. The pool of traditional, K-1 tolerant investors isn’t big enough to provide the new capital. An industry with decent operating performance and substantial growth plans ought to be funding more of that growth internally. Examining operating performance and distribution coverage is clearly not the solution to establishing the security of a payout. A company’s growth plans and its commitment to them is just as important. KMI may not be the last company to accept this reality. Continued high yields on MLPs reflect a diminished appetite from traditional MLP investors to finance growth and make the use of equity financing increasingly uneconomic.

Many MLP management teams and investors (including us) believed MLP investors would willingly accommodate this growing appetite for capital. Smaller, retail investors were tapped via ETFs, mutual funds and other products that avoided K-1s (albeit in many cases inefficiently). But this class can sometimes be flighty, momentum investors and they have been leaving. The MLP structure is the cheaper legal entity through which to finance energy infrastructure, but the market is coming up short of enough interested capital.

We may be transitioning to a different type of security, with lower payouts that grow faster and more internally financed growth. It’s not what original MLP investors signed up for. The shift is painful.

Casualties so far include investors who interpreted the shocking price collapse as portending something worse and sold as a result. We’re most certainly not in that category, but our reputation as market timers has not emerged unblemished, and maintaining MLP exposure throughout 2015 hasn’t been fun. It may not get any better for some time. Nonetheless, from where we sit last week looks like the low for the year in the sector. Of course, we’ve put in the year’s low numerous times already, and I for one possess the tire tracks across my back as evidence. Humility can be expensively learned. While the industry’s prospects are good, the financing model may be shifting to one of lower payouts, less reliance on external finance and greater use of internally generated cashflow.


Equity Underwriting for Dummies; Kinder's Blunder

If a banker approaches the CEO of a Master Limited Partnership (MLP) with an offer to help, the CEO should run (not walk) in the other direction. The latest victim is the management of Columbia Pipeline Group Inc (CPGX). A month ago management had indicated that they’d be tapping the markets for equity via their MLP, Columbia Pipeline Partners (CPPL). This is how it’s meant to work, with CPGX as the General Partner (GP) directing the MLP it controls to raise capital and invest it, sending half the free cashflow up to CPGX via the Incentive Distribution Rights (IDRs). They currently have $8BN in projects, notwithstanding the market’s current skepticism about MLP growth prospects. To reuse the hedge fund analogy, CPGX is the hedge fund manager (i.e. earning a share of the profits and providing management) and CPPL is the hedge fund (i.e. doing as directed by the GP).

But a month later, no doubt advised by its self-serving equity underwriters Goldman Sachs and Credit Suisse, CPGX instead issued equity, thereby raising capital at the GP level rather than the MLP level. “Hedge fund manager dilutes itself by issuing equity” is not a headline as commonly viewed as “Investors pile into hedge fund”. In this case, CPGX acted as the former when they ought to know better.

Goldman and Credit Suisse did what they do well, which is to ensure that CPGX stock traded down until the moment of pricing, ensuring a profit for the underwriters and favored clients at the expense of existing CPGX investors. The offering was priced at $17.50 on December 1, an 8% discount to the prior day’s close and a level at which it had never previously traded. Due to strong demand the offering was upsized from 51M shares to 71.5 and the stock quickly traded up while the underwriters exercised their option to buy an additional 10.725 million shares (upsized from 7.65 million shares) on top of the 71 million originally sold. Clearly, the market was not surprised; the circumstantial evidence points strongly to the underwriters alerting clients to the offering in the preceding days and thereby softening the market. This is because only the underwriters had both the advance knowledge of the offering and the incentive to see the stock trade off in the days prior to pricing.  Perhaps the equity capital markets staff use hand signals to alert their colleagues on the other side of the Chinese wall about what’s coming, so as to avoid leaving any evidence of their communication. In any event, the result was a success for all involved, except regrettably for CPGX investors whose shares were valued as high as $22 just a month earlier. Make that another win for Wall Street bankers. My book Wall Street Potholes will soon need a Volume 2. You can never be too cynical.

CPGX Dec 4 2015 Revised


I reviewed several corporate finance blunders a few weeks ago in Investment Bankers Are Not Helping MLPs. Kinder Morgan (KMI) was part of that with their poorly handled offer of mandatory convertible securities. But on reflection, they may have committed the biggest blunder of all last year with their restructuring in August 2014. It looked clever at the time, and to our subsequent regret we liked it (see Valuing Kinder Morgan in Its new Structure). By acquiring their MLPs, Kinder Morgan Partners (KMP) and El Paso (EP), they were able to revalue their assets to current market prices and thereby create a higher tax-deductible depreciation charge that fueled a faster growth rate in their dividend. It was pretty slick.

But in hindsight, the reasons for the restructuring were a warning. At their size, they were unable to finance enough accretive projects to continue growing their dividend at its previous rate. The hedge fund analogy is useful here, because almost every hedge fund eventually gets too big. KMI, the GP of two MLPs and in effect the hedge fund manager, should have accepted that slower growth was inevitable and been satisfied with 1) a recurring 6.8% distribution yield growing modestly at KMP, effectively its hedge fund, or 2) consolidating and financing growth from retained earnings like all the other large C-corps. Instead, they adopted a structure yielding 5% with 10% projected growth fueled by the higher depreciation charge but reliant on equity markets to provide capital to finance part of their growth. Fifteen months and a more than 50% drop later, they now have a 12% yielding security with 6-10% 2016 growth and questions swirl about their ability to finance accretive projects given that their cost of equity has doubled. Moreover, it’s no longer an MLP, and the pool of potential investors, while large, looks beyond distributable cashflow and distribution yield and to other metrics such as Enterprise Value/EBITDA, against which it didn’t look quite so cheap at the time.

It’s no doubt a better investment today than it was in August 2014, and it remains a modest holding of ours although substantially less than in the past as we’ve switched into more attractive names. But the MLP-GP structure, with its close comparison to the hedge fund-hedge fund manager, is how Rich Kinder became a billionaire. Incentive distribution rights, the mechanism by which KMI earned roughly half the free cashflow from KMP and (more recently) EP, are similar to a hedge fund manager’s 20% incentive fee. Rich Kinder was smart enough to figure that out, but not smart enough to recognize when it’s time to stop accessing the secondary market for financing.  The largest MLP, Enterprise Products (EPD), funds its growth from internally generated cashflow rather than issuing equity  and has 1.3x coverage on its distribution. Perhaps that’s why EPD unitholders have fared better.

Size is the enemy of performance in hedge funds and, at times, in MLPs. Shame on Rich Kinder for not realizing it and instead letting the investment bankers talk him into the value destroying structure. He bet faster growth would drive down the yield on KMI, making it an acquisition currency of less leveraged businesses in a downturn, which would in turn reduce KMI’s leverage. The strategy has backfired. KMI no longer gets credit for the dividend, which leads to questions about its sustainability. While it’s covered by cashflow and they don’t need to issue new equity until 2H16 since doing the mandatory convertible, if KMI still yields >10% in late 2016 it’ll make more sense for them to cut the dividend and thereby reduce or eliminate their need for additional equity. KMI has made the mistake of many hedge fund managers and investors, thinking they can grow indefinitely. Although some commentators are worried about pressure on pipeline tariffs from stressed E&P companies, there’s a stronger case for tariff increases since the cost of equity for pipeline owners (i.e. MLPs) has risen.

Hedge fund managers don’t buy their hedge funds, and MLP GPs shouldn’t buy their MLPs. Management at Targa Resources (TRGP) should take note (see Targa Resources Needs an Activist).

We are invested in CPGX, EPD, KMI and TRGP.


Targa Resources Needs an Activist

Writing a blog from the vantage point of your own firm is fantastically liberating compared with analyzing markets at a well-known behemoth, where any criticism risks offending a corporate client. Thus it was that in April 2014 I could write ADT and the Ham Sandwich Test, as we invoked Warren Buffett’s advice to only invest in companies with a sufficiently strong business model that they could be run by a ham sandwich. In other words, management can surprise you with their ineptitude. ADT continues to disappoint.

Sometimes the failings of management are rather more subtle. The “Peter Principle” holds that managers rise to the level of their incompetence, to the detriment of shareholders. Success in one position leads to promotion further up the corporate ladder until the demands of the role exceed the manager’s abilities, at which point he stops moving up. Too often, Boards of Directors stumble in their oversight and allows the management to engage in self-interested behavior This is what has happened at Targa Resources Corp (TRGP) which is the General Partner (GP) of Targa Resources Partners (NGLS). NGLS is an energy infrastructure business structured as a Master Limited Partnership (MLP). They run pipelines for Gathering and Processing (G&P) crude oil and natural gas, and provide additional “downstream” services such as fractionation, storage, distribution and marketing.

The business has been ably run by its GP, led by Joe Bob Perkins. Distributions since 2008 have grown annually at 8.5%. Even in 2015, with distributions on the Alerian Index down 6% compared with last year (see Measuring Dividend Growth is Complicated), NGLS has managed 6.2% growth. TRGP’s 2015 distributions are up 26.5% compared with 2014. That’s why you own the MLP GP rather than the MLP itself, because they grow faster and it’s where the people that actually run MLPs put their own money (see Follow the MLP Money).

However, TRGP’s operating excellence has not been matched by its strategic insight. Management has run the business well and at the same time destroyed substantial wealth for their investors, via a Board rubberstamping management’s self-serving recommendations. We need Joe Bob Perkins and his team to focus on operations and let someone more capable lead the company. July 2014 was the point at which the strategic inadequacy of TRGP’s leadership began to weigh on their strong operating ability. That was when the market’s growing recognition of their value  was highlighted with Energy Transfer Equity (ETE)’s attempt to acquire them. CEO Kelcy Warren is someone who clearly understands the value of the MLP GP (see Energy Transfer’s Kelcy Warren Thinks Like a Hedge Fund Manager). Although it’s breathtaking to consider today, with TRGP languishing at $41,in July 2014 negotiations broke down with TRGP trading as high as $160. In other words, Perkins and his Board were unwilling to sell their 42.4M outstanding shares of TRGP, citing undervaluation at that price.

TRGP remained bullish on the outlook for gathering and processing, because in October 2014 they announced the acquisition of Atlas Pipeline Partners (APL) by NGLS, with TRGP acquiring APL’s GP and related assets at Atlas Energy, LP. They paid with $610M of cash (financed with debt) and 10.4M shares of TRGP stock, (then worth $1.1B trading at an adjusted close of $104 on the day of the announcement, even though by that point it had shed a third of its value since the aborted discussions with ETE). Although they weren’t willing to sell at $160 in July 2014 to a primarily long haul pipeline company, three months later they were willing to trade their stock while taking on leverage (previously there was almost no leverage at TRGP) for a business with significantly more commodity exposure (APL’s G&P business is closer to the well-head with significantly less fixed fee contracts). In addition, they conceded $78M in GP/IDR givebacks at TRGP while paying $190M in change of control and transaction fees as part of the Atlas transaction.

Chart for Nov 29 2015 Blog

In 2015 TRGP and NGLS stock fell along with the rest of the MLP sector, although their operating performance remained fine. Then on November 3rd, management stunned investors by announcing that TRGP would acquire NGLS by issuing new shares to current NGLS owners. TRGP was at $58 the day before the announcement, and since then has sunk below $40 to complete a colossal destruction of value. Just prior to the announcement, TRGP was yielding 6.95% and NGLS 10.8%. The high yield on NGLS reflected a higher cost of equity, threatening to impede its ability to fund its growth by issuing new equity at a competitive cost. The logic behind the merger was to improve the distribution coverage by giving NGLS unitholders lower-yielding TRGP stock, and to improve the growth outlook by eliminating the payments to TRGP that take place under Incentive Distribution Rights as with most MLP GPs.

Investors in TRGP regarded the elimination of the economic and other associated rights of the GP negatively. TRGP always has the option to temporarily waive its claim to IDRs if it supports NGLS (as it did in the Atlas transaction), so why concede them permanently? Consequently, TRGP’s stock sank. But it was no better for NGLS unitholders. The pricing of 0.62 shares of TRGP for each unit of NGLS was expected to represent an 18% premium to the prior day’s close, but as TRGP investors reacted poorly to the loss of their GP rights the takeover premium quickly evaporated. On top of this, the transaction is taxable to NGLS unitholders.

Rather than lowering its cost of capital, TRGP management has managed to increase it. TRGP’s yield has jumped from 6.25% to 8.75%. Once again, the investment bankers advising an MLP have wrought mayhem (see Investment Bankers Are Not Helping MLPs). TRGP’s management has completed their 180 degree U-turn, from rejecting ETE’s overtures in 2014 when their stock was at $160 to now issuing a substantial number of new shares with the price 75% lower.

It represents strategic incompetence of Biblical proportions.

Given the reaction of TRGP and NGLS, everybody is poorer. Leon Cooperman dryly asked whether their advisors had expected such a market reaction on the conference call to discuss the transaction. It still has to be approved by both sets of shareholders. Given the series of mis-steps by this leadership team and the destruction of value they have perpetrated, it’s not clear why anyone would vote to approve. Joe Bob Perkins and his strategy team have clearly risen to the level of their incompetence. They should stick to running the day-to-day business and stay away from strategy because they are so bad at it. TRGP is desperately in need of new leadership, of interest from activist shareholders who will demand a more thoughtful approach. We plan to vote against the proposed transaction, and we believe all TRGP and NGLS investors would benefit from voting No.

We continue to hold TRGP as we believe the assets which have G&P exposure to the best basins and enviable downstream NGL logistics have strategic value to many midstream peers, and are worth substantially more in others’ hands.  We encourage the Board to consider their fiduciary duty to shareholders and act in their best interests by pursuing a sale of the company.

We are also invested in ETE.


Measuring Dividend Growth is Complicated

You’d think this would be a pretty simple issue. It’s certainly an important one. Equity investors derive their returns from dividends, dividend growth and capital gains. A simple estimate of long term returns on an equity security is to add the current dividend yield to expected dividend growth to arrive at the expected annual return. If the dividend yield remains constant then the security’s price will rise at the dividend growth rate, hence adding them together makes sense. It’s a shorthand, necessarily imprecise estimate; the dividend yield can fluctuate and the growth estimate can be wrong. Currently, the S&P 500 yields around 2% and dividend growth has averaged 5% for the past 50 years, so a 7% long term return estimate for U.S. public equities is defensible on this basis. Different assumptions will produce a different result.

But the devil is in the details, as you will see. Since much of what we do is in energy infrastructure, we look pretty closely at the Alerian Index as the benchmark for Master Limited Partnerships (MLPs). Growth in distributions (what MLPs call the dividends they pay) is a key component of total returns in this sector, so what have distributions done in 2015?

There’s more than one answer. You can derive a monthly dividend rate on the Alerian Index (AMZ) by multiplying its month end yield by its price. Using this methodology, adding up the last 12 months’ dividends and comparing with the prior 12 months gives a drop of -4.0%. If you estimate the last two months’ of 2015 to be at the same rate as October, you arrive at a full year 2015 figure of -6.0% versus 2014. Another estimate uses just the October 2015 payout rate compared with the prior October, and on this basis they’re down -9.5%. None of these figures are wrong, they’re just different measurements.

The chart shows distribution growth using the one year change in the monthly rate going back to 2007. Prior to the collapse in oil, growth was running at around 5% so the 15% deterioration in the AMZ growth rate is similar to the drop that occurred in 2008. This roughly matches the performance of the index, which by September 2015 had fallen 40.1% from its August 2014 high, roughly the same as its 41.1% drop from June 2007 to December 2008.

Alerian Monthly Distribution Growth Chat for Nov 22 2015 Blog

Veteran MLP investors may recall that AMZ enjoyed positive distribution growth through the financial crisis and be puzzled by the chart showing it was negative. In fact, full year 2009 distributions were 0.5% higher than full year 2008. The year-on-year change in the monthly distribution rate was -2.5% in July 2009. Incidentally, Alerian reports that 2009 growth was +3%. They measure this by taking trailing growth multiplied by the year-end weights of those securities in the AMZ. This doesn’t necessarily reflect the actual experience of investors in AMZ in 2009. Methodology counts for a lot.

The drop in distributions in 2015 has been driven by exploration and production names, many of whom have cut or eliminated their distributions. Upstream businesses are highly sensitive to oil and gas prices. Midstream MLPs have done rather better. The GPs of midstream MLPs have done better still. For example, in our Separately Managed Account strategy, actual cash distributions and dividends for 2015 are coming in at 15.7% higher than 2014. Part of this is driven by reinvestment of dividends, so reversing this feature to get to apples and apples results in 12% growth, 18% better than the equivalent for AMZ. The table below shows selected holdings of ours. We don’t expect growth at the same rate, but it illustrates the difference in operating performance of GPs compared with the AMZ.

Name Trailing 12 Month Distribution Growth
Energy Transfer Equity (ETE) 37%
EnLinc Midstream (ENLC) 11%
Kinder Morgan (KMI) 16%
Plains GP Holdings (PAGP) 21%
Targa Resources Corp (TRGP) 24%
Williams Companies (WMB) 14%


Certain information herein has been obtained from third party sources and, although believed to be reliable, has not been independently verified and its accuracy or completeness cannot be guaranteed. References to indexes and benchmarks are hypothetical illustrations of aggregate returns and do not reflect the performance of any actual investment. Investors cannot invest in an index. There can be no assurance that current investments will be profitable. Actual realized returns will depend on, among other factors, the value of assets and market conditions at the time of disposition, any related transaction costs, and the timing of the purchase. Nothing herein is or should be construed as investment, legal or tax advice, arecommendation of any kind, a solicitation of clients, or an offer to sell or a solicitation of an offer to invest in a fund or funds. An investment in a Fund may be offered only pursuant to the Fund’s prospectus.


Retail Therapy

Retail stocks have recently taken a pounding. Nordstrom (JWN) fell 15% on Friday following weak earnings. Macy’s (M) fell 14% a couple of days earlier following their earnings. All of a sudden retail is a tough business. Consumers aren’t buying quite as readily as they were. We’re not invested in the retail sector, so as I watched these stocks collapse I must confess to experiencing the kind of grim satisfaction that one feels when others experience a discomfort with which we’re already uncomfortably familiar. A friend reminded me it’s Schadenfreude. It’s not just energy infrastructure names that can cause sharp, sudden financial pain to their investors. Yeah!! Finally, it’s somebody else’s turn for a price shock! Readers who are invested in retail stocks will hopefully forgive this temporary insensitivity to their plight.

Although the S&P500 is flat for the year, there’s evidence to show that individual, retail investors have had a substantially worse time of it. Master Limited Partnerships (MLPs) are predominantly held by individuals whereas U.S. public equities are largely held by institutions. The 29% drop in the Alerian Index this year is substantially worse than the S&P500 and has been disproportionately endured by individuals.

Closed end funds is another area where individual investors dominate, because there’s insufficient liquidity to attract many institutions. The sector appeals because of the yields but also because of the opportunity to invest in funds at a discount to their net asset value. Many large funds are trading at double-digit percent discounts, reflecting the diminished appetite of new money to invest and close the gap. CEF Connect lists Pimco Dynamic Credit Income (PCI), DoubleLine Income Solutions (DSL) and Cohen and Steers Infrastructure (UTF), all fairly sizeable funds with a market cap of $1.6-2.6BN, with discounts of 13-17%. MLP funds in this sector usually trade at a premium, since investors value the 1099 for tax reporting (since direct holdings of MLPs generate K-1s) but even these funds are at a discount to NAV. Kayne Anderson (KYN), one of the largest such MLP funds at $2.2BN in market cap, is down 43% this year. Because they use leverage, like many of their peers, they will have undergone forced selling of positions in order to remain within their borrowing limits, causing a permanent loss of capital and illustrating some of the non-economic selling in the sector. KYN has a 10 year annual return of 5.25%, versus 9.4% for the Alerian Index. Leveraged exposure isn’t that smart.

Activist hedge fund managers are some of the smartest guys around. It’s interesting to watch their moves and copying them can be compelling. They’re often on TV and the stocks they own garner outsized media attention. You don’t have to try that hard either. For those unwilling to hunt through SEC filings there is a convenient mutual fund called the 13D Activist (DDDIX) which invests in stocks targeted by activists. It’s down 9.1 for the year. It owns Valeant (VRX), which has ruined the year for a few Masters of the Universe as well as retail investors.

So it seems as if individual investors are having a pretty tough year that is not reflected simply by looking at the S&P500. Asset classes that are most favored by individuals have had a tough year, and as we head towards the Holidays it’s a time for dumping what’s not working. Tax-loss selling or simply cutting loose investments that have not worked is depressing certain security prices by a surprising amount. It’s likely causing some of the liquidation we’re seeing  that often appears to be borne out of resignation rather than an assessment of new information.

My retired bond trader friend was well known for making money from bearish bets on bonds by selling first and buying later, although he always maintained that he was comfortable making money in either direction. He did this more regularly than most and enjoyed substantial professional success. However, while enduring a particularly tough period of shorting the market only to be forced to cover at a loss, he was lamenting to his wife how difficult it was to make money. Her breezy advice was to do what she did when she was fed up; go out and buy something. Of course, buy first and then sell was the answer.

Retail therapy is what’s needed by today’s retail investors, and the retail industry could certainly use it.