The Folly of Leveraged ETFs

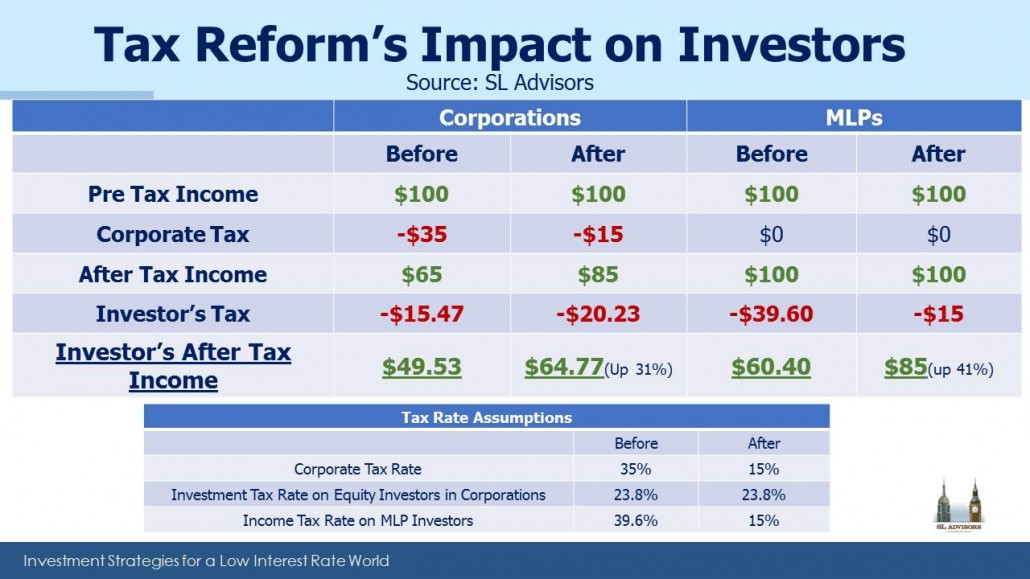
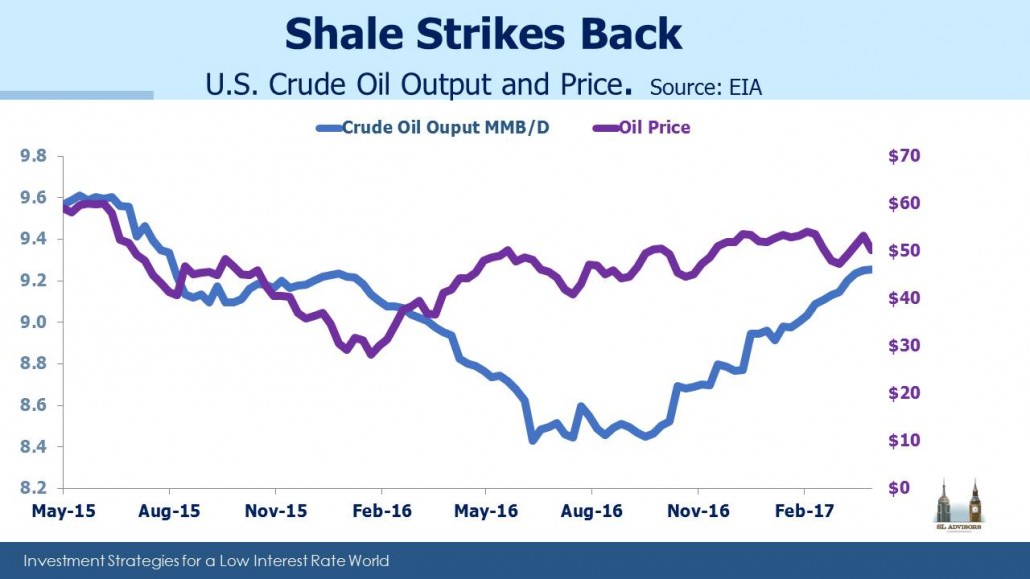
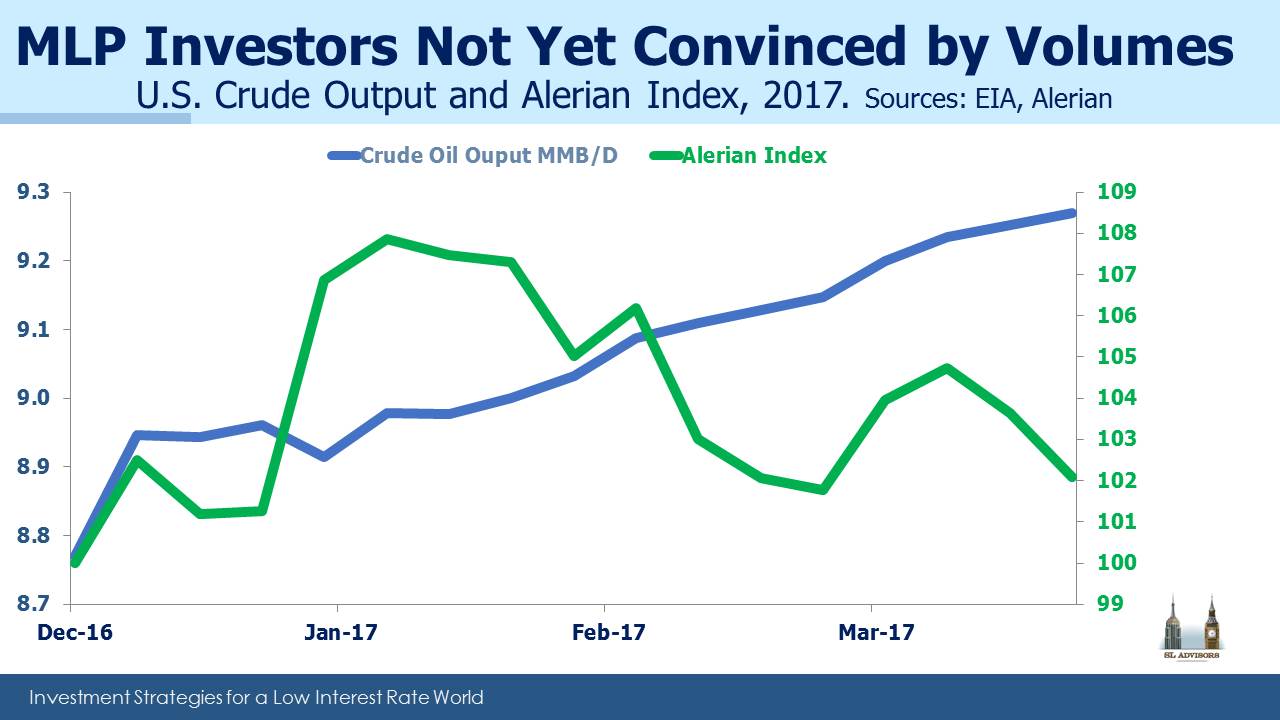
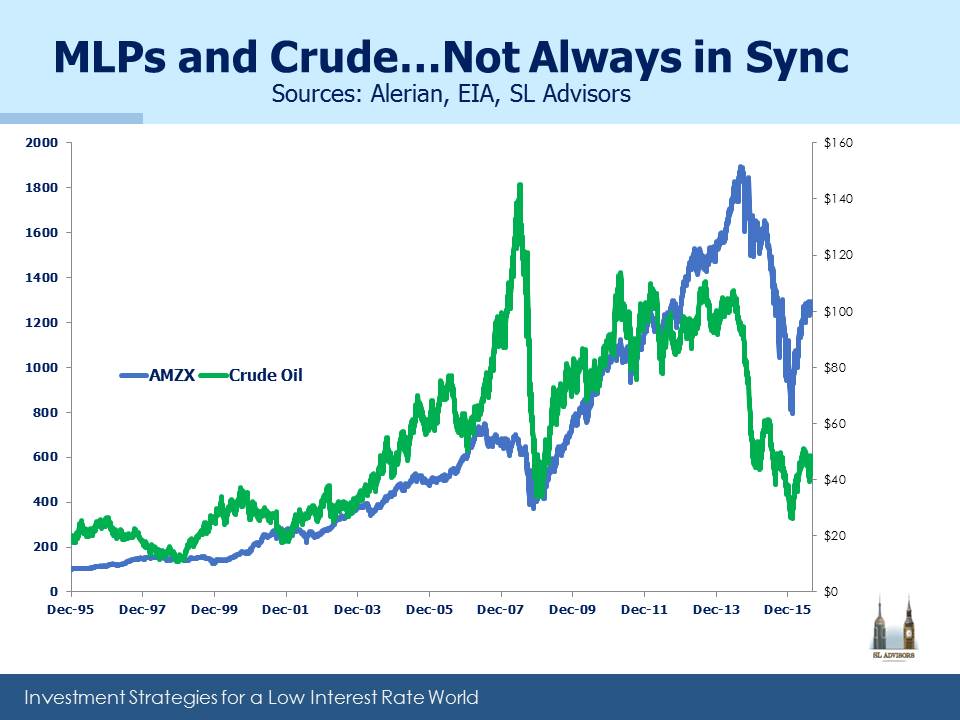
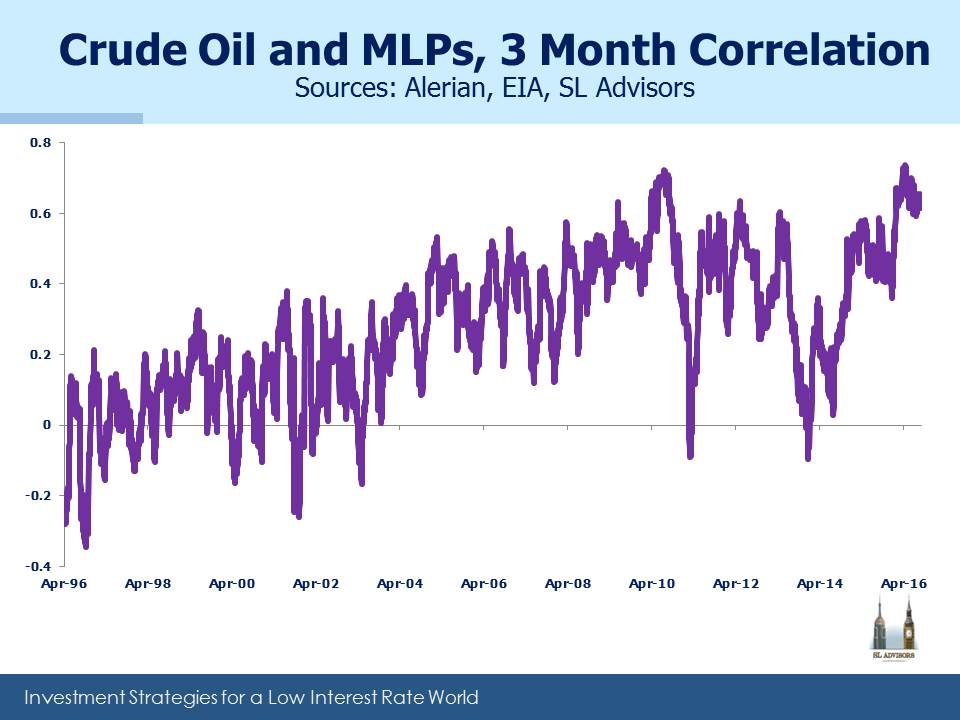
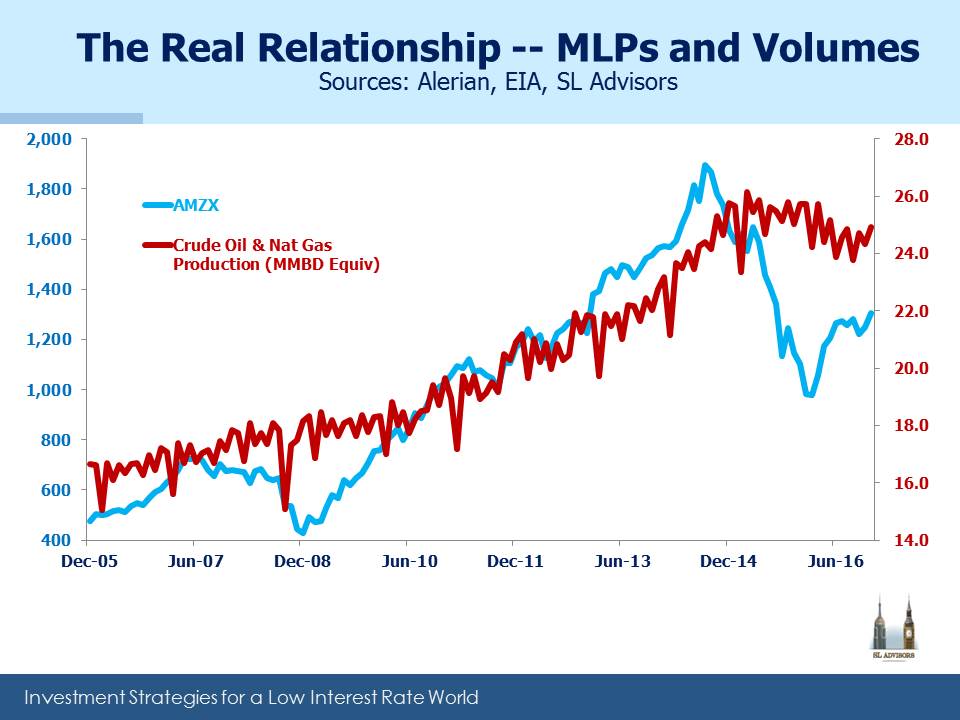
Recent weakness in crude oil has spilled over into Master Limited Partnerships (MLPs). Some connection between the two is understandable, because part of the bull case for MLPs lies in growing shale output increasing demand for energy infrastructure. Lower oil prices dampen the enthusiasm for the idea that Exploration and Production (E&P) companies will be competing for sometimes scarce pipeline resources. For our part, we think the short-cycle nature of shale offers a substantial advantage for producers (see What Matters More, Price or Volumes?). MLP investors often feel they must have a view on crude oil before investing; because U.S. volumes are likely to rise in almost any price scenario, we think it’s less important other than over the short term perhaps. Shifting your MLP exposure around in response to oil prices is not a good long term strategy. If you have a view on oil, invest in oil.

Profiting from owning crude oil is harder than you might think. Many ignore storage costs. While these aren’t directly reflected in spot prices, they are most assuredly part of the return from owning securities linked to the price of oil. The costly “rolldown”, by which the expiring near futures contract has to be regularly rolled into the next, higher priced one simply reflects the cost of storage. The approximately $1.20 per barrel price difference between May and August crude futures is largely due to the cost of storage for three months. Think of it as the time value of money applied to crude oil.

Exchange traded products linked to oil have a checkered past, which some think shows the need for a better solution aimed at those who would like to profit from their view of oil prices. ProShares, a purveyor of leveraged ETFs, has come up with a doozy.

Oil has been pretty volatile over the last few years. From its peak in 2014 its spot price dropped by 75% through February 2016, before doubling over the next year. If your version of excitement is a commodity price that gyrates wildly, you need look no further than oil futures.

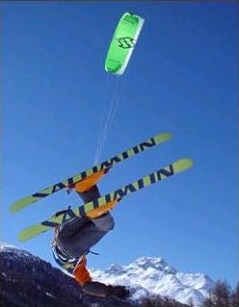
But some find this tame. Downhill skiing may appear sedentary to those who insist a true mountain experience must be preceded by a helicopter ride to find real deep powder. But the kite skier needs a three-dimensional snow experience; if it’s not dangerous it’s not worth the trouble.

.avia-image-container.av-4l3n07-5c789f5eced0c4ec77682c2c3b85e184 img.avia_image{ box-shadow:none; } .avia-image-container.av-4l3n07-5c789f5eced0c4ec77682c2c3b85e184 .av-image-caption-overlay-center{ color:#ffffff; }

The kite skier is the type of buyer attracted to the ProShares UltraPro 3x Long  Crude Oil ETF, designed for those wanting to profit from rising crude oil (Ticker: OILU). And because excitement need not be limited to a rising market, they also have a bear market version (Ticker: OILD).

These two investments share a couple of traits with kite-skiing, in that they’re dangerous and not everyone involved will have a good time. OILU is designed to move each day by three times the percentage move in the Bloomberg WTI Crude Oil Sub-index. In order to maintain this 3X exposure to daily moves, OILU will need to rebalance its holdings every day. Without going into the messy details, this introduces the insidious nature of the use of leverage, in that rebalancing will always necessitate trading in the direction of the market. Following a rise in crude, they’ll need to buy more oil futures to bring their exposure back up to 3X. When it falls, they’ll need to sell oil to bring their exposure down to 3X.

As you can appreciate, if oil goes up and down but doesn’t make much overall progress, the buy high/sell low rhythm of re-hedging will relentlessly eat away at the holder’s value.

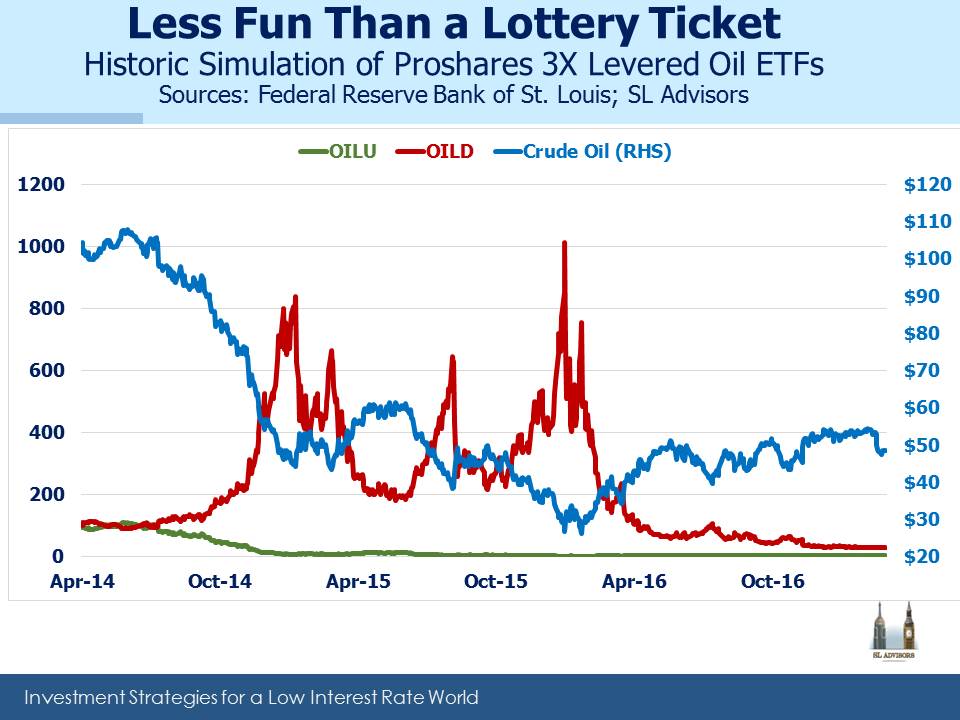
The last couple of years were interesting to say the least for oil traders. It’s possible to simulate how OILU and OILD would have performed for their holders over this period. The simulation omits fees and transactions costs, so the real results would have been a bit worse.

.avia-image-container.av-2694zr-1c74788f8a940625bbf02282195f67d2 img.avia_image{ box-shadow:none; } .avia-image-container.av-2694zr-1c74788f8a940625bbf02282195f67d2 .av-image-caption-overlay-center{ color:#ffffff; }

It might not surprise to learn that OILU lost money when oil went down. It is after all designed to make money if oil rises, so if your forecast is wrong OILU will not be your friend. Crude peaked in April 2014, and OILU would have lost 90% of its value by Christmas. Its chart looks rather like a kite skier suffering cardiac arrest. Although it’s hard to see, I can report that OILU did double in price when oil began to rally, albeit after falling 95%.

More surprising is that the bear market version, OILD, ultimately fared little better. Although crude oil is roughly half its value from three years ago, the OILD holder who made this correct forecast nonetheless saw his investment lose 70% of its value.

The point here is that 3X levered ETFs are not for those who develop an emotional attachment to their securities. The longer your holding period, the greater the certainty that you will lose money. Therefore, the optimal holding period is correspondingly as short as possible – or, if you’re not a kite skier, no holding period at all. Leverage means you care not just about the accuracy of your forecast but also about how quickly it happens. Predicting the near term path of prices as well as their ultimate resolution is how the over-confident are separated from their money. Leveraged ETFs are designed with the expectation that rebalancing will inexorably drive their value to zero.

The seductive and eye-catching part of the chart is of course the eightfold and eventually tenfold increase in the price of OILD. It was most definitely possible to make a lot of money from OILD. It required the possession of both oil price insight and exquisite timing, but for those blessed with both a healthy gain was to be had.

The problem is that, since few could have had such luck, over the three year simulation the typical holder lost money. Because ETFs don’t have a fixed share count some might quibble with this assertion; buying might have been substantial at low prices and inconsequential at high ones. It is unknowable of course, but in securities markets activity inevitably rises with prices. There would have most likely been many more buyers of these levered ETFs when they’d risen, further increasing the ranks of ultimate losers.

So you have a product that will be profitable for some but unprofitable for many and certainly for most. Should it even exist? How should we regard the supplier of something of whom the customers will for the most part suffer financially from their purchase? Is ProShares part of the efficient channeling of savings towards productive capital formation, the reason public capital markets exist? Or are they the casino owner, profiting from customers who on average will be richer by not entering?

And what’s wrong with that? Lottery ticket buyers, even the least financially sophisticated, pretty much understand that the odds are against them. In willful defiance of classical economic theory, lotteries nonetheless thrive even though the customers are selecting negative expected outcomes. They do this because the hope of winning, the dreaming of how that payoff would transform life, itself comes with positive utility. No ticket, no dream. Hope has value.

Is it therefore also true that users of ProShares products similarly comprehend the adverse odds they face and nonetheless derive utility from the hope of profit? Or is it more likely that they don’t perform the analysis above, and attribute any financial outcome to their expressed opinion rather than poor choice of product? In this case, the buyers of ProShares 3X products are less financially sophisticated than the lottery buyers they might regard with disdain. When waiting in 7-11 to buy milk while a customer ahead purchases a lottery ticket, the ProShares buyer should seek his financial advice. He might learn something. Lottery ticket buyers have more realistic expectations than ProShares buyers.

The ProShares prospectus details various dire outcomes that may result from a purchase. But of course nobody reads prospectuses, so they are legally compliant if not informative. However, shouldn’t there be a presumption that the typical holder of a ProShares product will profit if his underlying view is correct? What use is a supplier of financial products that largely destroy value? Demand certainly exists, as ProShares proudly notes on its website the $27BN in such ETFs they offer. But size of capital raised doesn’t prove intelligence by the investors, as the hedge fund industry routinely proves.

If some regard “ethical financier” as an oxymoron, it might be in part because of the values behind the offering of 3X leveraged ETFs. Just because something can be created doesn’t mean it should be.


The Slow Shift in Power

The U.S. produces electricity from diverse sources; burning coal and natural gas each provide just under a third of our needs (natural gas is steadily displacing coal, which is good for those MLPs that transport, process and store natural gas). Nuclear is 19%, with the rest being other renewables of which hydro is the biggest. Solar from all sources (which includes both utility scale production as well as rooftop panels that supply back to the grid) is currently 1.4%. In 2016 we used around 4,100 TWH (Terrawatt Hours).

To explain the dizzying numbers: One Terrawatt (TW) is 1,000 Gigawatts (GW). One Gigawatt is 1,000 Megawatts (MW). Capacity is measured by output capability, while use is measured by quantity consumed per hour. So a 100MW power plant could supply 100MWH if it ran at 100% capacity for sixty minutes.

.avia-image-container.av-7tmlgf-8a8e7a1f3f37d5b164966cb674bb8034 img.avia_image{ box-shadow:none; } .avia-image-container.av-7tmlgf-8a8e7a1f3f37d5b164966cb674bb8034 .av-image-caption-overlay-center{ color:#ffffff; }

For those who forecast big shifts in how the U.S. generates electricity, year-to-year change is disappointingly slow. This is because the net additions to electricity generating capacity each year are only a small fraction of total capacity.

.avia-image-container.av-5ipzgv-fd2806eaa723477f622af0fb07cd9b8d img.avia_image{ box-shadow:none; } .avia-image-container.av-5ipzgv-fd2806eaa723477f622af0fb07cd9b8d .av-image-caption-overlay-center{ color:#ffffff; }

Last year we added 15 GW of net new generating capacity, the biggest in five years including a decent jump in wind and solar. Also notable was the ongoing retirement of coal plants. As the third chart shows, this is likely to continue because older power plants are more likely to be coal-burning. The challenge with wind and solar is that it’s not always windy and sunny, and since commercially viable, large scale storage is still ahead of us, utilization is lower for these categories than others.

.avia-image-container.av-46gsvz-4c37ac90513baf12e679b64478abab19 img.avia_image{ box-shadow:none; } .avia-image-container.av-46gsvz-4c37ac90513baf12e679b64478abab19 .av-image-caption-overlay-center{ color:#ffffff; }

To illustrate how slowly the existing electricity generation capacity changes, consider these figures: total generation capacity is 1.1 TW, or 1,100 GW. Very approximately, 1.1TW of capacity could theoretically produce 9,600 TWH in a year if everything ran at 100% (i.e. 1.1 X 365 days X 24 hours in a day is 9,636). So our consumption means we used 42% of this theoretical capacity. Since power needs fluctuate depending on the time of days as well as the seasons, and facilities need to be shut down for periodic maintenance, the industry is more efficient than this sounds.

.avia-image-container.av-2mzf0v-f532437ca3ba047a712aab1ec9d642c5 img.avia_image{ box-shadow:none; } .avia-image-container.av-2mzf0v-f532437ca3ba047a712aab1ec9d642c5 .av-image-caption-overlay-center{ color:#ffffff; }

But it puts the 15GW of new capacity in perspective since it represents around 1.5% of the installed base.  Even this overstates its impact because of the lower utilization rates of wind and solar.

Change is surely coming to how we source our power. Future generations will almost certainly rely far more heavily on solar. But over the next decade or so, change will appear slow.


Emerging Markets: Promises Unfulfilled, Time to Upgrade into MLPs

Most MLP investors are attracted by the regular distributions paid out by midstream infrastructure businesses. Some though, are wary of a repeat of the heightened volatility of 2015 even though evidence increasingly supports our analysis from early last year that an improbable confluence of circumstances was responsible (see The 2015 MLP Crash; Why and What’s Next).

I had just this conversation with a financial advisor last week, and I offered him the following perspective: if MLPs are too volatile to be an income substitute, an alternative approach is to consider them as a replacement for equity sectors that have similar volatility and with whom they share a meaningfully positive correlation.

Many advisors recommend an allocation to Emerging Markets (EM). The theory behind this is that because developing countries have faster GDP growth than developed countries, they should offer commensurately higher equity returns. The problem with this theory is that the transmission mechanism from GDP growth to equity returns is not uniformly effective all over the world. Weak corporate governance and property rights, uncertain contract law and government corruption can all interfere with a foreign investor’s GDP insight translating into appreciation of stock holdings.

Since 1996 (the inception of the Alerian Index, AMZX) the correlation of monthly returns on the MSCI Emerging Markets Index (MSCI-EM) with AMZX is 0.42. But it’s been rising, and over the past ten years it’s 0.53 and for the past five 0.55.Because the U.S. High Yield bond market is dominated by Energy issuers, when investors flee more risky borrowers their actions tend to ripple across Energy as well as EM. Asset class correlations generally have been rising, diminishing the benefits of some types of diversification. MLPs also have only around 80% of the volatility of EM. Moreover, since 1996 AMZX has returned 13.2% annually, almost four times the MSCI-EM’s 3.4% even though 2015 was a terrible year for the energy sector. Switching out of EM and into MLPs offers just this type of opportunity for a portfolio upgrade that doesn’t increase overall risk.

.avia-image-container.av-2xckpq-5d71e5adc2216b732ce7fb4ef58d215f img.avia_image{ box-shadow:none; } .avia-image-container.av-2xckpq-5d71e5adc2216b732ce7fb4ef58d215f .av-image-caption-overlay-center{ color:#ffffff; }

Some years ago when I was with JPMorgan, I was in India and had the opportunity to chat with a senior member of the Reserve Bank of India (RBI), the country’s central bank and securities market regulator. We had been meeting with Indian hedge fund managers while we considered the wisdom of adding an Indian investment to our portfolio.

“How many insider trading cases does the RBI prosecute in a typical year?” I casually enquired. “Oh none. There is no insider trading in India.” was the barely credible response. To which the only rational conclusion is that if your Indian investment manager isn’t actively using inside information, you’re unlikely to make much money. A JPMorgan due diligence questionnaire that sought an affirmative response on this question would have taken internal meetings with Compliance in a wholly unhelpful direction. We did not invest in India.

Most global companies have revenues and profits linked to EM. They have to allocate capital where they see the best opportunities, and navigate their way through each country’s business practices, laws and taxes to realize an appropriate return. The collective capital allocation decisions of the management of the S&P500 companies is almost certainly far better than that of any EM money manager screening locally listed stocks. If Coca Cola, P&G, Nike, Apple and so on in aggregate seek 3% exposure to Brazil, it takes a substantially mis-directed degree of self-confidence to assume one knows better. Therefore, many investors can hold their large cap equity positions and consider their optimal EM exposure achieved as well.

The S&P500 has generated an annual return of 8.6% since 1996, handily beating the MSCI-EM return of 3.4% noted earlier. In fact, the EM index is still 30% below its high from 2007, before the Financial Crisis. The figures clearly show that the relatively faster GDP growth of Developing Economies doesn’t translate into higher equity returns. Those investors seeking direct exposure are getting severely penalized.

Given the history and figures listed above, switching EM into MLPs is pretty compelling. The lower volatility of MLPs combined with their increasing correlation with EM means that the switch is likely to improve your portfolio’s risk characteristics. More importantly, it should substantially improve your return profile. MLPs regularly beat EM; since 1996, the one year trailing return on MLPs has beaten EM by at least 10% fully 48% of the time (the reverse statistic is only 24%). By contrast with EM, your domestic energy infrastructure investment benefits from attractive valuation, the tailwinds of America’s path to Energy Independence and a White House that is clearly supportive. Disputes over trade, a strengthening dollar or the overthrow of a foreign potentate are all challenges for the EM manager that will leave the MLP investor blissfully unharmed.

So if you’d like to participate in the secular growth in U.S. energy infrastructure that is driven by the Shale Revolution but are wary of classifying it as an income generating investment, use your EM bucket and improve your overall portfolio quality. If the K-1s put you off, look for a RIC-compliant mutual fund that provides 1099s.


What Matters More, Price or Volumes?

If you talk to investors about U.S. energy infrastructure, you’re pretty soon going to get to crude oil. A view on one is seemingly predicated on the other. Some investors mutter darkly about assertions in years back that Master Limited Partnerships (MLPs) are a toll-like business model with limited sensitivity to commodities. Although it remains largely accurate, such talk is rarely heard nowadays because it’s so at odds with recent market history. Fee-based cashflows and a pipeline network that is 93% non-crude oil (natural gas is a more frequent pipeline user) don’t sway people. So here are some charts and numbers to help.

.avia-image-container.av-asqwn8-c9121863f0f9e0fbb70b9baafc17310d img.avia_image{ box-shadow:none; } .avia-image-container.av-asqwn8-c9121863f0f9e0fbb70b9baafc17310d .av-image-caption-overlay-center{ color:#ffffff; }

Visually, MLPs and crude have had strong and weak relationships. We’re currently in a period of high correlation, because part of the MLP story relates to volume growth versus infrastructure capacity. Natural gas prices and MLPs have no statistical connection.

.avia-image-container.av-8gqn6s-bb6f8b7feb954fa75afc272a2ff847d9 img.avia_image{ box-shadow:none; } .avia-image-container.av-8gqn6s-bb6f8b7feb954fa75afc272a2ff847d9 .av-image-caption-overlay-center{ color:#ffffff; }

As we noted in MLP Investors Digest Supply, getting granular involves forecasting hydrocarbon output versus take-away capacity. The chart below on the Permian Basin illustrates.

.avia-image-container.av-rg06s-31f4611c3eb79e09f8ee4f142a389a49 img.avia_image{ box-shadow:none; } .avia-image-container.av-rg06s-31f4611c3eb79e09f8ee4f142a389a49 .av-image-caption-overlay-center{ color:#ffffff; }

Crude oil production and the means to transport it away are both expected to grow. Exploration and Production (E&P) companies co-ordinate closely with infrastructure providers to match oil supply with take-away capacity. An E&P company with no ability to get its output in a pipeline network is no happier than the owner of an empty pipe. Future Gathering and Processing take-away capacity has more visibility than does future output, but both sides are trying to match expectations. And of course there are many players of all sizes, which makes it a complex dance.  If you own infrastructure in the region you want output to grow faster than expected, increasing demand for your scarce resource. Higher oil prices make this more likely. Hence, some sensitivity between crude oil and MLPs makes sense, although not to the degree seen recently.

.avia-image-container.av-5u40as-1626abd1e316e5ecd12ab392fb346911 img.avia_image{ box-shadow:none; } .avia-image-container.av-5u40as-1626abd1e316e5ecd12ab392fb346911 .av-image-caption-overlay-center{ color:#ffffff; }

Over the last decade, U.S. crude oil and natural gas output have steadily increased, with a modest pullback in 2015-16. The above chart also shows that on an energy equivalent basis we produce almost twice as much natural gas as crude oil, which is why we often note that U.S. energy infrastructure is more of a natural gas story. As the chart below shows, natural gas production has expanded rapidly, seemingly oblivious to steadily declining prices. Dramatic improvements in efficiency are the reason, and the same thing is happening with shale production of oil.

.avia-image-container.av-enm44-54406e3029cd279e083e88f544c1abf9 img.avia_image{ box-shadow:none; } .avia-image-container.av-enm44-54406e3029cd279e083e88f544c1abf9 .av-image-caption-overlay-center{ color:#ffffff; }

Higher volumes have driven the need for more infrastructure and growth for MLPs. This is the more important relationship, and as the chart below shows, volumes have tracked MLPs better than prices. So a positive view on MLPs today rests on a forecast of continued growth in output. On Friday the weekly Baker Hughes U.S. rig count leapt by 21 to 789, up from 476 a year ago. The continued increase following the drop in crude prices shows that the domestic energy industry is less worried about falling oil than MLP investors seem to be.

.avia-image-container.av-23j6pw-79c87e66f6cd11921728b965da9d8fac img.avia_image{ box-shadow:none; } .avia-image-container.av-23j6pw-79c87e66f6cd11921728b965da9d8fac .av-image-caption-overlay-center{ color:#ffffff; }

Forecasting prices is difficult, but steadily higher volumes over time look like a much safer bet. As we noted last week in Shale Upends Conventional Thinking, demand for short-cycle projects is causing a shift in capex to the U.S. because that’s where a lot of those projects are. Long-cycle projects whose capital recycling extends out beyond the liquidity of the futures market (two-three years) are a bet on prices. That’s far more risky nowadays following last year’s collapse in crude pricing. The Energy Information Administration’s recent Annual Energy Outlook 2017 forecasts steadily rising crude oil production and continued near 4% annual growth in natural gas output. Crude prices matter in the short term, but over the long term volumes will drive returns.


Why Shale Upends Conventional Thinking

Long time subscribers will recall that back in 2015 this blog sought ever more creative and different ways to communicate the same message, which was that MLP prices had fallen far enough and represented compelling value. Bear markets have an unfortunate tendency to last longer than their opponents would like. Although the sector rebounded strongly in 2016, some of those 2015 blog posts were premature.

One lesson is that if you’re going to write constructively during a bear market, marshall your arguments and prepare to spread them over more weeks than you might anticipate. Last week MLPs and crude oil rediscovered their once close relationship, to the detriment of investors in energy infrastructure. Forewarned, your blogger will not expend all his constructive thoughts right away.

Prior to the Shale Revolution, MLPs were fairly described as having little correlation with commodity prices. Pipelines were a toll-like business model whose returns were driven by volumes. Today, much of the point of investing in the sector relies on the growth prospects made possible by the Shale Revolution. Ten years ago the need for new investment was limited; today it’s clear that to exploit newly accessible hydrocarbons, infrastructure needs to support these new locations. North Dakota was not known for oil, nor was Pennsylvania known for natural gas.

Therefore, the returns on energy infrastructure investments are nowadays more sensitive to growing domestic production and the consequent utilization of existing as well as planned infrastructure. To take one example, Plains GP Holdings (PAGP) anticipates a substantial increase in EBITDA if growing oil production absorbs more of its available pipeline capacity. Oil production reacts to prices; PAGP’s prospects are linked to those of its customers.

Last November’s strategy shift by OPEC to cut production was an ignominious admission that their prior effort to bankrupt the U.S. shale industry through low prices had failed. It represented a watershed event, the moment when it became clear that a new paradigm was in place, as we noted in The Changing Face of Oil Supply.

“Short-cycle opportunities” are what every oil company needs. Shale now counts the biggest integrated oil companies among its proponents. Exxon (XOM) CEO Darren Woods recently noted that a third of their capex budget is devoted to such opportunities. The key here is the liquidity of the oil futures market. If your project’s timeframe extends beyond the availability of hedge instruments, your IRR is going to be driven by things you can estimate but not control. The real revolution of shale is its short capital cycle; numerous wells are drilled cheaply, with fast but sharply declining production. Capital invested is returned with a year or two and risk can be hedged. Conventional projects require huge upfront commitments with long payback times and consequently uncertain economics.

The recent sharp drop in oil prices hasn’t been pleasant for producers anywhere. But consider the planners of a conventional project – a Final Investment Decision to proceed is a little less certain. Once capital is committed beyond a certain point, there’s little choice but to press on and accept whatever outcome markets deliver. Whereas shale producers, the group whose success ostensibly caused the 2015 crash, can cut back activity with comparative ease. They can just stop drilling, and wait. They can take advantage of even brief rallies in crude futures to hedge production and increase output.

.avia-image-container.av-2wthy3-9c85ce9ed87fb3d9b4e596ea621b33b6 img.avia_image{ box-shadow:none; } .avia-image-container.av-2wthy3-9c85ce9ed87fb3d9b4e596ea621b33b6 .av-image-caption-overlay-center{ color:#ffffff; }

This is why capex on conventional projects continues to fall, as shown in the attached chart from a recent presentation by Lars Eirik Nicolaisen of Rystad Energy. The longer term problem is shaping up to be insufficient investment in new supply to offset depletion of existing fields and new demand (estimated to require around 6% of new supply annually, about 6MMBD, or Millions of Barrels a Day).

The recent drop in crude demonstrates no shortage of supply currently, but also makes providing new supply less attractive in the long run.

MLP investors easily recall the 50.8% drop in the Alerian Index from August 2014-February 2016, its low coinciding to the day with that for oil. We don’t know where crude prices will go over the short term, but it’s becoming increasingly clear that the U.S. is set to gain market share because its short-cycle opportunities represent a substantially more attractive risk/return than conventional projects.

Reaching the long term requires navigating the short term. While you’re doing that, consider how you’d seek your company’s Board approval for a conventional oil project requiring ten years of output to recover its upfront cost. Those shale guys in the Permian could wreck your assumptions, and then protect themselves from the damage they’d wrought by quickly cutting their own capex and production. Without an adequate response, you might feel like moving to West Texas.

We are invested in PAGP

A few weeks ago I did an interview with friend Barry Ritholtz for his Bloomberg series “Masters in Business”. It was just posted online, so for those that are interested you can find it here. Comments on MLPs are at the 65 minutes mark.


MLP Investors Digest Supply

My partner Henry Hoffman and I spent Thursday last week at the Capital Link MLP Investing Forum in New York. The mood was cautiously optimistic but certainly wary of another commodity-linked swoon in prices. Meeting one-on-one with company managements is often the best part of such events. We had a very useful discussion with Crestwood’s (CEQP) Heath Deneke, COO and President of their Pipeline Services Group, along with Josh Wannarka, Investor Relations. We gained an improved understanding of CEQP’s strategic partnerships with long-time sponsor First Reserve and JV partner Con Edison. Both these relationships are important to CEQP’s growth prospects and represent a key differentiating feature.

Companies have been reporting 4Q16 earnings over the past few weeks. For Master Limited Partnerships (MLPs), the generally positive outlook has been at odds with market performance. In February the “Trump Bump” rally in the S&P500 was only weakly reflected in MLPs, resulting in +4.0% versus +0.4% respective performance.

The Permian Basin in West Texas remains the hottest area for shale production in the U.S. Earnings calls with those companies active there focused on growing production and whether the existing take-away infrastructure would be sufficient. The U.S. produces around 9 MMB/D (Millions of Barrel per Day) of crude oil. Approximately half of that is “tight”, and half of that comes from the Permian Basin (currently producing around 2.25MMB/D). When combined with Permian natural gas output on an energy equivalent basis, production is almost 3.5MMB/D.

Permian output was the most resilient of any of the major shale plays through 2015-16 with production continuing to grow almost oblivious to the collapse in pricing. This was entirely due to the ongoing productivity improvements that have led to high single digit annual cost improvements for Exploration and Production companies operating there. The Energy Information Administration (EIA) forecasts U.S. crude production will increase by another 0.5MMB/D 2017-18, and much of that is likely to occur in the Permian.

.avia-image-container.av-4riot5-ed4bdc5f9fbf3f5a9fbc722071eeafb1 img.avia_image{ box-shadow:none; } .avia-image-container.av-4riot5-ed4bdc5f9fbf3f5a9fbc722071eeafb1 .av-image-caption-overlay-center{ color:#ffffff; }

Reflecting the increased production forecast by E&P companies, several MLPs with Permian assets announced plans to increase take-away pipeline capacity where needed. These include 60MB/D (Thousand Barrels per Day) on Plain’s All American (PAGP) Cactus pipeline to Gardendale, Texas, 100 MB/D on the BridgeTex line into Houston (jointly owned by Magellan Midstream (MMP) and Plains All American (PAGP)) and 300 MB/D on the Permian Express II to Nederland, TX owned by Sunoco Logistics (SXL). In addition, Energy Transfer Partners (ETP) has an existing 100MB/D pipeline that is currently idle but could be restarted if demand was there. In summary, industry debate on this issue revolves around the ability to move increasing volumes.

This increased production is not necessarily consistent with OPEC’s objectives when they announced their own production cuts late last year. A gently rising oil price with minimal variability is their preferred scenario. Reports indicate that some OPEC members would like to see $60 oil so as to stimulate additional long term investment in new supply, thereby lowering the odds of a short-term, ruinous price spike that could hurt demand. As we’ve noted before (see The Changing Face of Oil Supply), conventional projects with their large up-front capital commitments and long payback times are vulnerable to U.S. shale production in a way that wasn’t previously contemplated.

Relying on the spot price of oil in assessing a 10+ year project is nowadays recklessly simplistic, making investments in conventional new supply riskier than in the past. Although U.S. production is growing, it won’t be sufficient to meet new global demand plus make up for depletion from existing fields (estimated at 6MMB/D, see Listen to What the Oil Price is Saying). Gently higher prices remain the most likely outcome but there’s more risk of a sharp move up rather than down.

Exxon Mobil (XOM) CEO Darren Woods reflected this new mindset in recent comments: “More than one third of the capex [capital and exploration spending] will be invested in advancing our large inventory of … short-cycle opportunities. They are primarily Permian and Bakken unconventional plays and short-cycle conventional work programs. This component of our investment plan is expected to generate positive cash flow less than three years after initial investment.”

In other words, long payback times are risky. Short payback projects are in the U.S.

The MLP investor who feels she’s missing out on the recent equity rally is rather non-plussed by this optimistic analysis. “If you’re so smart, how come I’m not richer?”

.avia-image-container.av-33awop-e932e984d66ac48ab7cb3dba7ce3bb30 img.avia_image{ box-shadow:none; } .avia-image-container.av-33awop-e932e984d66ac48ab7cb3dba7ce3bb30 .av-image-caption-overlay-center{ color:#ffffff; }

One reason is the overhang of equity being issued by some MLPs, to strengthen balance sheets and fund new projects. PAGP issued $1.3BN in equity; Targa Resources (TRGP) issued $450M to help fund it’s acquisition of Permian focused Outrigger Energy. There was also a sale of 7.2MM shares in Targa Resources (TRGP) by a private equity investor who converted warrants acquired a year ago, booking a nice profit. And a few weeks earlier Williams Companies (WMB) raised $1.9BN. The table shows the many issues of new equity in recent weeks, as well as inflows to mutual funds and ETFs. It’s an incomplete picture, and by definition the almost $6BN in equity sales has been matched with an equal amount of buying. The use of this new capital, mainly to strengthen balance sheets and fund accretive growth, is definitely positive. But over the near term this new supply approximately absorbed 1Q distributions paid by MLPs.

Another headwind is that it’s once again been a mild winter. Rapidly receding snow has plenty of appeal, but the downside is that it reduces natural gas demand. MLPs care about volumes, and we’re using less natural gas than expected to heat homes in the north.

Nonetheless, valuations remain compelling. For the momentum investor it’s easy to feel good buying stocks. But for the more discerning who care about values, at a time when most sectors of the stock market are close to all-time highs, the Alerian Index yields around 6.8%, 4.6% above the ten year treasury and still 1.2% wider than the 20 year average. We may have bounced 75% off the low of February 11th, 2016 but still remain 27% off the August 2014 high.

We are invested in CEQP, MMP, PAGP, TRGP, & WMB


Shale Security

America’s path to Energy Independence is taking place through myriad advances in hydrocarbon output, driven by the many advantages we possess. In America Is Great! we noted the benefits of America’s energy sector’s large skilled labor force, access to capital, culture of entrepreneurialism, constant drive for productivity improvements, ready availability of water, vast network of infrastructure and private ownership of mineral rights as key elements driving the Shale Revolution.

Take a step back though and consider the broader implications of an America no longer reliant on foreign sources of energy. We can all be armchair geopolitical analysts as we ponder the ramifications. Peter Zeihan has done just this in his latest book, The Absent Superpower: The Shale Revolution and a World Without America. It follows up on his previous 2014 book, The Accidental Superpower: The Next Generation of American Preeminence and Coming Global Disorder, and contemplates the shifting alliances and security needs of both world and regional powers. They were published a couple of years apart, and the world had changed only somewhat during this intervening period which results in certain sections appearing as if they would be at home in either book.

.avia-image-container.av-7fmhe-7954166761890eb3dbad4998305f8f83 img.avia_image{ box-shadow:none; } .avia-image-container.av-7fmhe-7954166761890eb3dbad4998305f8f83 .av-image-caption-overlay-center{ color:#ffffff; }

Absent Superpower, the more recent volume, is worth reading just for Part I: Shale New World. Zeihan runs through an absorbing account of shale drilling including its history, numerous technological advances and why America is pretty much the only game in town. He then moves from energy sector expert to examine the broader global implications. Geopolitical trends can unfold at the pace of demographic change, which is to say they’re fascinating to look back on but not likely to drive investment returns over anything shorter than multi-year intervals. An America secure in its energy needs can more readily disengage from maintaining the global security order. War in the Middle East and a disruption in crude oil shipments would still harm us, but not nearly as much as in the past. Since World War II, America has acted on its interests but has often defined those interests broadly enough so as to include spreading democracy and free markets around the globe. Although Absent Superpower was finished before the 2016 election, Zeihan identifies the growing populism which demands clearer payback for the application of American power. If we care less about the rest of the world, or acknowledge limitations on our ability to right every wrong, the resulting power vacuum will draw in others.

Here Zeihan embarks on a series of specific and invariably violent forecasts of armed conflict (“the Disorder”), most notably between Russia and its European neighbors. This is driven by Russia’s need for the coherent geographical borders that made the former Soviet Union more easily defensible than allowed in its shrunken form today. Such precise expectations are almost guaranteed to be wrong; Zeihan clearly hasn’t studied Behavioral Finance, which shows that humans often have unreasonably high confidence about their predictions, whether of stock returns or the number of jellybeans in a jar. And disappointingly, although perhaps unsurprisingly given the rapid publication of his second book after the first, themes and arguments are repeated in Absent Superpower to the frustration of one who’s read both. Zeihan works his underlying theme, which is that Geography and Resources are Destiny, to explain much of human history in ways that are often compelling. He fearlessly builds on his conclusions to make sweeping forecasts.

However, he’s virtually certain to be wrong in specifics. For example, consider the following, “…the British Navy will sink the entirety of the one Russian naval force that might have been able to sail to the Baltic warzone; the Northern Fleet, based near Murmansk” It’s hard to imagine this happening without the subsequent use of nuclear weapons, which both antagonists possess but Zeihan ignores. Later, he describes, “the East Asian Tanker War” with “Japan and China the primary competitors.”  So pass these off as speculative prose reflective of just a couple among many possibilities. On more solid ground, Zeihan graphically illustrates the shifting flows of trade in hydrocarbons, with North America eventually dropping imports from west Africa and the Middle East in favor of supplies at home.

A less engaged America, secure in its resources and defense, responding to political shifts that demand greater attention at home, seems highly likely. Zeihan describes the United States as, “the only power with global power and global reach…but…without global interests.” A critical supporting pillar of this evolving stance is energy independence. So while the future is always uncertain, it does seem reasonable to assign a value to domestic hydrocarbons greater than their pure economic one. In other words, national security and the Shale Revolution are far more intertwined than you might think. Quickly approving the Dakota Access and Keystone XL pipelines are examples of the new Administration making decisions that fit within the type of policy framework described. The rolling back of regulations that impede domestic energy similarly fall within the same sphere. The White House has published An America First Energy Plan which leads with the goal of maximizing, “…the use of American resources, freeing us from dependence on foreign oil.” In this new world, a bet on public policy being increasingly supportive of the domestic energy sector seems like a good one.


The Sand Rush

The resilience of the Shale Revolution in in the face of the 2015-16 oil price collapse is due in large part to dramatic improvements in productivity. Exploration and Production companies have strived to achieve more while using less of everything. Fewer rigs, for shorter times; less cement by drilling multiple wells on a pad; less water by recycling, and so on. But there’s one commodity whose volumes are growing substantially. Sand.

Hydraulic fracturing (“fracking”) involves pumping water combined with some other chemicals and sand (called “proppant”) into wells at high pressure. The rock cracks in millions of places as a result, and the sand allows the hydrocarbons to flow as the grains prop open these numerous cracks.

.avia-image-container.av-6899k3-367cf7a4d236a0da89c3cceba3015b20 img.avia_image{ box-shadow:none; } .avia-image-container.av-6899k3-367cf7a4d236a0da89c3cceba3015b20 .av-image-caption-overlay-center{ color:#ffffff; }

As fracking techniques have evolved, it’s turning out that more sand is better than less. Finer sand props open tinier cracks as well as being easier to transport. The need for more sand per well along with the increasing rig count have led to a big jump in sand use by the industry. A year ago I was at a dinner at which a senior executive from Antero Midstream (AM) described how this was playing out. Subsequently we’ve seen E&P companies such as Pioneer Natural Resources (PXD) note the advances made through increased sand utilization.

Goldman Sachs sees 36% annual growth in sand use by the industry, far faster than projections of oil and gas production. It means the price per ton of sand is increasing, and success for suppliers relies heavily on logistics.

.avia-image-container.av-3hfiur-a7e541614141865a41e37109c6424caa img.avia_image{ box-shadow:none; } .avia-image-container.av-3hfiur-a7e541614141865a41e37109c6424caa .av-image-caption-overlay-center{ color:#ffffff; }

Sand is heavy, so proximity to customers saves on transportation. Wisconsin is a key supplier of sand to the Bakken Shale in North Dakota. Illinois ships sand to the Permian in West Texas, although in-state Texan mine sources clearly have a big edge. Access to rail transportation is another key differentiator for suppliers, as are improvements in ease of delivery. Faster drop-off reduces truck waiting times and helps profitability. U.S. Silica (SLCA) is a leading supplier of sand to the oil and gas industry. They have positioned themselves as a consolidator in an industry still wrestling with too much debt. Their advantages include ready access to four large rail networks as well as substantial assets in Texas, both of which allow them to deliver sand more cheaply than their peers.

.avia-image-container.av-ah5df-68b225f167c2dc1a67fe8e52c8505e67 img.avia_image{ box-shadow:none; } .avia-image-container.av-ah5df-68b225f167c2dc1a67fe8e52c8505e67 .av-image-caption-overlay-center{ color:#ffffff; }

Last year SLCA acquired a company called Sandbox. Sandbox shipping containers allow for easier handling of sand, cutting delivery times as well as reducing the release of silica dust. SLCA has ambitious goals for their patented container technology, aiming to increase market share from 10% to 40-50%. Sandbox represents a form of vertical integration by SLCA using better technology as they seek wider margins in a tightening market. It’s one of the less well known stories in the Shale Revolution, but provides an example of the type of innovation that is driving increased output as we head towards Energy Independence. Notwithstanding its drop on Thursday following earnings, we continue to like its longer term prospects.

We are invested in SLCA


The Changing Face of Oil Supply

There’s a developing paradigm shift under way in the oil market. It is manifesting itself through the quarterly earnings reports of many energy sector companies. At a high level, discoveries of new oil and gas fields recently fell to a 60-year low. Last year there were 174 oil and gas discoveries, compared with 400-500 a year until 2013. 8.2BN barrels equivalent of oil and gas were found, a fifth of the equivalent figure in 2010 and a level last seen in the 1950s.

Capex budgets for conventional exploration have been slashed. Chevron (CVX) cut their $3BN 2015 budget to $1BN last year. ConocoPhillips (COP) is pulling out of new deepwater projects altogether. Baker Hughes (BHI), who provide services to the industry, saw weakness in their non-U.S. business that was partially offset by strength in the U.S.

But not everyone is cutting back. Marathon Oil (MPC) is doubling its investment in new shale projects. Continental Resources (CLR) is spending $1.7BN which they expect will drive 20% annual growth in oil and gas output through 2020. Devon Energy (DVN) is planning to add rigs in the Barnett Shale where they’ll exploit advances in technology to “refrac” previously drilled wells. On DVN’s recent earnings call, CEO David Hager described their plans to use modern drilling and completion technology in areas that had previously exhausted their commercially viable output.

These companies and others like them are the customers of the energy infrastructure businesses that we own. For example, Enlink Midstream Partners (ENLK) is the direct beneficiary of DVN’s activity because their increased output will flow through ENLK’s infrastructure. It doesn’t hurt that ENLK’s General partner, Enlink Midstream LLC (ENLC), is owned by DVN. So we follow the plans of domestic Exploration and Production (E&P) companies even though we’re not directly invested in them.

The crude oil market (and to a lesser extent natural gas),  is shifting in ways that are incredibly favorable to  the U.S. The key lies in the differences between shale and conventional production.

.avia-image-container.av-23twf9-affb9c6913c5622c7d09601eb39ac504 img.avia_image{ box-shadow:none; } .avia-image-container.av-23twf9-affb9c6913c5622c7d09601eb39ac504 .av-image-caption-overlay-center{ color:#ffffff; }

The reasons are in the table above, and were described in America Is Great! Conventional oil projects take a long time to implement and earn back their capital investment. Shale projects are the opposite. To understand how the U.S. is the big winner, consider how you would evaluate a conventional oil project costing, say, $1BN up front with a ten year payback period that is profitable only with oil above $50.

Once you commit, you can only hedge your crude exposure out for two or three years. You can analyze the oil market and arrive at reasonable price projections, but it was at $26 a barrel a year ago. So it might get there again. Shale technology keeps improving, so you have to assume that breakeven costs for shale output will continue to fall. It was shale output that caused the last crash. In approving the $1BN investment you have to make a judgment on the probability of a ruinously low oil price making your project unprofitable. And you can’t hedge this risk.

People often ask me what is the breakeven for U.S. shale production. There is no specific number, it varies from less than $20 per barrel in some places to well over $100. The production that is profitable takes place, and the unprofitable doesn’t. Profitability isn’t binary, with the industry all making profits above $X per barrel and losing money below. Costs can be substantially different even within the same play. It’s not a homogeneous industry. It’s more accurate to think of a finely graduated supply curve that increases output by 25-50K barrels a day for each $1 increase in price. Their short response time allows shale producers to drill and complete additional  wells within months in response to improved economics.

Over the next ten years crude oil might stay above the $50 breakeven in the hypothetical project described above, and yet the project never get done because the risk of a price collapse was ever-present, hanging over the project’s IRR like the sword of Damocles. In this way, supply that could have been produced commercially will not come to market, allowing the nimble producer with a short response time to benefit from prices higher than they might have been otherwise. Because shale producers don’t face the same magnitude of price risk, they are in a far stronger position. Last week, the U.S. exported 1 MMB/D of crude oil. BP CEO Bob Dudley recently said that U.S. shale production will keep a check on any spikes in oil prices.

Price cycles in crude oil should be milder in the future, because the market has a shorter response time for new supply. Costs will continue to fall for “tight” oil and gas. America’s energy business has extraordinarily strong prospects.

We are invested in ENLC


A Year After the MLP Crash

A year ago, on February 11th, the Alerian MLP Index (AMZX) put in its low. Following a relentless 58.2% drop from its peak on August 29th, 2014, the selling was finally exhausted. As a retired bond trader friend of mine has said, “Down was a long way”. And indeed it was. The biggest and longest bear market in the history of the index since its creation in 1996. As one whose portfolio holds MLPs in rather more abundance than most readers, I shan’t soon forget the wonder with which we regarded such wholesale liquidation. We never accepted that operating performance of midstream businesses was correctly reflected in those prices. Our conclusion about 2015 was that the real issue was one of the industry needing more growth capital than was available from its fairly narrow traditional investor base (who must generally be U.S., high net worth, taxable and K-1 tolerant). We first articulated this view in The 2015 MLP Crash; Why and What’s Next. The subsequent rebound seemed to support this, since operating results for midstream MLPs generally continued to be within expectations. More recently, in MLPs Feel the Love, we continued with this theme of different investor segments by reviewing how the need for capital was causing some energy infrastructure firms to adapt their corporate structure.

The Alerian Index shows distribution growth that never faltered, dipping only slightly from 6.3% in 2014 to 5.1% in 2015. How could any sector fall so far while continuing to grow payouts? In truth, it does present a slightly rosy picture, as the historic growth figures are based on today’s components of the index. Those MLPs (mostly Exploration and Production, not midstream) who cut or eliminated distributions were ejected from the index, and they took their past with them. Some might find this revisionist history somewhat Orwellian, although hedge fund index providers routinely “backfill” their index series with performance of new additions while removing all trace of those who drop out. Since good performance tends to get you in an index and bad performance gets you out, the consequently recalculated past results are not so easily attainable. Investors who held a cap-weighted portfolio of MLPs seeking to track the index in real time experienced a rather bumpier ride. Nonetheless, today distributions are increasing. Based on quarterly earnings reported so far, R.W. Baird notes 3.0% year-on-year growth in MLP payouts.

Readers should not assume any smugness on our part simply because MLPs have rebounded 77% from the low of a year ago. Such would surely invite the Market Gods to react. There’s always downside, but it does at least appear that today’s MLP investors have committed capital with more thought than the cohort who exited in 2015. All it takes is a glance at recent history to see what the downside might look like if repeated. It wasn’t pretty, but the energy infrastructure industry has upgraded its financiers. Those whose research consists of a price chart have been replaced with a crowd of deeper thinkers, to everybody’s benefit. Many of today’s MLP investors came in because of values, not momentum.

.avia-image-container.av-4jj1ta-0c31faa022c44fa08c1311f985bef07e img.avia_image{ box-shadow:none; } .avia-image-container.av-4jj1ta-0c31faa022c44fa08c1311f985bef07e .av-image-caption-overlay-center{ color:#ffffff; }

Views on energy infrastructure became synonymous with crude oil over the last couple of years, for good reason. We long ago ditched the slide showing a low correlation between the two. Although the relationship has varied substantially over the past two decades, the Shale Revolution has probably shifted things. Since MLPs care about volume, before domestic energy production was expanding the basic question concerned utilization of the existing network of infrastructure. Now that America can see its way to Energy Independence, supported by increasing domestic production, investors reasonably ask if the additions to infrastructure will be fully utilized. Fluctuations in oil and gas prices do impact production, and large swathes of the U.S. now benefit from higher oil whereas traditionally, lower crude was regarded as a tax cut. Moreover, the Energy ETF XLE now includes energy infrastructure names such as Kinder Morgan (KMI) and Spectra (SE), as well as other energy names that own infrastructure assets. This will inevitably strengthen the relationship between moves in the energy sector and the infrastructure that supports it.

Although the correlation has been falling recently, a stronger positive relationship is likely in the future. We believe there is a good case for rising crude prices (see Why Oil Could Be Higher for Longer) which will further underpin MLP performance. BP just revealed that their business model is predicated on a $60 price for oil by the end of 2018, higher than where it is today.

.avia-image-container.av-1ttlq6-60f8631f3313911030acc8367d296014 img.avia_image{ box-shadow:none; } .avia-image-container.av-1ttlq6-60f8631f3313911030acc8367d296014 .av-image-caption-overlay-center{ color:#ffffff; }

One of the minor positives of recent media coverage has been the absence of many bullish articles in the financial press. Regrettably, Barron’s finally found the confidence to move out along the ledge with a cautiously optimistic piece last weekend. Is It Too Late To Get In on MLPs’ Latest Bull Run does at least acknowledge in the title that 77% and 12 months after the low they are not exactly catching the proverbial falling knife. Fortunately, constructive articles are not yet an onslaught, so it’s still possible to own MLPs without fearing that it’s everyone’s favorite trade. A year ago bearish articles were abundant, including MLPs: Is the Worst Over? Within days of the low, this Barron’s piece (originally titled The Worst Isn’t Over as its URL betrays) countered its cautiously optimistic heading by quoting a breathless young analyst, “We’re in the early innings of the MLP down-cycle…we had a 15-year up-cycle, and now we’re a year and a half into the downturn.”

The investment writer unburdened by responsibility for managing other people’s money can draw comfort from the knowledge that the victims of poor advice may be few or even non-existent. Much is written and read on investments without being acted upon. Our own constructive tone in writing on MLPs in 2015 contrasted rather painfully with investment results that mocked our prose. One client memorably noted that it would be nice if the quality of our writing was matched by investment performance!

The fee-paying deserve the privilege of offering such feedback. Assuming the writing has remained interesting, over the last year its congruence with returns has improved dramatically.

On a separate note, from time to time fears surface that MLPs will lose their special tax status and be taxed like regular corporations. It’s highly unlikely, but in any event the status quo received support recently from Congress’s Joint Committee on Taxation which estimated foregone revenues from 2016-20 at $4.9BN, down $1BN from prior estimates.  Part of the reason is that some MLP investors pay tax on their holdings, notably investors in AMLP and other taxable, C-corp MLP funds (see Some MLP Investors Get Taxed Twice). Not only are such investors hurting themselves, but they’re helping the rest of us by making a revision of MLP tax treatment even less likely. A generous bunch.

We are invested in KMI and SE